Lithuania Packaged Milkshakes Market (2026-2032) | Consumer Insights, Companies, Revenue, Supply, Strategy, Trends, Share, Competitive, Segments, Opportunities, Pricing Analysis, Competition, Outlook, Segmentation, Industry, Size, Strategic Insights, Growth, Value, Forecast, Challenges, Investment Trends, Demand, Drivers, Restraints, Analysis
Market Forecast By Type (Dairy-Based, Plant-Based, Protein-Enriched, Others), By Flavor Type (Chocolate, Vanilla, Strawberry, Coffee), By Packaging Type (Bottles, Cartons, Cans, Pouches), By Distribution Channel (Supermarkets, Convenience Stores, Online Stores, Specialty Stores) And Competitive Landscape
| Product Code: ETC13052730 | Publication Date: Apr 2025 | Updated Date: Apr 2026 | Product Type: Market Research Report | |
| Publisher: 6Wresearch | Author: Sachin Kumar Rai | No. of Pages: 65 | No. of Figures: 34 | No. of Tables: 19 |
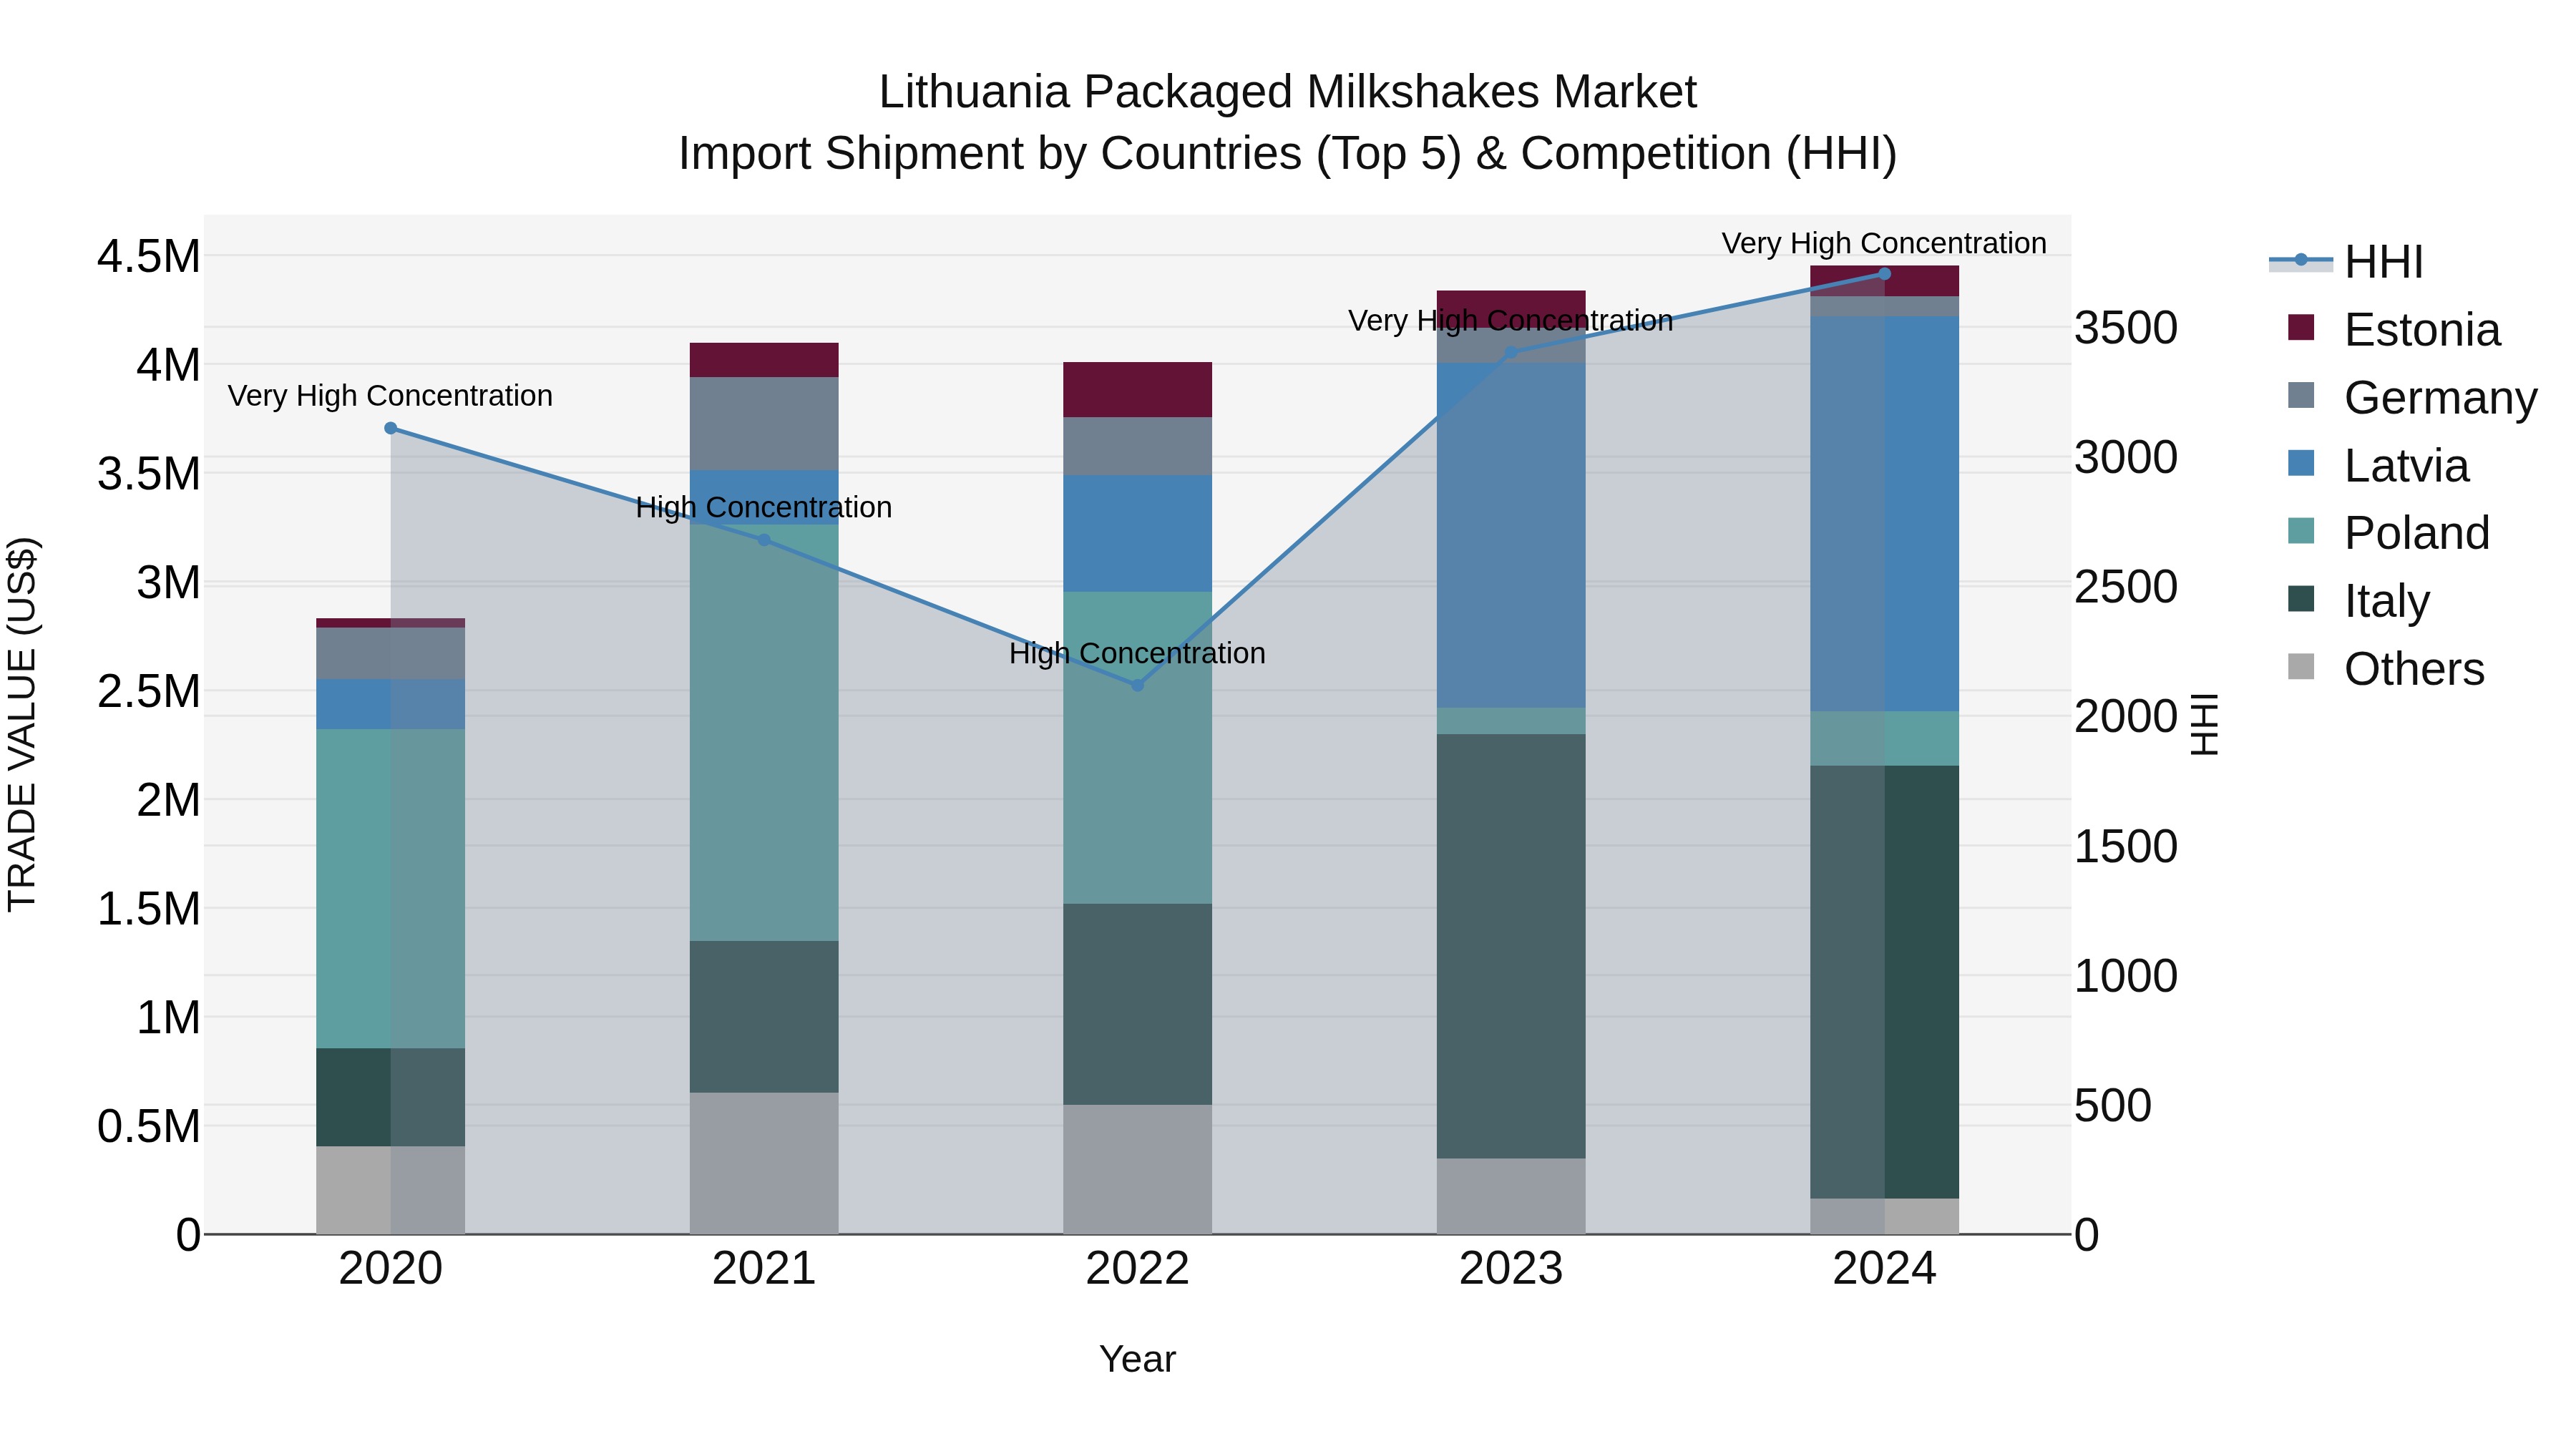
Lithuania Packaged Milkshakes Market Top 5 Importing Countries and Market Competition (HHI) Analysis
In 2024, Lithuania continued to see a strong demand for packaged milkshakes, with top exporting countries including Italy, Latvia, Poland, Estonia, and Germany. The high Herfindahl-Hirschman Index (HHI) indicates a concentrated market, suggesting potential challenges for new entrants. The impressive compound annual growth rate (CAGR) of 11.98% from 2020 to 2024 demonstrates a thriving industry. The growth rate of 2.63% from 2023 to 2024 indicates a steady expansion in the market, showcasing sustained interest in imported milkshake products among Lithuanian consumers.
Key Highlights of the Report:
- Lithuania Packaged Milkshakes Market Outlook
- Market Size of Lithuania Packaged Milkshakes Market, 2025
- Forecast of Lithuania Packaged Milkshakes Market, 2032
- Historical Data and Forecast of Lithuania Packaged Milkshakes Revenues & Volume for the Period 2022 - 2032F
- Lithuania Packaged Milkshakes Market Trend Evolution
- Lithuania Packaged Milkshakes Market Drivers and Challenges
- Lithuania Packaged Milkshakes Price Trends
- Lithuania Packaged Milkshakes Porter's Five Forces
- Lithuania Packaged Milkshakes Industry Life Cycle
- Historical Data and Forecast of Lithuania Packaged Milkshakes Market Revenues & Volume By Type for the Period 2022 - 2032F
- Historical Data and Forecast of Lithuania Packaged Milkshakes Market Revenues & Volume By Dairy-Based for the Period 2022 - 2032F
- Historical Data and Forecast of Lithuania Packaged Milkshakes Market Revenues & Volume By Plant-Based for the Period 2022 - 2032F
- Historical Data and Forecast of Lithuania Packaged Milkshakes Market Revenues & Volume By Protein-Enriched for the Period 2022 - 2032F
- Historical Data and Forecast of Lithuania Packaged Milkshakes Market Revenues & Volume By Others for the Period 2022 - 2032F
- Historical Data and Forecast of Lithuania Packaged Milkshakes Market Revenues & Volume By Flavor Type for the Period 2022 - 2032F
- Historical Data and Forecast of Lithuania Packaged Milkshakes Market Revenues & Volume By Chocolate for the Period 2022 - 2032F
- Historical Data and Forecast of Lithuania Packaged Milkshakes Market Revenues & Volume By Vanilla for the Period 2022 - 2032F
- Historical Data and Forecast of Lithuania Packaged Milkshakes Market Revenues & Volume By Strawberry for the Period 2022 - 2032F
- Historical Data and Forecast of Lithuania Packaged Milkshakes Market Revenues & Volume By Coffee for the Period 2022 - 2032F
- Historical Data and Forecast of Lithuania Packaged Milkshakes Market Revenues & Volume By Packaging Type for the Period 2022 - 2032F
- Historical Data and Forecast of Lithuania Packaged Milkshakes Market Revenues & Volume By Bottles for the Period 2022 - 2032F
- Historical Data and Forecast of Lithuania Packaged Milkshakes Market Revenues & Volume By Cartons for the Period 2022 - 2032F
- Historical Data and Forecast of Lithuania Packaged Milkshakes Market Revenues & Volume By Cans for the Period 2022 - 2032F
- Historical Data and Forecast of Lithuania Packaged Milkshakes Market Revenues & Volume By Pouches for the Period 2022 - 2032F
- Historical Data and Forecast of Lithuania Packaged Milkshakes Market Revenues & Volume By Distribution Channel for the Period 2022 - 2032F
- Historical Data and Forecast of Lithuania Packaged Milkshakes Market Revenues & Volume By Supermarkets for the Period 2022 - 2032F
- Historical Data and Forecast of Lithuania Packaged Milkshakes Market Revenues & Volume By Convenience Stores for the Period 2022 - 2032F
- Historical Data and Forecast of Lithuania Packaged Milkshakes Market Revenues & Volume By Online Stores for the Period 2022 - 2032F
- Historical Data and Forecast of Lithuania Packaged Milkshakes Market Revenues & Volume By Specialty Stores for the Period 2022 - 2032F
- Lithuania Packaged Milkshakes Import Export Trade Statistics
- Market Opportunity Assessment By Type
- Market Opportunity Assessment By Flavor Type
- Market Opportunity Assessment By Packaging Type
- Market Opportunity Assessment By Distribution Channel
- Lithuania Packaged Milkshakes Top Companies Market Share
- Lithuania Packaged Milkshakes Competitive Benchmarking By Technical and Operational Parameters
- Lithuania Packaged Milkshakes Company Profiles
- Lithuania Packaged Milkshakes Key Strategic Recommendations
Frequently Asked Questions About the Market Study (FAQs):
6Wresearch actively monitors the Lithuania Packaged Milkshakes Market and publishes its comprehensive annual report, highlighting emerging trends, growth drivers, revenue analysis, and forecast outlook. Our insights help businesses to make data-backed strategic decisions with ongoing market dynamics. Our analysts track relevent industries related to the Lithuania Packaged Milkshakes Market, allowing our clients with actionable intelligence and reliable forecasts tailored to emerging regional needs.
Yes, we provide customisation as per your requirements. To learn more, feel free to contact us on sales@6wresearch.com
1 Executive Summary |
2 Introduction |
2.1 Key Highlights of the Report |
2.2 Report Description |
2.3 Market Scope & Segmentation |
2.4 Research Methodology |
2.5 Assumptions |
3 Lithuania Packaged Milkshakes Market Overview |
3.1 Lithuania Country Macro Economic Indicators |
3.2 Lithuania Packaged Milkshakes Market Revenues & Volume, 2022 & 2032F |
3.3 Lithuania Packaged Milkshakes Market - Industry Life Cycle |
3.4 Lithuania Packaged Milkshakes Market - Porter's Five Forces |
3.5 Lithuania Packaged Milkshakes Market Revenues & Volume Share, By Type, 2022 & 2032F |
3.6 Lithuania Packaged Milkshakes Market Revenues & Volume Share, By Flavor Type, 2022 & 2032F |
3.7 Lithuania Packaged Milkshakes Market Revenues & Volume Share, By Packaging Type, 2022 & 2032F |
3.8 Lithuania Packaged Milkshakes Market Revenues & Volume Share, By Distribution Channel, 2022 & 2032F |
4 Lithuania Packaged Milkshakes Market Dynamics |
4.1 Impact Analysis |
4.2 Market Drivers |
4.2.1 Increasing health consciousness among consumers leading to a growing demand for healthier beverage options like packaged milkshakes. |
4.2.2 Rising disposable income in Lithuania, allowing consumers to indulge in convenience products like packaged milkshakes. |
4.2.3 Busy lifestyles and on-the-go consumption trends driving the need for convenient, ready-to-drink products like packaged milkshakes. |
4.3 Market Restraints |
4.3.1 Market saturation with existing milkshake products leading to intense competition among manufacturers. |
4.3.2 Fluctuating raw material prices impacting production costs and potentially leading to price fluctuations for packaged milkshakes. |
4.3.3 Regulatory challenges and strict quality standards affecting product innovation and market entry for new players. |
5 Lithuania Packaged Milkshakes Market Trends |
6 Lithuania Packaged Milkshakes Market, By Types |
6.1 Lithuania Packaged Milkshakes Market, By Type |
6.1.1 Overview and Analysis |
6.1.2 Lithuania Packaged Milkshakes Market Revenues & Volume, By Type, 2022 - 2032F |
6.1.3 Lithuania Packaged Milkshakes Market Revenues & Volume, By Dairy-Based, 2022 - 2032F |
6.1.4 Lithuania Packaged Milkshakes Market Revenues & Volume, By Plant-Based, 2022 - 2032F |
6.1.5 Lithuania Packaged Milkshakes Market Revenues & Volume, By Protein-Enriched, 2022 - 2032F |
6.1.6 Lithuania Packaged Milkshakes Market Revenues & Volume, By Others, 2022 - 2032F |
6.2 Lithuania Packaged Milkshakes Market, By Flavor Type |
6.2.1 Overview and Analysis |
6.2.2 Lithuania Packaged Milkshakes Market Revenues & Volume, By Chocolate, 2022 - 2032F |
6.2.3 Lithuania Packaged Milkshakes Market Revenues & Volume, By Vanilla, 2022 - 2032F |
6.2.4 Lithuania Packaged Milkshakes Market Revenues & Volume, By Strawberry, 2022 - 2032F |
6.2.5 Lithuania Packaged Milkshakes Market Revenues & Volume, By Coffee, 2022 - 2032F |
6.3 Lithuania Packaged Milkshakes Market, By Packaging Type |
6.3.1 Overview and Analysis |
6.3.2 Lithuania Packaged Milkshakes Market Revenues & Volume, By Bottles, 2022 - 2032F |
6.3.3 Lithuania Packaged Milkshakes Market Revenues & Volume, By Cartons, 2022 - 2032F |
6.3.4 Lithuania Packaged Milkshakes Market Revenues & Volume, By Cans, 2022 - 2032F |
6.3.5 Lithuania Packaged Milkshakes Market Revenues & Volume, By Pouches, 2022 - 2032F |
6.4 Lithuania Packaged Milkshakes Market, By Distribution Channel |
6.4.1 Overview and Analysis |
6.4.2 Lithuania Packaged Milkshakes Market Revenues & Volume, By Supermarkets, 2022 - 2032F |
6.4.3 Lithuania Packaged Milkshakes Market Revenues & Volume, By Convenience Stores, 2022 - 2032F |
6.4.4 Lithuania Packaged Milkshakes Market Revenues & Volume, By Online Stores, 2022 - 2032F |
6.4.5 Lithuania Packaged Milkshakes Market Revenues & Volume, By Specialty Stores, 2022 - 2032F |
7 Lithuania Packaged Milkshakes Market Import-Export Trade Statistics |
7.1 Lithuania Packaged Milkshakes Market Export to Major Countries |
7.2 Lithuania Packaged Milkshakes Market Imports from Major Countries |
8 Lithuania Packaged Milkshakes Market Key Performance Indicators |
8.1 Consumer engagement metrics (social media interactions, customer reviews) to gauge brand loyalty and market perception. |
8.2 Distribution network expansion (number of new retail outlets, partnerships with cafes/restaurants) to assess market penetration and accessibility. |
8.3 Sustainability initiatives (use of eco-friendly packaging, waste reduction strategies) to measure brand reputation and environmental impact. |
9 Lithuania Packaged Milkshakes Market - Opportunity Assessment |
9.1 Lithuania Packaged Milkshakes Market Opportunity Assessment, By Type, 2022 & 2032F |
9.2 Lithuania Packaged Milkshakes Market Opportunity Assessment, By Flavor Type, 2022 & 2032F |
9.3 Lithuania Packaged Milkshakes Market Opportunity Assessment, By Packaging Type, 2022 & 2032F |
9.4 Lithuania Packaged Milkshakes Market Opportunity Assessment, By Distribution Channel, 2022 & 2032F |
10 Lithuania Packaged Milkshakes Market - Competitive Landscape |
10.1 Lithuania Packaged Milkshakes Market Revenue Share, By Companies, 2025 |
10.2 Lithuania Packaged Milkshakes Market Competitive Benchmarking, By Operating and Technical Parameters |
11 Company Profiles |
12 Recommendations |
13 Disclaimer |
Global Go To Market Strategy - 2030
Export potential enables firms to identify high-growth global markets with greater confidence by combining advanced trade intelligence with a structured quantitative methodology. The framework analyzes emerging demand trends and country-level import patterns while integrating macroeconomic and trade datasets such as GDP and population forecasts, bilateral import–export flows, tariff structures, elasticity differentials between developed and developing economies, geographic distance, and import demand projections. Using weighted trade values from 2020–2024 as the base period to project country-to-country export potential for 2030, these inputs are operationalized through calculated drivers such as gravity model parameters, tariff impact factors, and projected GDP per-capita growth. Through an analysis of hidden potentials, demand hotspots, and market conditions that are most favorable to success, this method enables firms to focus on target countries, maximize returns, and global expansion with data, backed by accuracy.
By factoring in the projected importer demand gap that is currently unmet and could be potential opportunity, it identifies the potential for the Exporter (Country) among 190 countries, against the general trade analysis, which identifies the biggest importer or exporter.
To discover high-growth global markets and optimize your business strategy:
Click Here
Pricing
- Single User License$ 1,995
- Department License$ 2,400
- Site License$ 3,120
- Global License$ 3,795

Leadership Perspectives from Industry Events
Search
Thought Leadership and Analyst Meet


Our Clients
6WResearch In News
- Doha a strategic location for EV manufacturing hub: IPA Qatar
- Demand for luxury TVs surging in the GCC, says Samsung
- Empowering Growth: The Thriving Journey of Bangladesh’s Cable Industry
- Demand for luxury TVs surging in the GCC, says Samsung
- Video call with a traditional healer? Once unthinkable, it’s now common in South Africa
- Intelligent Buildings To Smooth GCC’s Path To Net Zero
Latest Reports
- Taiwan Airport Wireless Infrastructure Market (2026-2032)
- Vietnam Airport Wireless Infrastructure Market (2026-2032)
- Thailand Airport Wireless Infrastructure Market (2026-2032)
- South Korea Airport Wireless Infrastructure Market (2026-2032)
- Romania Airport Wireless Infrastructure Market (2026-2032)
- Qatar Airport Wireless Infrastructure Market (2026-2032)
- Philippines Airport Wireless Infrastructure Market (2026-2032)
- Japan Airport Wireless Infrastructure Market (2026-2032)
- Taiwan Airport Winter Services Market (2026-2032)
- Vietnam Airport Winter Services Market (2026-2032)
Industry Events and Analyst Meet

HIMTEX 2026

India Refining Summit 2026

India EV Show 2026

EV tech India Expo 2026

Auto Tech Asia 2026
Whitepaper
- Middle East & Africa Commercial Security Market Click here to view more.
- Middle East & Africa Fire Safety Systems & Equipment Market Click here to view more.
- GCC Drone Market Click here to view more.
- Middle East Lighting Fixture Market Click here to view more.
- GCC Physical & Perimeter Security Market Click here to view more.