Lithuania Personalized Nutrition Supplements Market (2026-2032) | Consumer Insights, Demand, Competitive, Size, Segments, Challenges, Companies, Segmentation, Trends, Value, Supply, Outlook, Analysis, Drivers, Forecast, Restraints, Revenue, Growth, Investment Trends, Industry, Competition, Strategic Insights, Pricing Analysis, Opportunities, Share, Strategy
Market Forecast By Product Type (Vitamin Supplements, Herbal Supplements, Protein Supplements, Probiotics, Omega-3 Supplements), By Form (Capsules, Powders, Gummies, Liquids, Tablets), By Target Consumer (Athletes, Pregnant Women, Seniors, Children, General Consumers), By Customization Factor (DNA-Based, Lifestyle-Based, Health Goals, AI-Personalized, Blood Test-Based), By Distribution Channel (Online Retail, Pharmacies, Health Stores, Direct Sales, Subscription Model) And Competitive Landscape
| Product Code: ETC10780986 | Publication Date: Apr 2025 | Updated Date: Apr 2026 | Product Type: Market Research Report | |
| Publisher: 6Wresearch | No. of Pages: 65 | No. of Figures: 34 | No. of Tables: 19 | |
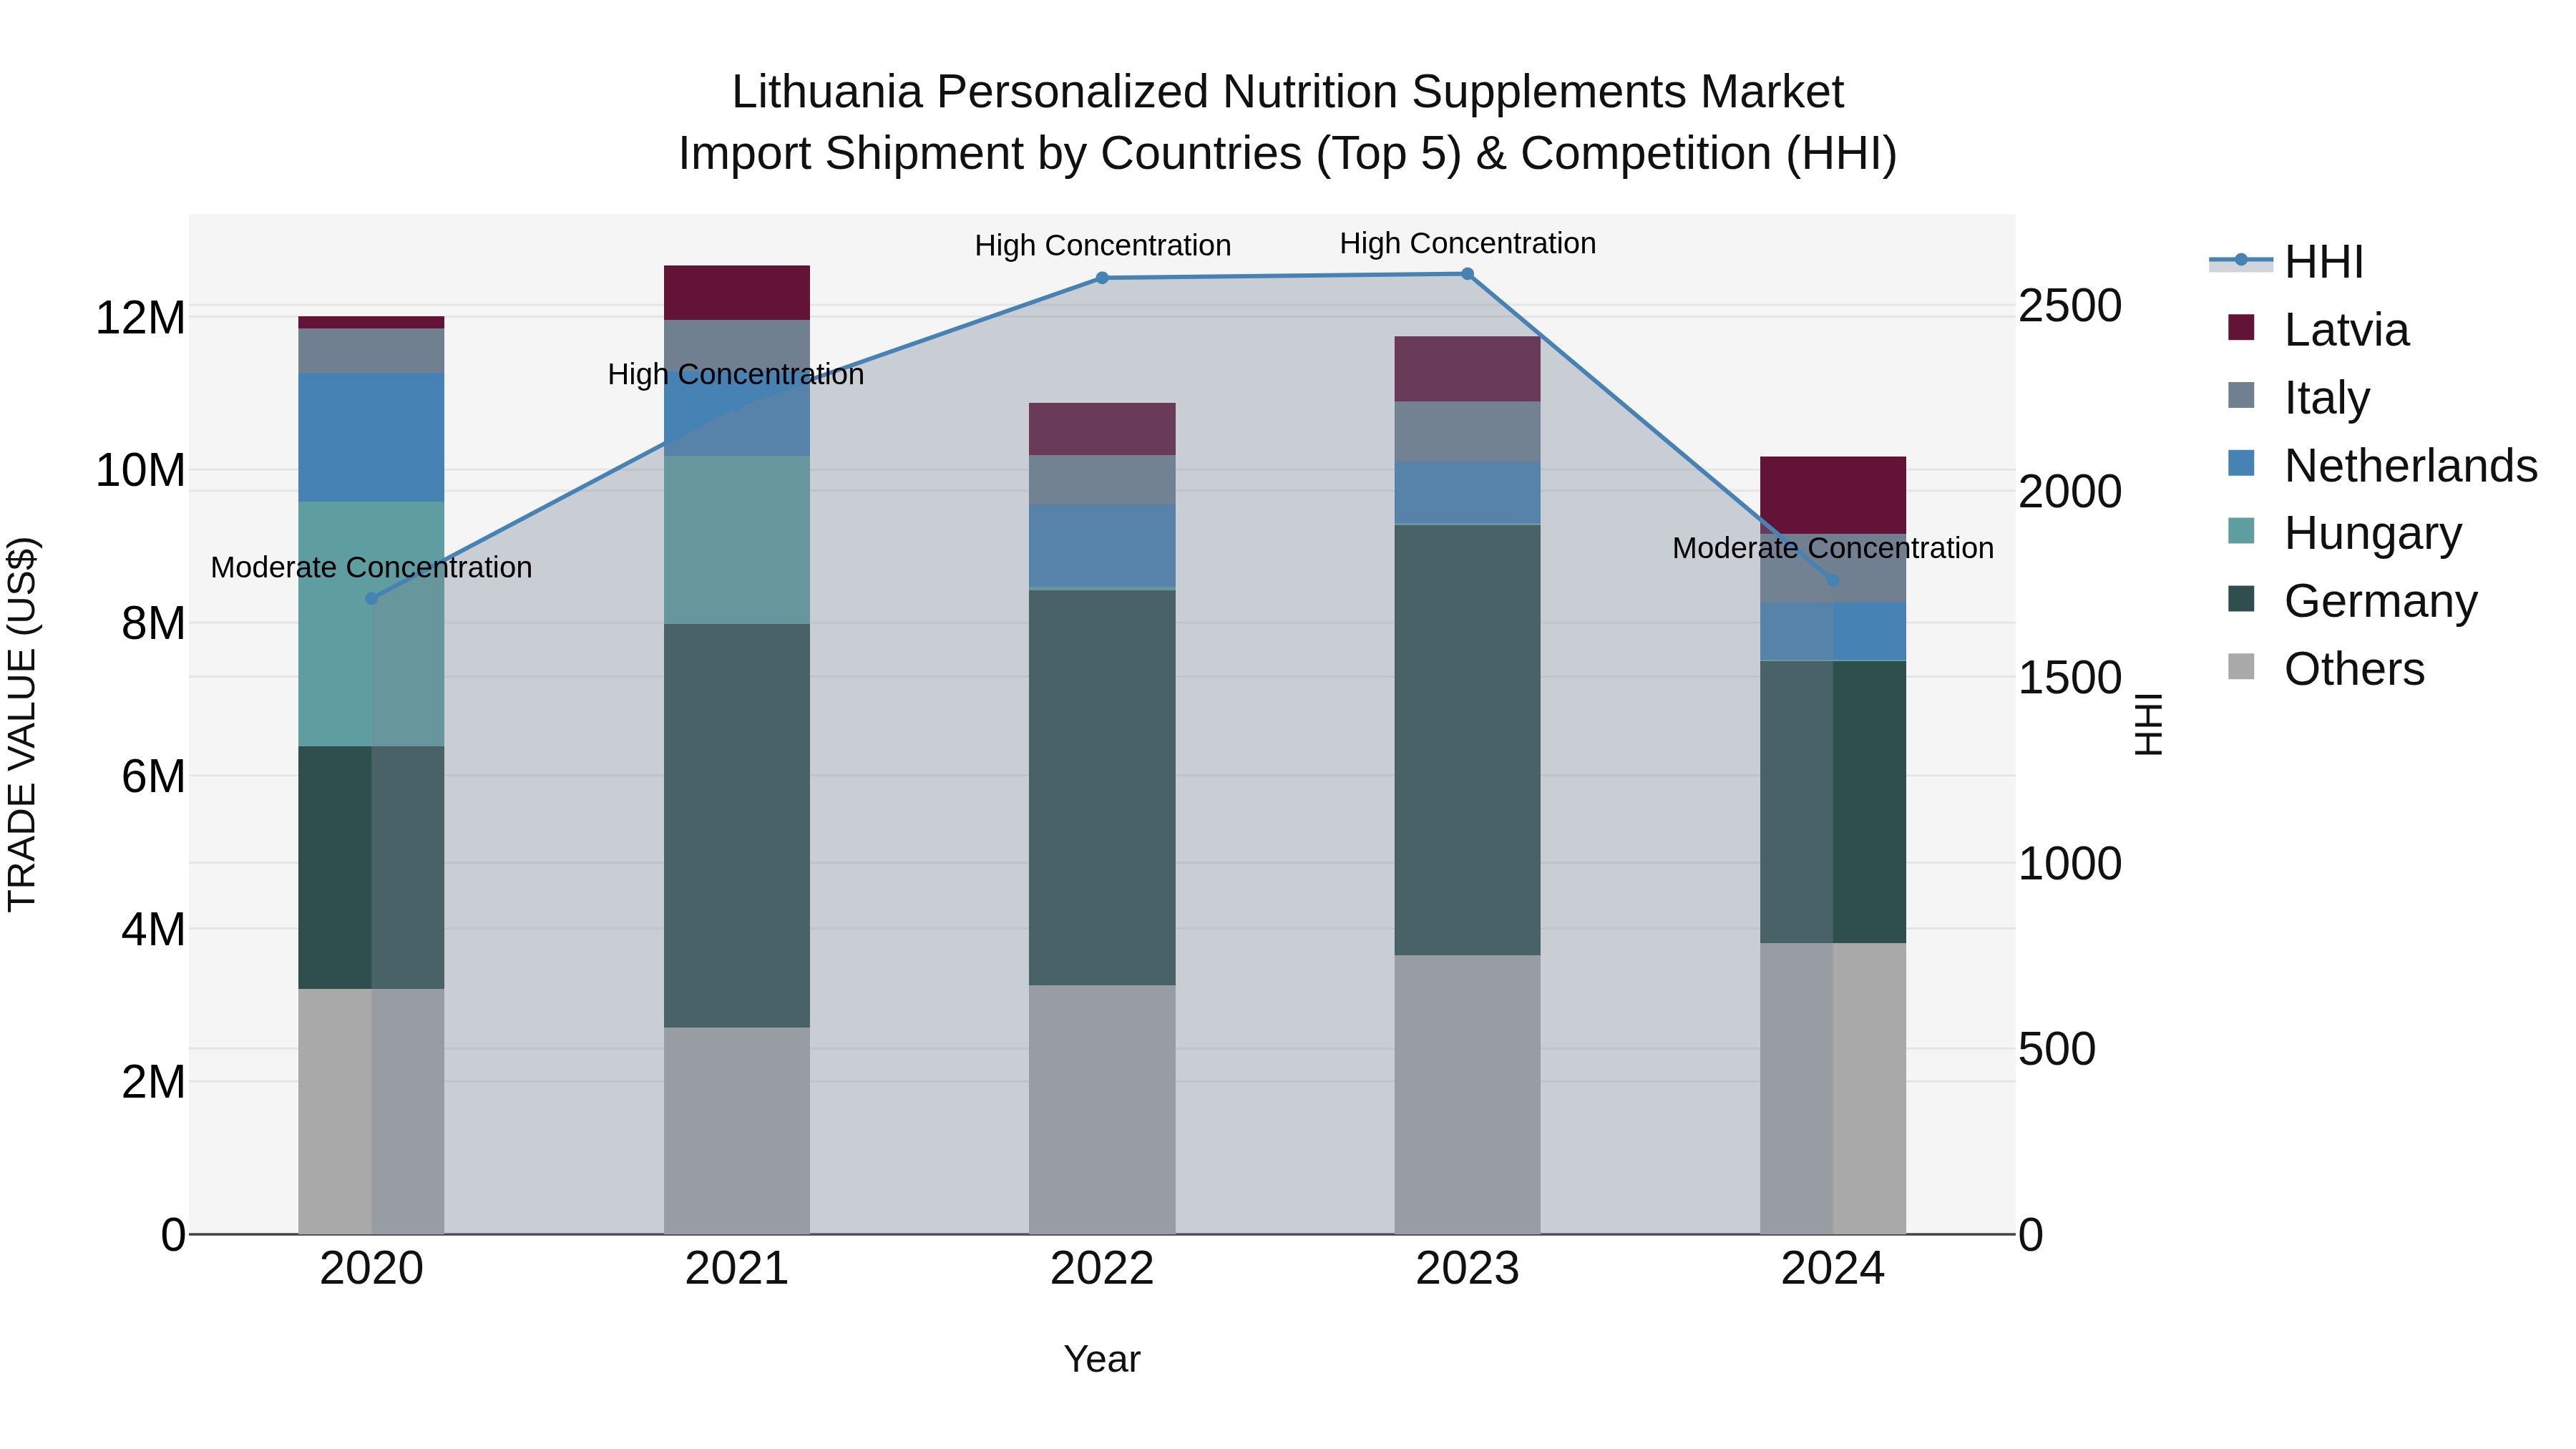
Lithuania Personalized Nutrition Supplements Market Top 5 Importing Countries and Market Competition (HHI) Analysis
The import shipments of personalized nutrition supplements to Lithuania in 2024 saw a shift in concentration levels, transitioning from high to moderate concentration. Despite a negative compound annual growth rate (CAGR) of -4.06% from 2020 to 2024, there was a steeper decline in the growth rate from 2023 to 2024 at -13.37%. Top exporting countries to Lithuania in 2024 include Germany, Latvia, Italy, Belgium, and Poland, indicating a diverse source of imports within the region. This data suggests a challenging market landscape but also opportunities for potential market expansion and diversification in the personalized nutrition supplements sector.
Key Highlights of the Report:
- Lithuania Personalized Nutrition Supplements Market Outlook
- Market Size of Lithuania Personalized Nutrition Supplements Market, 2025
- Forecast of Lithuania Personalized Nutrition Supplements Market, 2032
- Historical Data and Forecast of Lithuania Personalized Nutrition Supplements Revenues & Volume for the Period 2022 - 2032F
- Lithuania Personalized Nutrition Supplements Market Trend Evolution
- Lithuania Personalized Nutrition Supplements Market Drivers and Challenges
- Lithuania Personalized Nutrition Supplements Price Trends
- Lithuania Personalized Nutrition Supplements Porter's Five Forces
- Lithuania Personalized Nutrition Supplements Industry Life Cycle
- Historical Data and Forecast of Lithuania Personalized Nutrition Supplements Market Revenues & Volume By Product Type for the Period 2022 - 2032F
- Historical Data and Forecast of Lithuania Personalized Nutrition Supplements Market Revenues & Volume By Vitamin Supplements for the Period 2022 - 2032F
- Historical Data and Forecast of Lithuania Personalized Nutrition Supplements Market Revenues & Volume By Herbal Supplements for the Period 2022 - 2032F
- Historical Data and Forecast of Lithuania Personalized Nutrition Supplements Market Revenues & Volume By Protein Supplements for the Period 2022 - 2032F
- Historical Data and Forecast of Lithuania Personalized Nutrition Supplements Market Revenues & Volume By Probiotics for the Period 2022 - 2032F
- Historical Data and Forecast of Lithuania Personalized Nutrition Supplements Market Revenues & Volume By Omega-3 Supplements for the Period 2022 - 2032F
- Historical Data and Forecast of Lithuania Personalized Nutrition Supplements Market Revenues & Volume By Form for the Period 2022 - 2032F
- Historical Data and Forecast of Lithuania Personalized Nutrition Supplements Market Revenues & Volume By Capsules for the Period 2022 - 2032F
- Historical Data and Forecast of Lithuania Personalized Nutrition Supplements Market Revenues & Volume By Powders for the Period 2022 - 2032F
- Historical Data and Forecast of Lithuania Personalized Nutrition Supplements Market Revenues & Volume By Gummies for the Period 2022 - 2032F
- Historical Data and Forecast of Lithuania Personalized Nutrition Supplements Market Revenues & Volume By Liquids for the Period 2022 - 2032F
- Historical Data and Forecast of Lithuania Personalized Nutrition Supplements Market Revenues & Volume By Tablets for the Period 2022 - 2032F
- Historical Data and Forecast of Lithuania Personalized Nutrition Supplements Market Revenues & Volume By Target Consumer for the Period 2022 - 2032F
- Historical Data and Forecast of Lithuania Personalized Nutrition Supplements Market Revenues & Volume By Athletes for the Period 2022 - 2032F
- Historical Data and Forecast of Lithuania Personalized Nutrition Supplements Market Revenues & Volume By Pregnant Women for the Period 2022 - 2032F
- Historical Data and Forecast of Lithuania Personalized Nutrition Supplements Market Revenues & Volume By Seniors for the Period 2022 - 2032F
- Historical Data and Forecast of Lithuania Personalized Nutrition Supplements Market Revenues & Volume By Children for the Period 2022 - 2032F
- Historical Data and Forecast of Lithuania Personalized Nutrition Supplements Market Revenues & Volume By General Consumers for the Period 2022 - 2032F
- Historical Data and Forecast of Lithuania Personalized Nutrition Supplements Market Revenues & Volume By Customization Factor for the Period 2022 - 2032F
- Historical Data and Forecast of Lithuania Personalized Nutrition Supplements Market Revenues & Volume By DNA-Based for the Period 2022 - 2032F
- Historical Data and Forecast of Lithuania Personalized Nutrition Supplements Market Revenues & Volume By Lifestyle-Based for the Period 2022 - 2032F
- Historical Data and Forecast of Lithuania Personalized Nutrition Supplements Market Revenues & Volume By Health Goals for the Period 2022 - 2032F
- Historical Data and Forecast of Lithuania Personalized Nutrition Supplements Market Revenues & Volume By AI-Personalized for the Period 2022 - 2032F
- Historical Data and Forecast of Lithuania Personalized Nutrition Supplements Market Revenues & Volume By Blood Test-Based for the Period 2022 - 2032F
- Historical Data and Forecast of Lithuania Personalized Nutrition Supplements Market Revenues & Volume By Distribution Channel for the Period 2022 - 2032F
- Historical Data and Forecast of Lithuania Personalized Nutrition Supplements Market Revenues & Volume By Online Retail for the Period 2022 - 2032F
- Historical Data and Forecast of Lithuania Personalized Nutrition Supplements Market Revenues & Volume By Pharmacies for the Period 2022 - 2032F
- Historical Data and Forecast of Lithuania Personalized Nutrition Supplements Market Revenues & Volume By Health Stores for the Period 2022 - 2032F
- Historical Data and Forecast of Lithuania Personalized Nutrition Supplements Market Revenues & Volume By Direct Sales for the Period 2022 - 2032F
- Historical Data and Forecast of Lithuania Personalized Nutrition Supplements Market Revenues & Volume By Subscription Model for the Period 2022 - 2032F
- Lithuania Personalized Nutrition Supplements Import Export Trade Statistics
- Market Opportunity Assessment By Product Type
- Market Opportunity Assessment By Form
- Market Opportunity Assessment By Target Consumer
- Market Opportunity Assessment By Customization Factor
- Market Opportunity Assessment By Distribution Channel
- Lithuania Personalized Nutrition Supplements Top Companies Market Share
- Lithuania Personalized Nutrition Supplements Competitive Benchmarking By Technical and Operational Parameters
- Lithuania Personalized Nutrition Supplements Company Profiles
- Lithuania Personalized Nutrition Supplements Key Strategic Recommendations
Frequently Asked Questions About the Market Study (FAQs):
6Wresearch actively monitors the Lithuania Personalized Nutrition Supplements Market and publishes its comprehensive annual report, highlighting emerging trends, growth drivers, revenue analysis, and forecast outlook. Our insights help businesses to make data-backed strategic decisions with ongoing market dynamics. Our analysts track relevent industries related to the Lithuania Personalized Nutrition Supplements Market, allowing our clients with actionable intelligence and reliable forecasts tailored to emerging regional needs.
Yes, we provide customisation as per your requirements. To learn more, feel free to contact us on sales@6wresearch.com
1 Executive Summary |
2 Introduction |
2.1 Key Highlights of the Report |
2.2 Report Description |
2.3 Market Scope & Segmentation |
2.4 Research Methodology |
2.5 Assumptions |
3 Lithuania Personalized Nutrition Supplements Market Overview |
3.1 Lithuania Country Macro Economic Indicators |
3.2 Lithuania Personalized Nutrition Supplements Market Revenues & Volume, 2022 & 2032F |
3.3 Lithuania Personalized Nutrition Supplements Market - Industry Life Cycle |
3.4 Lithuania Personalized Nutrition Supplements Market - Porter's Five Forces |
3.5 Lithuania Personalized Nutrition Supplements Market Revenues & Volume Share, By Product Type, 2022 & 2032F |
3.6 Lithuania Personalized Nutrition Supplements Market Revenues & Volume Share, By Form, 2022 & 2032F |
3.7 Lithuania Personalized Nutrition Supplements Market Revenues & Volume Share, By Target Consumer, 2022 & 2032F |
3.8 Lithuania Personalized Nutrition Supplements Market Revenues & Volume Share, By Customization Factor, 2022 & 2032F |
3.9 Lithuania Personalized Nutrition Supplements Market Revenues & Volume Share, By Distribution Channel, 2022 & 2032F |
4 Lithuania Personalized Nutrition Supplements Market Dynamics |
4.1 Impact Analysis |
4.2 Market Drivers |
4.2.1 Increasing awareness about the importance of personalized nutrition for health and wellness |
4.2.2 Growing focus on preventive healthcare and individualized treatment plans |
4.2.3 Technological advancements in data analytics and genetic testing for personalized nutrition recommendations |
4.3 Market Restraints |
4.3.1 Lack of clear regulations and guidelines in the personalized nutrition supplements market |
4.3.2 Limited understanding and skepticism among consumers regarding the efficacy of personalized nutrition supplements |
4.3.3 High costs associated with personalized nutrition services and supplements |
5 Lithuania Personalized Nutrition Supplements Market Trends |
6 Lithuania Personalized Nutrition Supplements Market, By Types |
6.1 Lithuania Personalized Nutrition Supplements Market, By Product Type |
6.1.1 Overview and Analysis |
6.1.2 Lithuania Personalized Nutrition Supplements Market Revenues & Volume, By Product Type, 2022 - 2032F |
6.1.3 Lithuania Personalized Nutrition Supplements Market Revenues & Volume, By Vitamin Supplements, 2022 - 2032F |
6.1.4 Lithuania Personalized Nutrition Supplements Market Revenues & Volume, By Herbal Supplements, 2022 - 2032F |
6.1.5 Lithuania Personalized Nutrition Supplements Market Revenues & Volume, By Protein Supplements, 2022 - 2032F |
6.1.6 Lithuania Personalized Nutrition Supplements Market Revenues & Volume, By Probiotics, 2022 - 2032F |
6.1.7 Lithuania Personalized Nutrition Supplements Market Revenues & Volume, By Omega-3 Supplements, 2022 - 2032F |
6.2 Lithuania Personalized Nutrition Supplements Market, By Form |
6.2.1 Overview and Analysis |
6.2.2 Lithuania Personalized Nutrition Supplements Market Revenues & Volume, By Capsules, 2022 - 2032F |
6.2.3 Lithuania Personalized Nutrition Supplements Market Revenues & Volume, By Powders, 2022 - 2032F |
6.2.4 Lithuania Personalized Nutrition Supplements Market Revenues & Volume, By Gummies, 2022 - 2032F |
6.2.5 Lithuania Personalized Nutrition Supplements Market Revenues & Volume, By Liquids, 2022 - 2032F |
6.2.6 Lithuania Personalized Nutrition Supplements Market Revenues & Volume, By Tablets, 2022 - 2032F |
6.3 Lithuania Personalized Nutrition Supplements Market, By Target Consumer |
6.3.1 Overview and Analysis |
6.3.2 Lithuania Personalized Nutrition Supplements Market Revenues & Volume, By Athletes, 2022 - 2032F |
6.3.3 Lithuania Personalized Nutrition Supplements Market Revenues & Volume, By Pregnant Women, 2022 - 2032F |
6.3.4 Lithuania Personalized Nutrition Supplements Market Revenues & Volume, By Seniors, 2022 - 2032F |
6.3.5 Lithuania Personalized Nutrition Supplements Market Revenues & Volume, By Children, 2022 - 2032F |
6.3.6 Lithuania Personalized Nutrition Supplements Market Revenues & Volume, By General Consumers, 2022 - 2032F |
6.4 Lithuania Personalized Nutrition Supplements Market, By Customization Factor |
6.4.1 Overview and Analysis |
6.4.2 Lithuania Personalized Nutrition Supplements Market Revenues & Volume, By DNA-Based, 2022 - 2032F |
6.4.3 Lithuania Personalized Nutrition Supplements Market Revenues & Volume, By Lifestyle-Based, 2022 - 2032F |
6.4.4 Lithuania Personalized Nutrition Supplements Market Revenues & Volume, By Health Goals, 2022 - 2032F |
6.4.5 Lithuania Personalized Nutrition Supplements Market Revenues & Volume, By AI-Personalized, 2022 - 2032F |
6.4.6 Lithuania Personalized Nutrition Supplements Market Revenues & Volume, By Blood Test-Based, 2022 - 2032F |
6.5 Lithuania Personalized Nutrition Supplements Market, By Distribution Channel |
6.5.1 Overview and Analysis |
6.5.2 Lithuania Personalized Nutrition Supplements Market Revenues & Volume, By Online Retail, 2022 - 2032F |
6.5.3 Lithuania Personalized Nutrition Supplements Market Revenues & Volume, By Pharmacies, 2022 - 2032F |
6.5.4 Lithuania Personalized Nutrition Supplements Market Revenues & Volume, By Health Stores, 2022 - 2032F |
6.5.5 Lithuania Personalized Nutrition Supplements Market Revenues & Volume, By Direct Sales, 2022 - 2032F |
6.5.6 Lithuania Personalized Nutrition Supplements Market Revenues & Volume, By Subscription Model, 2022 - 2032F |
7 Lithuania Personalized Nutrition Supplements Market Import-Export Trade Statistics |
7.1 Lithuania Personalized Nutrition Supplements Market Export to Major Countries |
7.2 Lithuania Personalized Nutrition Supplements Market Imports from Major Countries |
8 Lithuania Personalized Nutrition Supplements Market Key Performance Indicators |
8.1 Percentage increase in the number of personalized nutrition consultations or assessments conducted annually |
8.2 Adoption rate of personalized nutrition recommendations by healthcare professionals and consumers |
8.3 Number of research studies or clinical trials on the effectiveness of personalized nutrition supplements |
8.4 Customer satisfaction and retention rates for personalized nutrition services |
8.5 Growth in partnerships between personalized nutrition companies and healthcare providers or wellness centers |
9 Lithuania Personalized Nutrition Supplements Market - Opportunity Assessment |
9.1 Lithuania Personalized Nutrition Supplements Market Opportunity Assessment, By Product Type, 2022 & 2032F |
9.2 Lithuania Personalized Nutrition Supplements Market Opportunity Assessment, By Form, 2022 & 2032F |
9.3 Lithuania Personalized Nutrition Supplements Market Opportunity Assessment, By Target Consumer, 2022 & 2032F |
9.4 Lithuania Personalized Nutrition Supplements Market Opportunity Assessment, By Customization Factor, 2022 & 2032F |
9.5 Lithuania Personalized Nutrition Supplements Market Opportunity Assessment, By Distribution Channel, 2022 & 2032F |
10 Lithuania Personalized Nutrition Supplements Market - Competitive Landscape |
10.1 Lithuania Personalized Nutrition Supplements Market Revenue Share, By Companies, 2025 |
10.2 Lithuania Personalized Nutrition Supplements Market Competitive Benchmarking, By Operating and Technical Parameters |
11 Company Profiles |
12 Recommendations |
13 Disclaimer |
Export potential assessment - trade Analytics for 2030
Export potential enables firms to identify high-growth global markets with greater confidence by combining advanced trade intelligence with a structured quantitative methodology. The framework analyzes emerging demand trends and country-level import patterns while integrating macroeconomic and trade datasets such as GDP and population forecasts, bilateral import–export flows, tariff structures, elasticity differentials between developed and developing economies, geographic distance, and import demand projections. Using weighted trade values from 2020–2024 as the base period to project country-to-country export potential for 2030, these inputs are operationalized through calculated drivers such as gravity model parameters, tariff impact factors, and projected GDP per-capita growth. Through an analysis of hidden potentials, demand hotspots, and market conditions that are most favorable to success, this method enables firms to focus on target countries, maximize returns, and global expansion with data, backed by accuracy.
By factoring in the projected importer demand gap that is currently unmet and could be potential opportunity, it identifies the potential for the Exporter (Country) among 190 countries, against the general trade analysis, which identifies the biggest importer or exporter.
To discover high-growth global markets and optimize your business strategy:
Click Here
Pricing
- Single User License$ 1,995
- Department License$ 2,400
- Site License$ 3,120
- Global License$ 3,795

Search
Thought Leadership and Analyst Meet


Our Clients
Latest Reports
- Taiwan Food Delivery Platform Market (2026-2032) | Companies, Outlook, Analysis, Trends, Value, Revenue, Segmentation, Share, Forecast, Competitive Landscape, Growth, Size & Forecast
- United Kingdom (UK) Long-term Care Insurance Market (2026-2032) | Growth, Share, Consumer Insights, Drivers, Opportunities, Competition, Pricing Analysis, Segments, Restraints, Companies, Competitive, Value, Outlook, Size, Demand, Analysis, Challenges, Strategic Insights, Investment Trends, Revenue, Trends, Supply, Forecast
- United Kingdom (UK) Long Term Care Market (2026-2032) | Companies, Outlook, Analysis, Trends, Value, Revenue, Segmentation, Share, Forecast, Competitive Landscape, Growth, Size & Forecast
- Iraq Insulation and Waterproofing Market (2026-2032) | Outlook, Drivers, Growth, Size, Share, Industry, Revenue, Trends, Demand, Competitive, Strategic Insights, Opportunities, Segments, Companies, Challenges, Strategy, Consumer Insights, Analysis, Investment Trends, Value, Segmentation, Forecast, Restraints
- India Switchgear Market Outlook (2026-2032) | Size, Share, Trends, Growth, Revenue, Forecast, Analysis, Value, Outlook
- Pakistan Contraceptive Implants Market (2025-2031) | Demand, Growth, Size, Share, Industry, Pricing Analysis, Competitive, Strategic Insights, Strategy, Consumer Insights, Analysis, Investment Trends, Opportunities, Revenue, Segments, Value, Segmentation, Supply, Forecast, Restraints, Outlook, Competition, Drivers, Trends, Companies, Challenges
- Sri Lanka Packaging Market (2026-2032) | Outlook, Competition, Drivers, Trends, Demand, Pricing Analysis, Competitive, Strategic Insights, Companies, Challenges, Strategy, Consumer Insights, Analysis, Investment Trends, Opportunities, Growth, Size, Share, Industry, Revenue, Segments, Value, Segmentation, Supply, Forecast, Restraints
- India Kids Watches Market (2026-2032) | Strategy, Consumer Insights, Analysis, Investment Trends, Opportunities, Growth, Size, Share, Industry, Revenue, Segments, Value, Segmentation, Supply, Forecast, Restraints, Outlook, Competition, Drivers, Trends, Demand, Pricing Analysis, Competitive, Strategic Insights, Companies, Challenges
- Saudi Arabia Core Assurance Service Market (2025-2031) | Strategy, Consumer Insights, Analysis, Investment Trends, Opportunities, Growth, Size, Share, Industry, Revenue, Segments, Value, Segmentation, Supply, Forecast, Restraints, Outlook, Competition, Drivers, Trends, Demand, Pricing Analysis, Competitive, Strategic Insights, Companies, Challenges
- Romania Uninterruptible Power Supply (UPS) Market (2026-2032) | Industry, Analysis, Revenue, Size, Forecast, Outlook, Value, Trends, Share, Growth & Companies
Industry Events and Analyst Meet

India EV Show 2026

EV tech India Expo 2026

Auto Tech Asia 2026

Battery Tech India 2026

Smart Production Solutions Guangzhou 2026
Whitepaper
- Middle East & Africa Commercial Security Market Click here to view more.
- Middle East & Africa Fire Safety Systems & Equipment Market Click here to view more.
- GCC Drone Market Click here to view more.
- Middle East Lighting Fixture Market Click here to view more.
- GCC Physical & Perimeter Security Market Click here to view more.
6WResearch In News
- Doha a strategic location for EV manufacturing hub: IPA Qatar
- Demand for luxury TVs surging in the GCC, says Samsung
- Empowering Growth: The Thriving Journey of Bangladesh’s Cable Industry
- Demand for luxury TVs surging in the GCC, says Samsung
- Video call with a traditional healer? Once unthinkable, it’s now common in South Africa
- Intelligent Buildings To Smooth GCC’s Path To Net Zero