Lithuania Petroleum Resins Market (2026-2032) | Size, Trends, Companies, Value, Analysis, Forecast, Share, Growth, Revenue, Segmentation, Outlook & Industry
Market Forecast By Type (C5, C9, Hydrogenated Hydrocarbon Resins , C5/C9 Resins), By Application (Adhesive & Sealants, Printing Inks, Paints & Coatings), By End Use Industry (Building & Construction, Tire) And Competitive Landscape
| Product Code: ETC5737926 | Publication Date: Nov 2023 | Updated Date: Apr 2026 | Product Type: Market Research Report | |
| Publisher: 6Wresearch | Author: Ravi Bhandari | No. of Pages: 60 | No. of Figures: 30 | No. of Tables: 5 |
Lithuania Petroleum Resins Market Size (2020-2030)
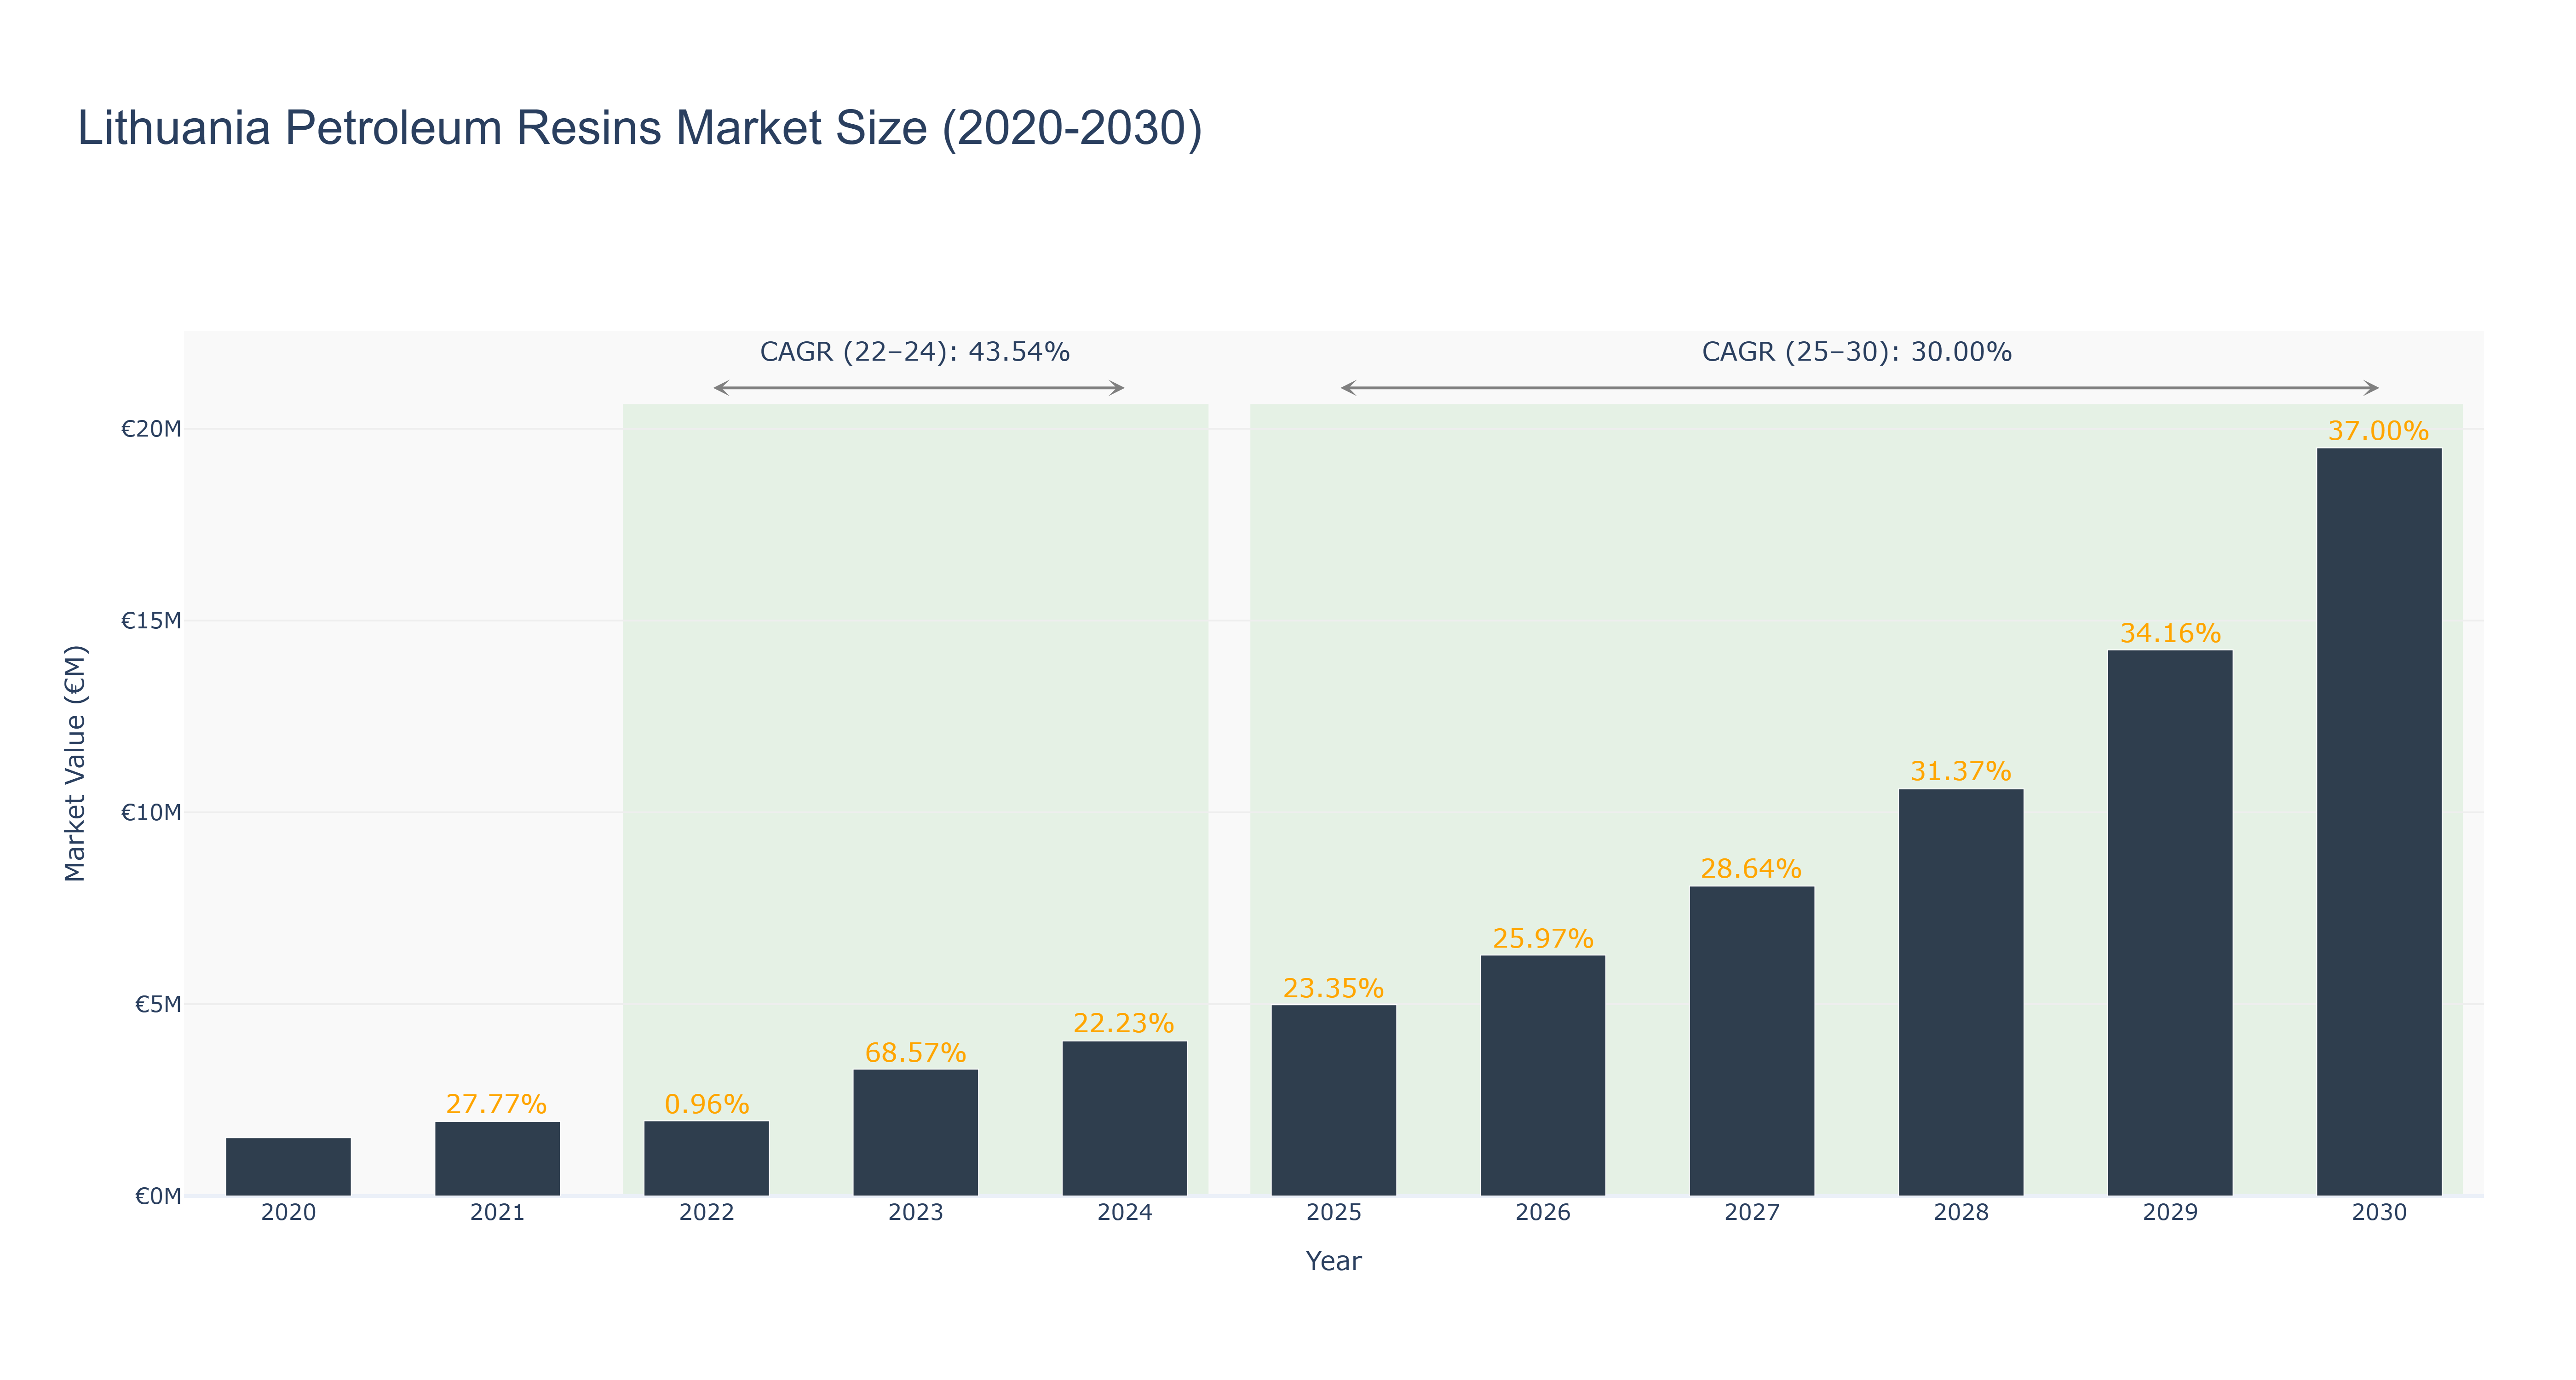
Lithuania Petroleum Resins Market has shown a remarkable growth trajectory over the years. The peak market size was €19.50 million in 2030, with a steady increase from €1.52 million in 2020. The actual market size witnessed significant growth from €1.52 million in 2020 to €4.04 million in 2024. The forecasted market size is expected to reach €19.50 million by 2030, indicating a strong growth potential. The CAGR for the period 2022-24 was 43.54%, while for 2025-30, it stands at 30.0%. Industry drivers such as increasing demand for petroleum resins in various applications have contributed to this growth. Looking ahead, upcoming projects in Lithuania's petrochemical industry are set to further boost the market, including the development of new refineries and expansion of existing facilities to meet the growing demand for petroleum resins.
Lithuania Petroleum Resins Market: Production & Trade Performance (2019-2025)
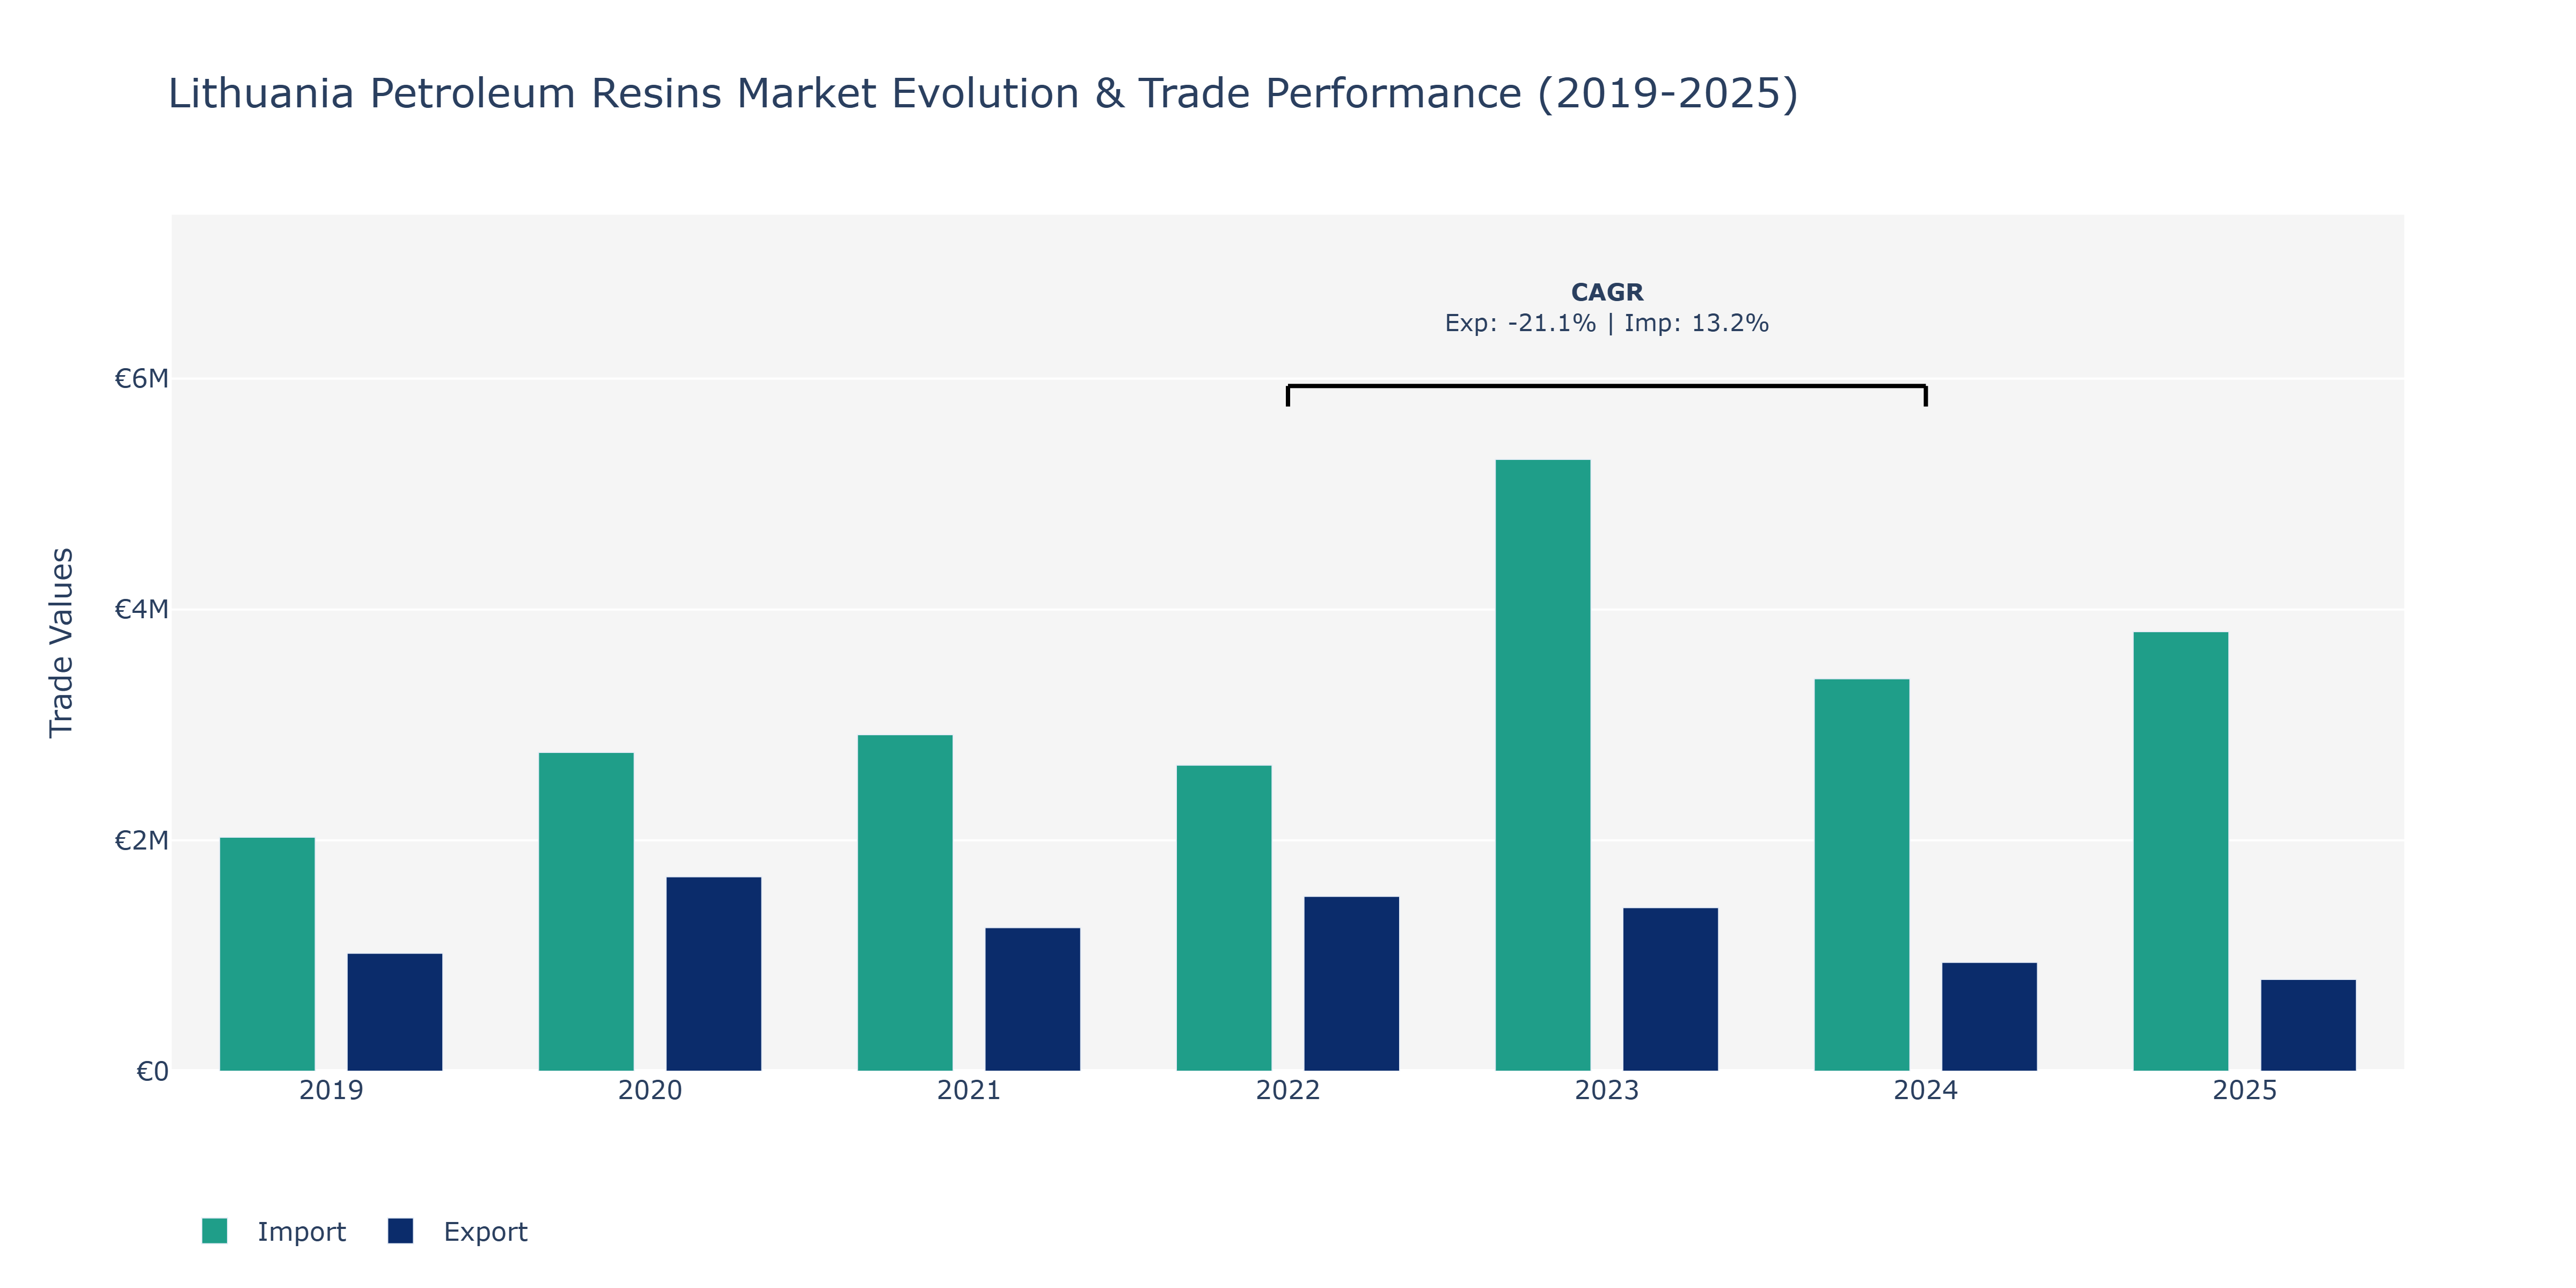
Between 2019 and 2025, Lithuania's Petroleum Resins Market witnessed notable shifts in both exports and imports. In 2020, exports surged to €1.68 million, marking a significant increase from the previous year's €1.02 million. This spike was followed by a dip in 2021 to €1.24 million before a gradual recovery in the following years. Conversely, imports consistently rose from €2.03 million in 2019 to €3.81 million in 2025, reflecting a steady upward trend. The peak import figure was observed in 2023. The fluctuations in exports can be attributed to global market demand variations, while the steady increase in imports may indicate Lithuania's growing reliance on external suppliers for petroleum resins. These trends align with the volatile nature of the petrochemical industry, influenced by factors such as geopolitical dynamics and evolving consumer preferences for resin-based products.
Key Highlights of the Report:
- Lithuania Petroleum Resins Market Outlook
- Market Size of Lithuania Petroleum Resins Market, 2025
- Forecast of Lithuania Petroleum Resins Market, 2032
- Historical Data and Forecast of Lithuania Petroleum Resins Revenues & Volume for the Period 2022 - 2032F
- Lithuania Petroleum Resins Market Trend Evolution
- Lithuania Petroleum Resins Market Drivers and Challenges
- Lithuania Petroleum Resins Price Trends
- Lithuania Petroleum Resins Porter`s Five Forces
- Lithuania Petroleum Resins Industry Life Cycle
- Historical Data and Forecast of Lithuania Petroleum Resins Market Revenues & Volume By Type for the Period 2022 - 2032F
- Historical Data and Forecast of Lithuania Petroleum Resins Market Revenues & Volume By C5 for the Period 2022 - 2032F
- Historical Data and Forecast of Lithuania Petroleum Resins Market Revenues & Volume By C9 for the Period 2022 - 2032F
- Historical Data and Forecast of Lithuania Petroleum Resins Market Revenues & Volume By Hydrogenated Hydrocarbon Resins for the Period 2022 - 2032F
- Historical Data and Forecast of Lithuania Petroleum Resins Market Revenues & Volume By C5/C9 Resins for the Period 2022 - 2032F
- Historical Data and Forecast of Lithuania Petroleum Resins Market Revenues & Volume By Application for the Period 2022 - 2032F
- Historical Data and Forecast of Lithuania Petroleum Resins Market Revenues & Volume By Adhesive & Sealants for the Period 2022 - 2032F
- Historical Data and Forecast of Lithuania Petroleum Resins Market Revenues & Volume By Printing Inks for the Period 2022 - 2032F
- Historical Data and Forecast of Lithuania Petroleum Resins Market Revenues & Volume By Paints & Coatings for the Period 2022 - 2032F
- Historical Data and Forecast of Lithuania Petroleum Resins Market Revenues & Volume By End Use Industry for the Period 2022 - 2032F
- Historical Data and Forecast of Lithuania Petroleum Resins Market Revenues & Volume By Building & Construction for the Period 2022 - 2032F
- Historical Data and Forecast of Lithuania Petroleum Resins Market Revenues & Volume By Tire for the Period 2022 - 2032F
- Lithuania Petroleum Resins Import Export Trade Statistics
- Market Opportunity Assessment By Type
- Market Opportunity Assessment By Application
- Market Opportunity Assessment By End Use Industry
- Lithuania Petroleum Resins Top Companies Market Share
- Lithuania Petroleum Resins Competitive Benchmarking By Technical and Operational Parameters
- Lithuania Petroleum Resins Company Profiles
- Lithuania Petroleum Resins Key Strategic Recommendations
Frequently Asked Questions About the Market Study (FAQs):
6Wresearch actively monitors the Lithuania Petroleum Resins Market and publishes its comprehensive annual report, highlighting emerging trends, growth drivers, revenue analysis, and forecast outlook. Our insights help businesses to make data-backed strategic decisions with ongoing market dynamics. Our analysts track relevent industries related to the Lithuania Petroleum Resins Market, allowing our clients with actionable intelligence and reliable forecasts tailored to emerging regional needs.
Yes, we provide customisation as per your requirements. To learn more, feel free to contact us on sales@6wresearch.com
1 Executive Summary |
2 Introduction |
2.1 Key Highlights of the Report |
2.2 Report Description |
2.3 Market Scope & Segmentation |
2.4 Research Methodology |
2.5 Assumptions |
3 Lithuania Petroleum Resins Market Overview |
3.1 Lithuania Country Macro Economic Indicators |
3.2 Lithuania Petroleum Resins Market Revenues & Volume, 2022 & 2032F |
3.3 Lithuania Petroleum Resins Market - Industry Life Cycle |
3.4 Lithuania Petroleum Resins Market - Porter's Five Forces |
3.5 Lithuania Petroleum Resins Market Revenues & Volume Share, By Type, 2022 & 2032F |
3.6 Lithuania Petroleum Resins Market Revenues & Volume Share, By Application, 2022 & 2032F |
3.7 Lithuania Petroleum Resins Market Revenues & Volume Share, By End Use Industry, 2022 & 2032F |
4 Lithuania Petroleum Resins Market Dynamics |
4.1 Impact Analysis |
4.2 Market Drivers |
4.2.1 Increasing demand for adhesives and sealants industries in Lithuania |
4.2.2 Growth in construction and automotive sectors driving the demand for petroleum resins |
4.2.3 Technological advancements leading to the development of new applications for petroleum resins |
4.3 Market Restraints |
4.3.1 Fluctuating prices of raw materials impacting the production costs |
4.3.2 Environmental concerns and regulations regarding the use of petroleum-based products |
4.3.3 Competition from substitute products like rosin resins and synthetic resins |
5 Lithuania Petroleum Resins Market Trends |
6 Lithuania Petroleum Resins Market Segmentations |
6.1 Lithuania Petroleum Resins Market, By Type |
6.1.1 Overview and Analysis |
6.1.2 Lithuania Petroleum Resins Market Revenues & Volume, By C5, 2022 - 2032F |
6.1.3 Lithuania Petroleum Resins Market Revenues & Volume, By C9, 2022 - 2032F |
6.1.4 Lithuania Petroleum Resins Market Revenues & Volume, By Hydrogenated Hydrocarbon Resins , 2022 - 2032F |
6.1.5 Lithuania Petroleum Resins Market Revenues & Volume, By C5/C9 Resins, 2022 - 2032F |
6.2 Lithuania Petroleum Resins Market, By Application |
6.2.1 Overview and Analysis |
6.2.2 Lithuania Petroleum Resins Market Revenues & Volume, By Adhesive & Sealants, 2022 - 2032F |
6.2.3 Lithuania Petroleum Resins Market Revenues & Volume, By Printing Inks, 2022 - 2032F |
6.2.4 Lithuania Petroleum Resins Market Revenues & Volume, By Paints & Coatings, 2022 - 2032F |
6.3 Lithuania Petroleum Resins Market, By End Use Industry |
6.3.1 Overview and Analysis |
6.3.2 Lithuania Petroleum Resins Market Revenues & Volume, By Building & Construction, 2022 - 2032F |
6.3.3 Lithuania Petroleum Resins Market Revenues & Volume, By Tire, 2022 - 2032F |
7 Lithuania Petroleum Resins Market Import-Export Trade Statistics |
7.1 Lithuania Petroleum Resins Market Export to Major Countries |
7.2 Lithuania Petroleum Resins Market Imports from Major Countries |
8 Lithuania Petroleum Resins Market Key Performance Indicators |
8.1 Research and development investment in new product development |
8.2 Adoption rate of petroleum resins in emerging applications |
8.3 Number of partnerships or collaborations for market expansion |
8.4 Efficiency of production processes in terms of waste reduction and energy consumption |
8.5 Market penetration in key industries such as adhesives, coatings, and rubber industries |
9 Lithuania Petroleum Resins Market - Opportunity Assessment |
9.1 Lithuania Petroleum Resins Market Opportunity Assessment, By Type, 2022 & 2032F |
9.2 Lithuania Petroleum Resins Market Opportunity Assessment, By Application, 2022 & 2032F |
9.3 Lithuania Petroleum Resins Market Opportunity Assessment, By End Use Industry, 2022 & 2032F |
10 Lithuania Petroleum Resins Market - Competitive Landscape |
10.1 Lithuania Petroleum Resins Market Revenue Share, By Companies, 2025 |
10.2 Lithuania Petroleum Resins Market Competitive Benchmarking, By Operating and Technical Parameters |
11 Company Profiles |
12 Recommendations | 13 Disclaimer |
Export potential assessment - trade Analytics for 2030
Export potential enables firms to identify high-growth global markets with greater confidence by combining advanced trade intelligence with a structured quantitative methodology. The framework analyzes emerging demand trends and country-level import patterns while integrating macroeconomic and trade datasets such as GDP and population forecasts, bilateral import–export flows, tariff structures, elasticity differentials between developed and developing economies, geographic distance, and import demand projections. Using weighted trade values from 2020–2024 as the base period to project country-to-country export potential for 2030, these inputs are operationalized through calculated drivers such as gravity model parameters, tariff impact factors, and projected GDP per-capita growth. Through an analysis of hidden potentials, demand hotspots, and market conditions that are most favorable to success, this method enables firms to focus on target countries, maximize returns, and global expansion with data, backed by accuracy.
By factoring in the projected importer demand gap that is currently unmet and could be potential opportunity, it identifies the potential for the Exporter (Country) among 190 countries, against the general trade analysis, which identifies the biggest importer or exporter.
To discover high-growth global markets and optimize your business strategy:
Click Here
Pricing
- Single User License$ 1,995
- Department License$ 2,400
- Site License$ 3,120
- Global License$ 3,795

Search
Thought Leadership and Analyst Meet


Our Clients
Latest Reports
- Canada Cloud CFD Market (2026-2032) | Size & Revenue, Industry, Growth, Competitive Landscape, Forecast, Segmentation, Value, Outlook, Trends, Share, Analysis, Companies
- Taiwan Food Delivery Platform Market (2026-2032) | Companies, Outlook, Analysis, Trends, Value, Revenue, Segmentation, Share, Forecast, Competitive Landscape, Growth, Size & Forecast
- United Kingdom (UK) Long-term Care Insurance Market (2026-2032) | Growth, Share, Consumer Insights, Drivers, Opportunities, Competition, Pricing Analysis, Segments, Restraints, Companies, Competitive, Value, Outlook, Size, Demand, Analysis, Challenges, Strategic Insights, Investment Trends, Revenue, Trends, Supply, Forecast
- United Kingdom (UK) Long Term Care Market (2026-2032) | Companies, Outlook, Analysis, Trends, Value, Revenue, Segmentation, Share, Forecast, Competitive Landscape, Growth, Size & Forecast
- Iraq Insulation and Waterproofing Market (2026-2032) | Outlook, Drivers, Growth, Size, Share, Industry, Revenue, Trends, Demand, Competitive, Strategic Insights, Opportunities, Segments, Companies, Challenges, Strategy, Consumer Insights, Analysis, Investment Trends, Value, Segmentation, Forecast, Restraints
- India Switchgear Market Outlook (2026-2032) | Size, Share, Trends, Growth, Revenue, Forecast, Analysis, Value, Outlook
- Pakistan Contraceptive Implants Market (2025-2031) | Demand, Growth, Size, Share, Industry, Pricing Analysis, Competitive, Strategic Insights, Strategy, Consumer Insights, Analysis, Investment Trends, Opportunities, Revenue, Segments, Value, Segmentation, Supply, Forecast, Restraints, Outlook, Competition, Drivers, Trends, Companies, Challenges
- Sri Lanka Packaging Market (2026-2032) | Outlook, Competition, Drivers, Trends, Demand, Pricing Analysis, Competitive, Strategic Insights, Companies, Challenges, Strategy, Consumer Insights, Analysis, Investment Trends, Opportunities, Growth, Size, Share, Industry, Revenue, Segments, Value, Segmentation, Supply, Forecast, Restraints
- India Kids Watches Market (2026-2032) | Strategy, Consumer Insights, Analysis, Investment Trends, Opportunities, Growth, Size, Share, Industry, Revenue, Segments, Value, Segmentation, Supply, Forecast, Restraints, Outlook, Competition, Drivers, Trends, Demand, Pricing Analysis, Competitive, Strategic Insights, Companies, Challenges
- Saudi Arabia Core Assurance Service Market (2025-2031) | Strategy, Consumer Insights, Analysis, Investment Trends, Opportunities, Growth, Size, Share, Industry, Revenue, Segments, Value, Segmentation, Supply, Forecast, Restraints, Outlook, Competition, Drivers, Trends, Demand, Pricing Analysis, Competitive, Strategic Insights, Companies, Challenges
Industry Events and Analyst Meet

India EV Show 2026

EV tech India Expo 2026

Auto Tech Asia 2026

Battery Tech India 2026

Smart Production Solutions Guangzhou 2026
Whitepaper
- Middle East & Africa Commercial Security Market Click here to view more.
- Middle East & Africa Fire Safety Systems & Equipment Market Click here to view more.
- GCC Drone Market Click here to view more.
- Middle East Lighting Fixture Market Click here to view more.
- GCC Physical & Perimeter Security Market Click here to view more.
6WResearch In News
- Doha a strategic location for EV manufacturing hub: IPA Qatar
- Demand for luxury TVs surging in the GCC, says Samsung
- Empowering Growth: The Thriving Journey of Bangladesh’s Cable Industry
- Demand for luxury TVs surging in the GCC, says Samsung
- Video call with a traditional healer? Once unthinkable, it’s now common in South Africa
- Intelligent Buildings To Smooth GCC’s Path To Net Zero