Lithuania Polymer Clay Market (2026-2032) | Size, Industry, Companies, Share, Trends, Segmentation, Analysis, Forecast, Value, Revenue, Growth & Outlook
Market Forecast By Product Form (Solid, Liquid), By Application (Jewelry Making, Manufacturing of Toys and Novelty Items, Arts and Sculpture Making, Crockery and Ceramic Products, Others), By End Use (Residential, Commercial, Industrial) And Competitive Landscape
| Product Code: ETC5307823 | Publication Date: Nov 2023 | Updated Date: Apr 2026 | Product Type: Market Research Report | |
| Publisher: 6Wresearch | Author: Ravi Bhandari | No. of Pages: 60 | No. of Figures: 30 | No. of Tables: 5 |
Lithuania Polymer Clay Market Size (2020-2030)
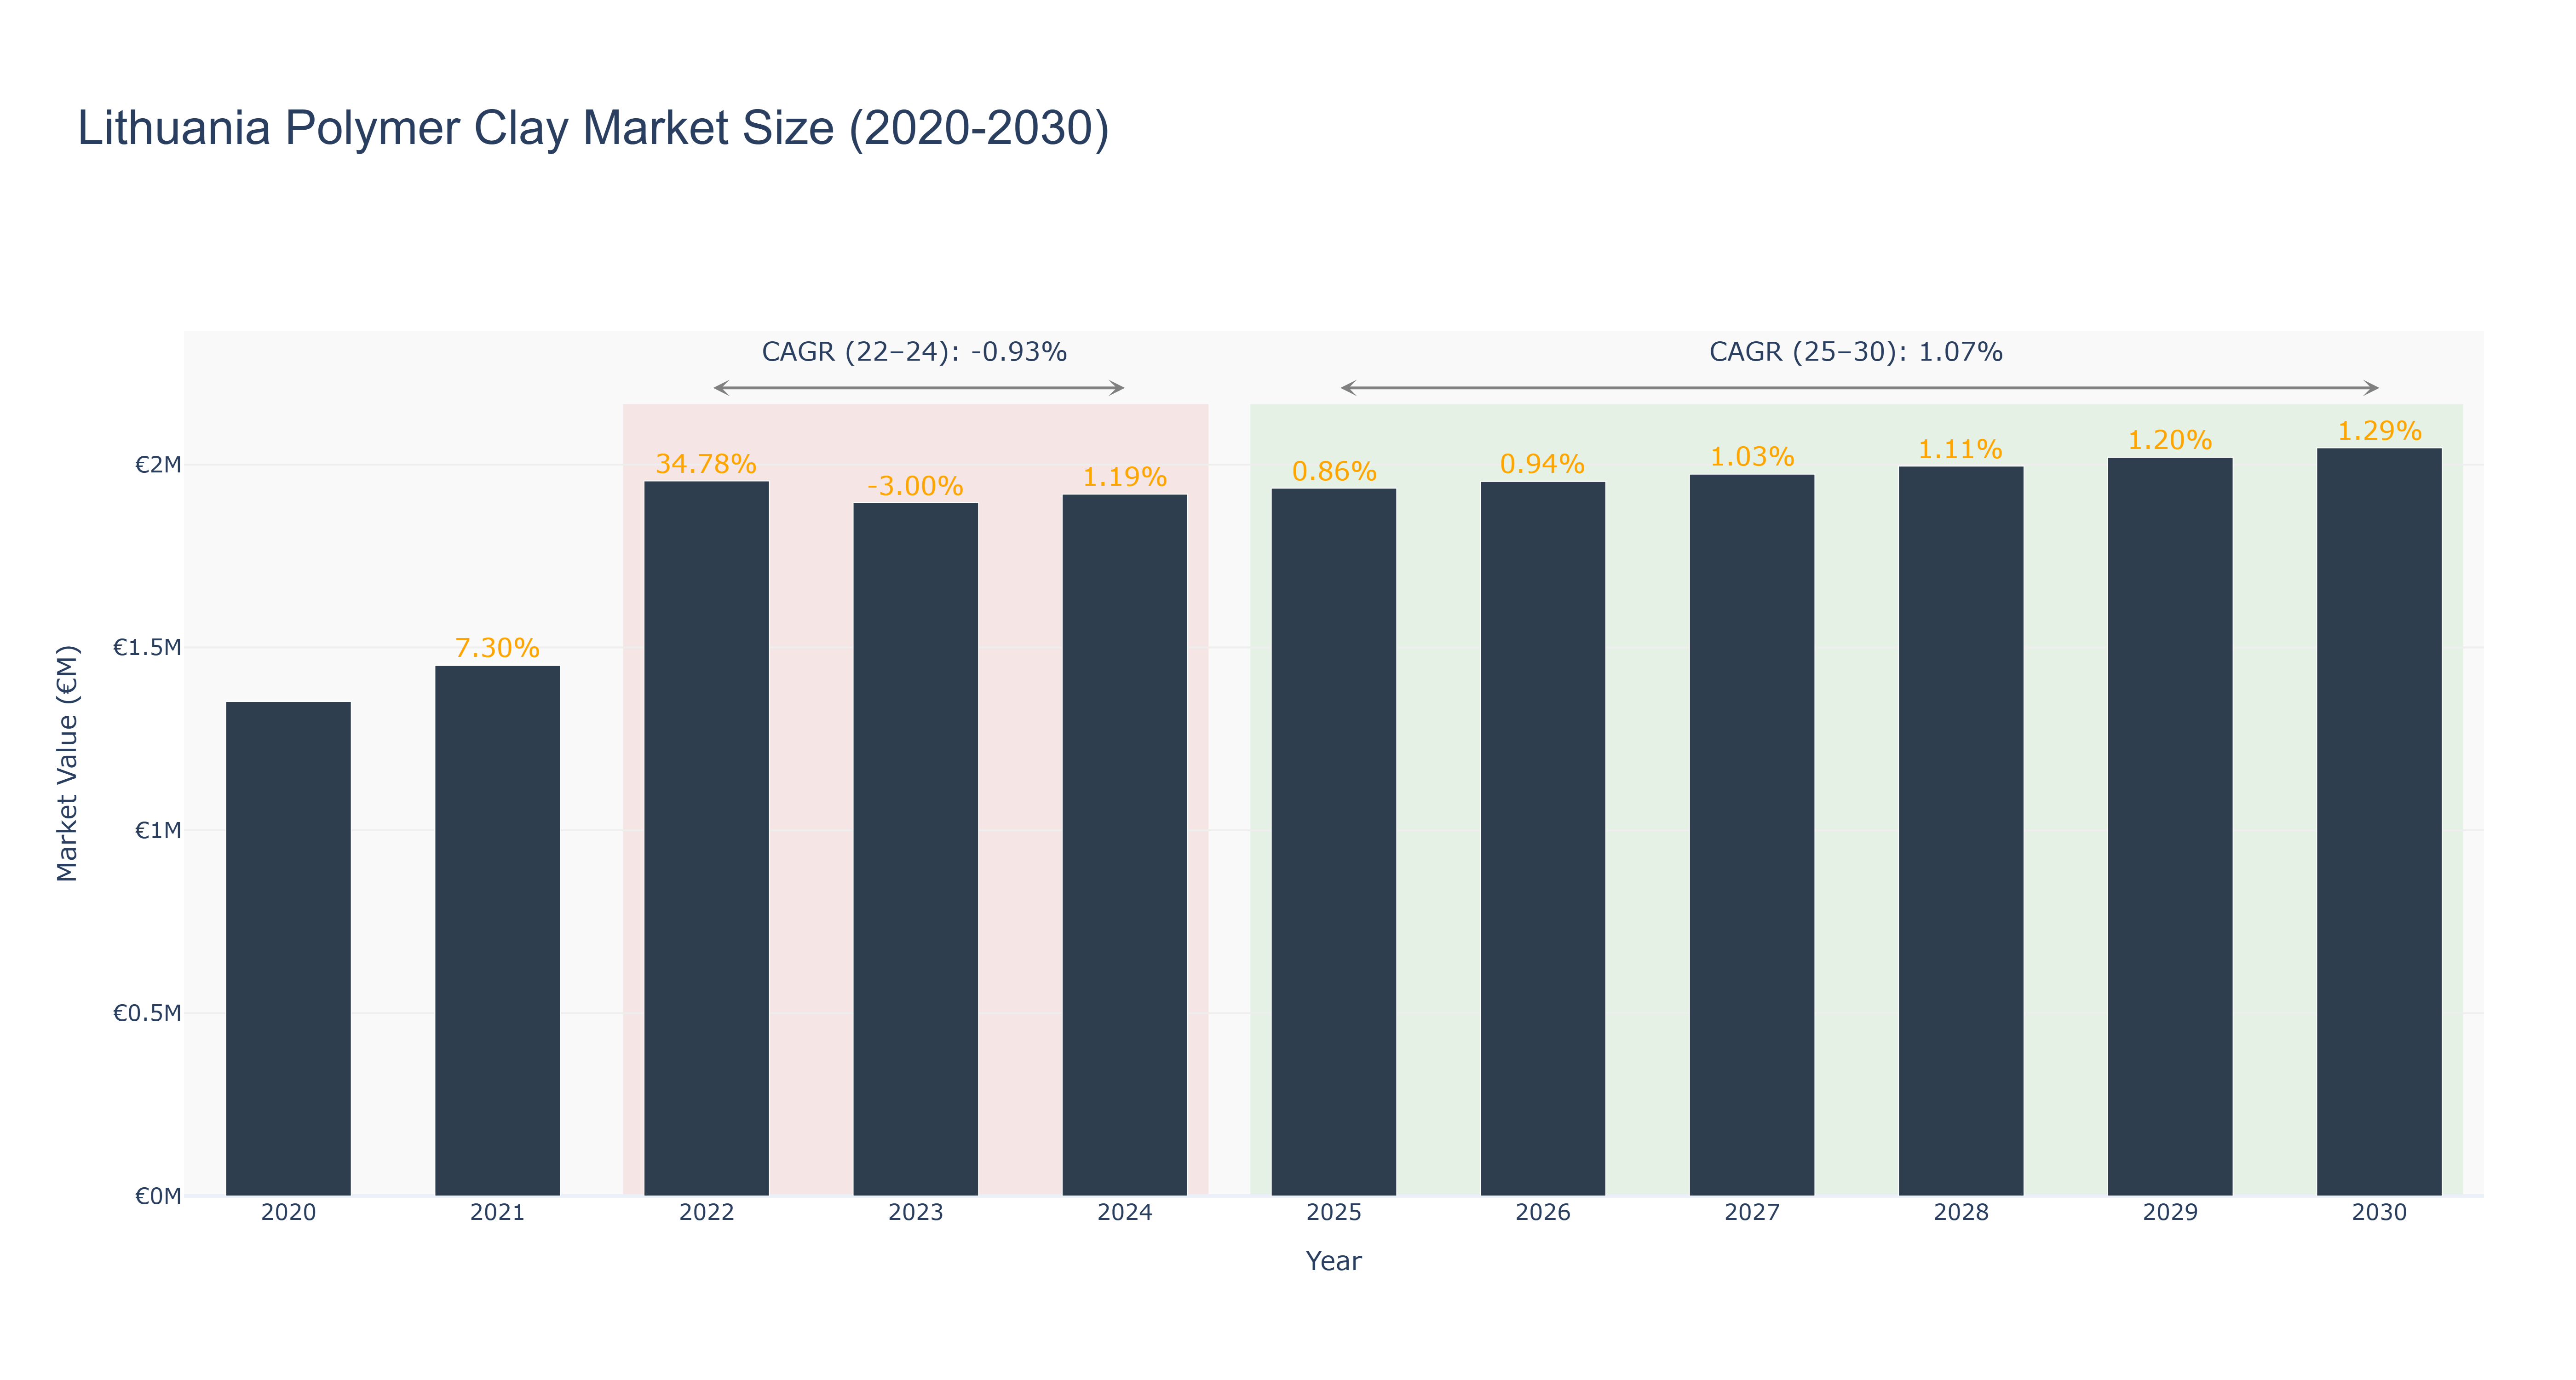
Lithuania Polymer Clay Market has shown a fluctuating trend over the years. The peak market size was €2.05 million in 2030, with a steady growth rate. From 2020 to 2024, the market size increased gradually from €1.35 million to €1.92 million, experiencing both positive and negative growth rates. The forecasted market size from 2025 to 2030 is expected to continue growing, with a CAGR of 1.07%. The market faced a slight decline in 2023 due to external economic factors impacting consumer demand, but recovered with consistent growth thereafter. Industry drivers such as increasing demand for eco-friendly materials and creative hobbies have contributed to the market's growth. Looking ahead, upcoming projects in sustainable product development and innovative marketing strategies are expected to further boost the Lithuania Polymer Clay Market.
Lithuania Polymer Clay Market: Production & Trade Performance (2019-2025)
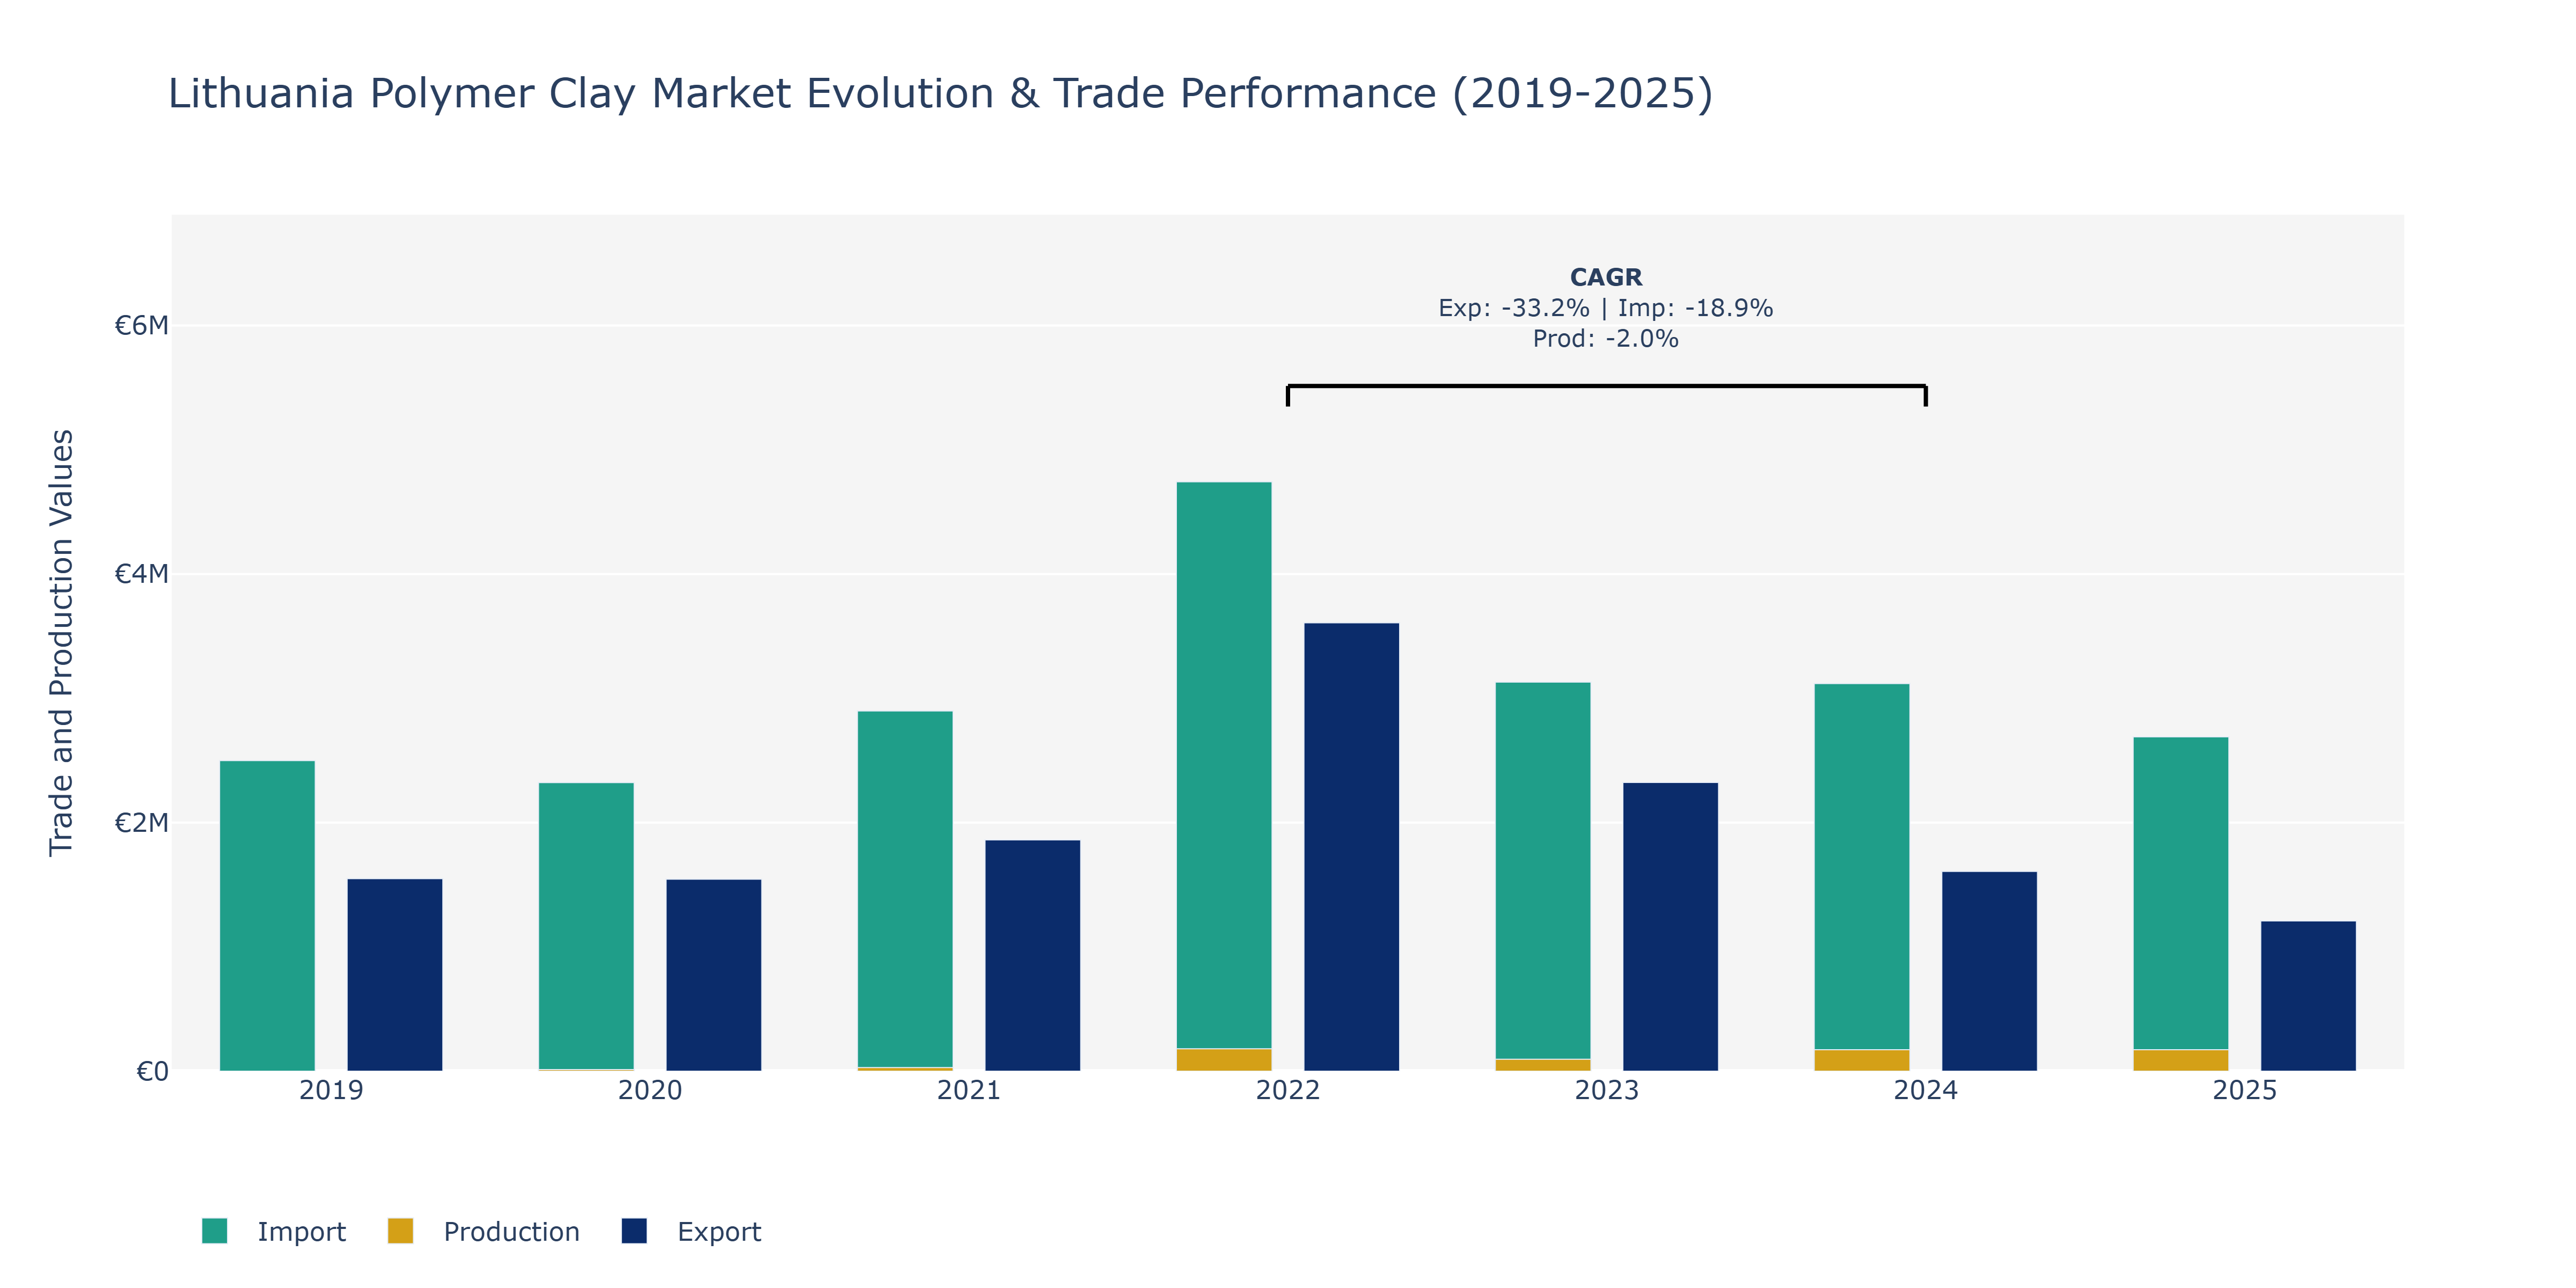
In the Lithuania Polymer Clay Market, Exports remained relatively stable from 2019 to 2020, showing a slight decrease before experiencing a notable surge in 2021, more than doubling the 2020 figure, and peaking in 2022 at €3.61 million. This substantial increase can be attributed to enhanced product quality, expanded market reach, and potentially favorable trade agreements. Conversely, Imports followed a similar pattern, decreasing slightly in 2020 before steadily rising each year to reach €4.74 million in 2022. This growth may reflect increased demand for raw materials or advanced technologies not readily available domestically. Production levels fluctuated over the years, with a significant spike in 2022 to €180 million, possibly due to increased investments in manufacturing capabilities or technological advancements leading to higher output efficiency. The downward trend in production thereafter might indicate adjustments in capacity or market conditions necessitating a reevaluation of production strategies. Such fluctuations highlight the market's responsiveness to both domestic and global factors, underlining the importance of strategic planning and adaptation within the industry.
Key Highlights of the Report:
- Lithuania Polymer Clay Market Outlook
- Market Size of Lithuania Polymer Clay Market, 2025
- Forecast of Lithuania Polymer Clay Market, 2032
- Historical Data and Forecast of Lithuania Polymer Clay Revenues & Volume for the Period 2022 - 2032F
- Lithuania Polymer Clay Market Trend Evolution
- Lithuania Polymer Clay Market Drivers and Challenges
- Lithuania Polymer Clay Price Trends
- Lithuania Polymer Clay Porter`s Five Forces
- Lithuania Polymer Clay Industry Life Cycle
- Historical Data and Forecast of Lithuania Polymer Clay Market Revenues & Volume By Product Form for the Period 2022 - 2032F
- Historical Data and Forecast of Lithuania Polymer Clay Market Revenues & Volume By Solid for the Period 2022 - 2032F
- Historical Data and Forecast of Lithuania Polymer Clay Market Revenues & Volume By Liquid for the Period 2022 - 2032F
- Historical Data and Forecast of Lithuania Polymer Clay Market Revenues & Volume By Application for the Period 2022 - 2032F
- Historical Data and Forecast of Lithuania Polymer Clay Market Revenues & Volume By Jewelry Making for the Period 2022 - 2032F
- Historical Data and Forecast of Lithuania Polymer Clay Market Revenues & Volume By Manufacturing of Toys and Novelty Items for the Period 2022 - 2032F
- Historical Data and Forecast of Lithuania Polymer Clay Market Revenues & Volume By Arts and Sculpture Making for the Period 2022 - 2032F
- Historical Data and Forecast of Lithuania Polymer Clay Market Revenues & Volume By Crockery and Ceramic Products for the Period 2022 - 2032F
- Historical Data and Forecast of Lithuania Polymer Clay Market Revenues & Volume By Others for the Period 2022 - 2032F
- Historical Data and Forecast of Lithuania Polymer Clay Market Revenues & Volume By End Use for the Period 2022 - 2032F
- Historical Data and Forecast of Lithuania Polymer Clay Market Revenues & Volume By Residential for the Period 2022 - 2032F
- Historical Data and Forecast of Lithuania Polymer Clay Market Revenues & Volume By Commercial for the Period 2022 - 2032F
- Historical Data and Forecast of Lithuania Polymer Clay Market Revenues & Volume By Industrial for the Period 2022 - 2032F
- Lithuania Polymer Clay Import Export Trade Statistics
- Market Opportunity Assessment By Product Form
- Market Opportunity Assessment By Application
- Market Opportunity Assessment By End Use
- Lithuania Polymer Clay Top Companies Market Share
- Lithuania Polymer Clay Competitive Benchmarking By Technical and Operational Parameters
- Lithuania Polymer Clay Company Profiles
- Lithuania Polymer Clay Key Strategic Recommendations
Frequently Asked Questions About the Market Study (FAQs):
6Wresearch actively monitors the Lithuania Polymer Clay Market and publishes its comprehensive annual report, highlighting emerging trends, growth drivers, revenue analysis, and forecast outlook. Our insights help businesses to make data-backed strategic decisions with ongoing market dynamics. Our analysts track relevent industries related to the Lithuania Polymer Clay Market, allowing our clients with actionable intelligence and reliable forecasts tailored to emerging regional needs.
Yes, we provide customisation as per your requirements. To learn more, feel free to contact us on sales@6wresearch.com
1 Executive Summary |
2 Introduction |
2.1 Key Highlights of the Report |
2.2 Report Description |
2.3 Market Scope & Segmentation |
2.4 Research Methodology |
2.5 Assumptions |
3 Lithuania Polymer Clay Market Overview |
3.1 Lithuania Country Macro Economic Indicators |
3.2 Lithuania Polymer Clay Market Revenues & Volume, 2022 & 2032F |
3.3 Lithuania Polymer Clay Market - Industry Life Cycle |
3.4 Lithuania Polymer Clay Market - Porter's Five Forces |
3.5 Lithuania Polymer Clay Market Revenues & Volume Share, By Product Form, 2022 & 2032F |
3.6 Lithuania Polymer Clay Market Revenues & Volume Share, By Application, 2022 & 2032F |
3.7 Lithuania Polymer Clay Market Revenues & Volume Share, By End Use, 2022 & 2032F |
4 Lithuania Polymer Clay Market Dynamics |
4.1 Impact Analysis |
4.2 Market Drivers |
4.2.1 Increasing popularity of DIY crafts and hobbies |
4.2.2 Growing demand for customized and personalized products |
4.2.3 Rising awareness about eco-friendly and non-toxic art supplies |
4.3 Market Restraints |
4.3.1 Impact of economic downturn on disposable income for leisure activities |
4.3.2 Competition from alternative art and craft materials |
4.3.3 Challenges in sourcing quality raw materials at competitive prices |
5 Lithuania Polymer Clay Market Trends |
6 Lithuania Polymer Clay Market Segmentations |
6.1 Lithuania Polymer Clay Market, By Product Form |
6.1.1 Overview and Analysis |
6.1.2 Lithuania Polymer Clay Market Revenues & Volume, By Solid, 2022 - 2032F |
6.1.3 Lithuania Polymer Clay Market Revenues & Volume, By Liquid, 2022 - 2032F |
6.2 Lithuania Polymer Clay Market, By Application |
6.2.1 Overview and Analysis |
6.2.2 Lithuania Polymer Clay Market Revenues & Volume, By Jewelry Making, 2022 - 2032F |
6.2.3 Lithuania Polymer Clay Market Revenues & Volume, By Manufacturing of Toys and Novelty Items, 2022 - 2032F |
6.2.4 Lithuania Polymer Clay Market Revenues & Volume, By Arts and Sculpture Making, 2022 - 2032F |
6.2.5 Lithuania Polymer Clay Market Revenues & Volume, By Crockery and Ceramic Products, 2022 - 2032F |
6.2.6 Lithuania Polymer Clay Market Revenues & Volume, By Others, 2022 - 2032F |
6.3 Lithuania Polymer Clay Market, By End Use |
6.3.1 Overview and Analysis |
6.3.2 Lithuania Polymer Clay Market Revenues & Volume, By Residential, 2022 - 2032F |
6.3.3 Lithuania Polymer Clay Market Revenues & Volume, By Commercial, 2022 - 2032F |
6.3.4 Lithuania Polymer Clay Market Revenues & Volume, By Industrial, 2022 - 2032F |
7 Lithuania Polymer Clay Market Import-Export Trade Statistics |
7.1 Lithuania Polymer Clay Market Export to Major Countries |
7.2 Lithuania Polymer Clay Market Imports from Major Countries |
8 Lithuania Polymer Clay Market Key Performance Indicators |
8.1 Percentage of consumers engaged in DIY crafts and hobbies |
8.2 Number of workshops or events promoting the use of polymer clay |
8.3 Growth in online searches or social media mentions related to polymer clay tutorials and projects |
9 Lithuania Polymer Clay Market - Opportunity Assessment |
9.1 Lithuania Polymer Clay Market Opportunity Assessment, By Product Form, 2022 & 2032F |
9.2 Lithuania Polymer Clay Market Opportunity Assessment, By Application, 2022 & 2032F |
9.3 Lithuania Polymer Clay Market Opportunity Assessment, By End Use, 2022 & 2032F |
10 Lithuania Polymer Clay Market - Competitive Landscape |
10.1 Lithuania Polymer Clay Market Revenue Share, By Companies, 2025 |
10.2 Lithuania Polymer Clay Market Competitive Benchmarking, By Operating and Technical Parameters |
11 Company Profiles |
12 Recommendations | 13 Disclaimer |
Global Go To Market Strategy - 2030
Export potential enables firms to identify high-growth global markets with greater confidence by combining advanced trade intelligence with a structured quantitative methodology. The framework analyzes emerging demand trends and country-level import patterns while integrating macroeconomic and trade datasets such as GDP and population forecasts, bilateral import–export flows, tariff structures, elasticity differentials between developed and developing economies, geographic distance, and import demand projections. Using weighted trade values from 2020–2024 as the base period to project country-to-country export potential for 2030, these inputs are operationalized through calculated drivers such as gravity model parameters, tariff impact factors, and projected GDP per-capita growth. Through an analysis of hidden potentials, demand hotspots, and market conditions that are most favorable to success, this method enables firms to focus on target countries, maximize returns, and global expansion with data, backed by accuracy.
By factoring in the projected importer demand gap that is currently unmet and could be potential opportunity, it identifies the potential for the Exporter (Country) among 190 countries, against the general trade analysis, which identifies the biggest importer or exporter.
To discover high-growth global markets and optimize your business strategy:
Click Here
Pricing
- Single User License$ 1,995
- Department License$ 2,400
- Site License$ 3,120
- Global License$ 3,795

Leadership Perspectives from Industry Events
Search
Thought Leadership and Analyst Meet


Our Clients
6WResearch In News
- Doha a strategic location for EV manufacturing hub: IPA Qatar
- Demand for luxury TVs surging in the GCC, says Samsung
- Empowering Growth: The Thriving Journey of Bangladesh’s Cable Industry
- Demand for luxury TVs surging in the GCC, says Samsung
- Video call with a traditional healer? Once unthinkable, it’s now common in South Africa
- Intelligent Buildings To Smooth GCC’s Path To Net Zero
Latest Reports
- Taiwan Airport Wireless Infrastructure Market (2026-2032)
- Vietnam Airport Wireless Infrastructure Market (2026-2032)
- Thailand Airport Wireless Infrastructure Market (2026-2032)
- South Korea Airport Wireless Infrastructure Market (2026-2032)
- Romania Airport Wireless Infrastructure Market (2026-2032)
- Qatar Airport Wireless Infrastructure Market (2026-2032)
- Philippines Airport Wireless Infrastructure Market (2026-2032)
- Japan Airport Wireless Infrastructure Market (2026-2032)
- Taiwan Airport Winter Services Market (2026-2032)
- Vietnam Airport Winter Services Market (2026-2032)
Industry Events and Analyst Meet

HIMTEX 2026

India Refining Summit 2026

India EV Show 2026

EV tech India Expo 2026

Auto Tech Asia 2026
Whitepaper
- Middle East & Africa Commercial Security Market Click here to view more.
- Middle East & Africa Fire Safety Systems & Equipment Market Click here to view more.
- GCC Drone Market Click here to view more.
- Middle East Lighting Fixture Market Click here to view more.
- GCC Physical & Perimeter Security Market Click here to view more.