Lithuania Polyvinyl Chloride Market (2026-2032) | Analysis, Size, Revenue, Industry, Forecast, Segmentation, Growth, Outlook, Companies, Value, Share & Trends
Market Forecast By Type (Flexible, Rigid), By Application (Pipes & Fittings, Films & Sheets, Profiles & Tubes, Cables, Bottles, Others), By End Use (Construction, Automotive, Packaging, Consumer Goods, Others) And Competitive Landscape
| Product Code: ETC5037833 | Publication Date: Nov 2023 | Updated Date: Apr 2026 | Product Type: Market Research Report | |
| Publisher: 6Wresearch | Author: Shubham Padhi | No. of Pages: 60 | No. of Figures: 30 | No. of Tables: 5 |
Lithuania Polyvinyl Chloride Market Size (2020-2030)
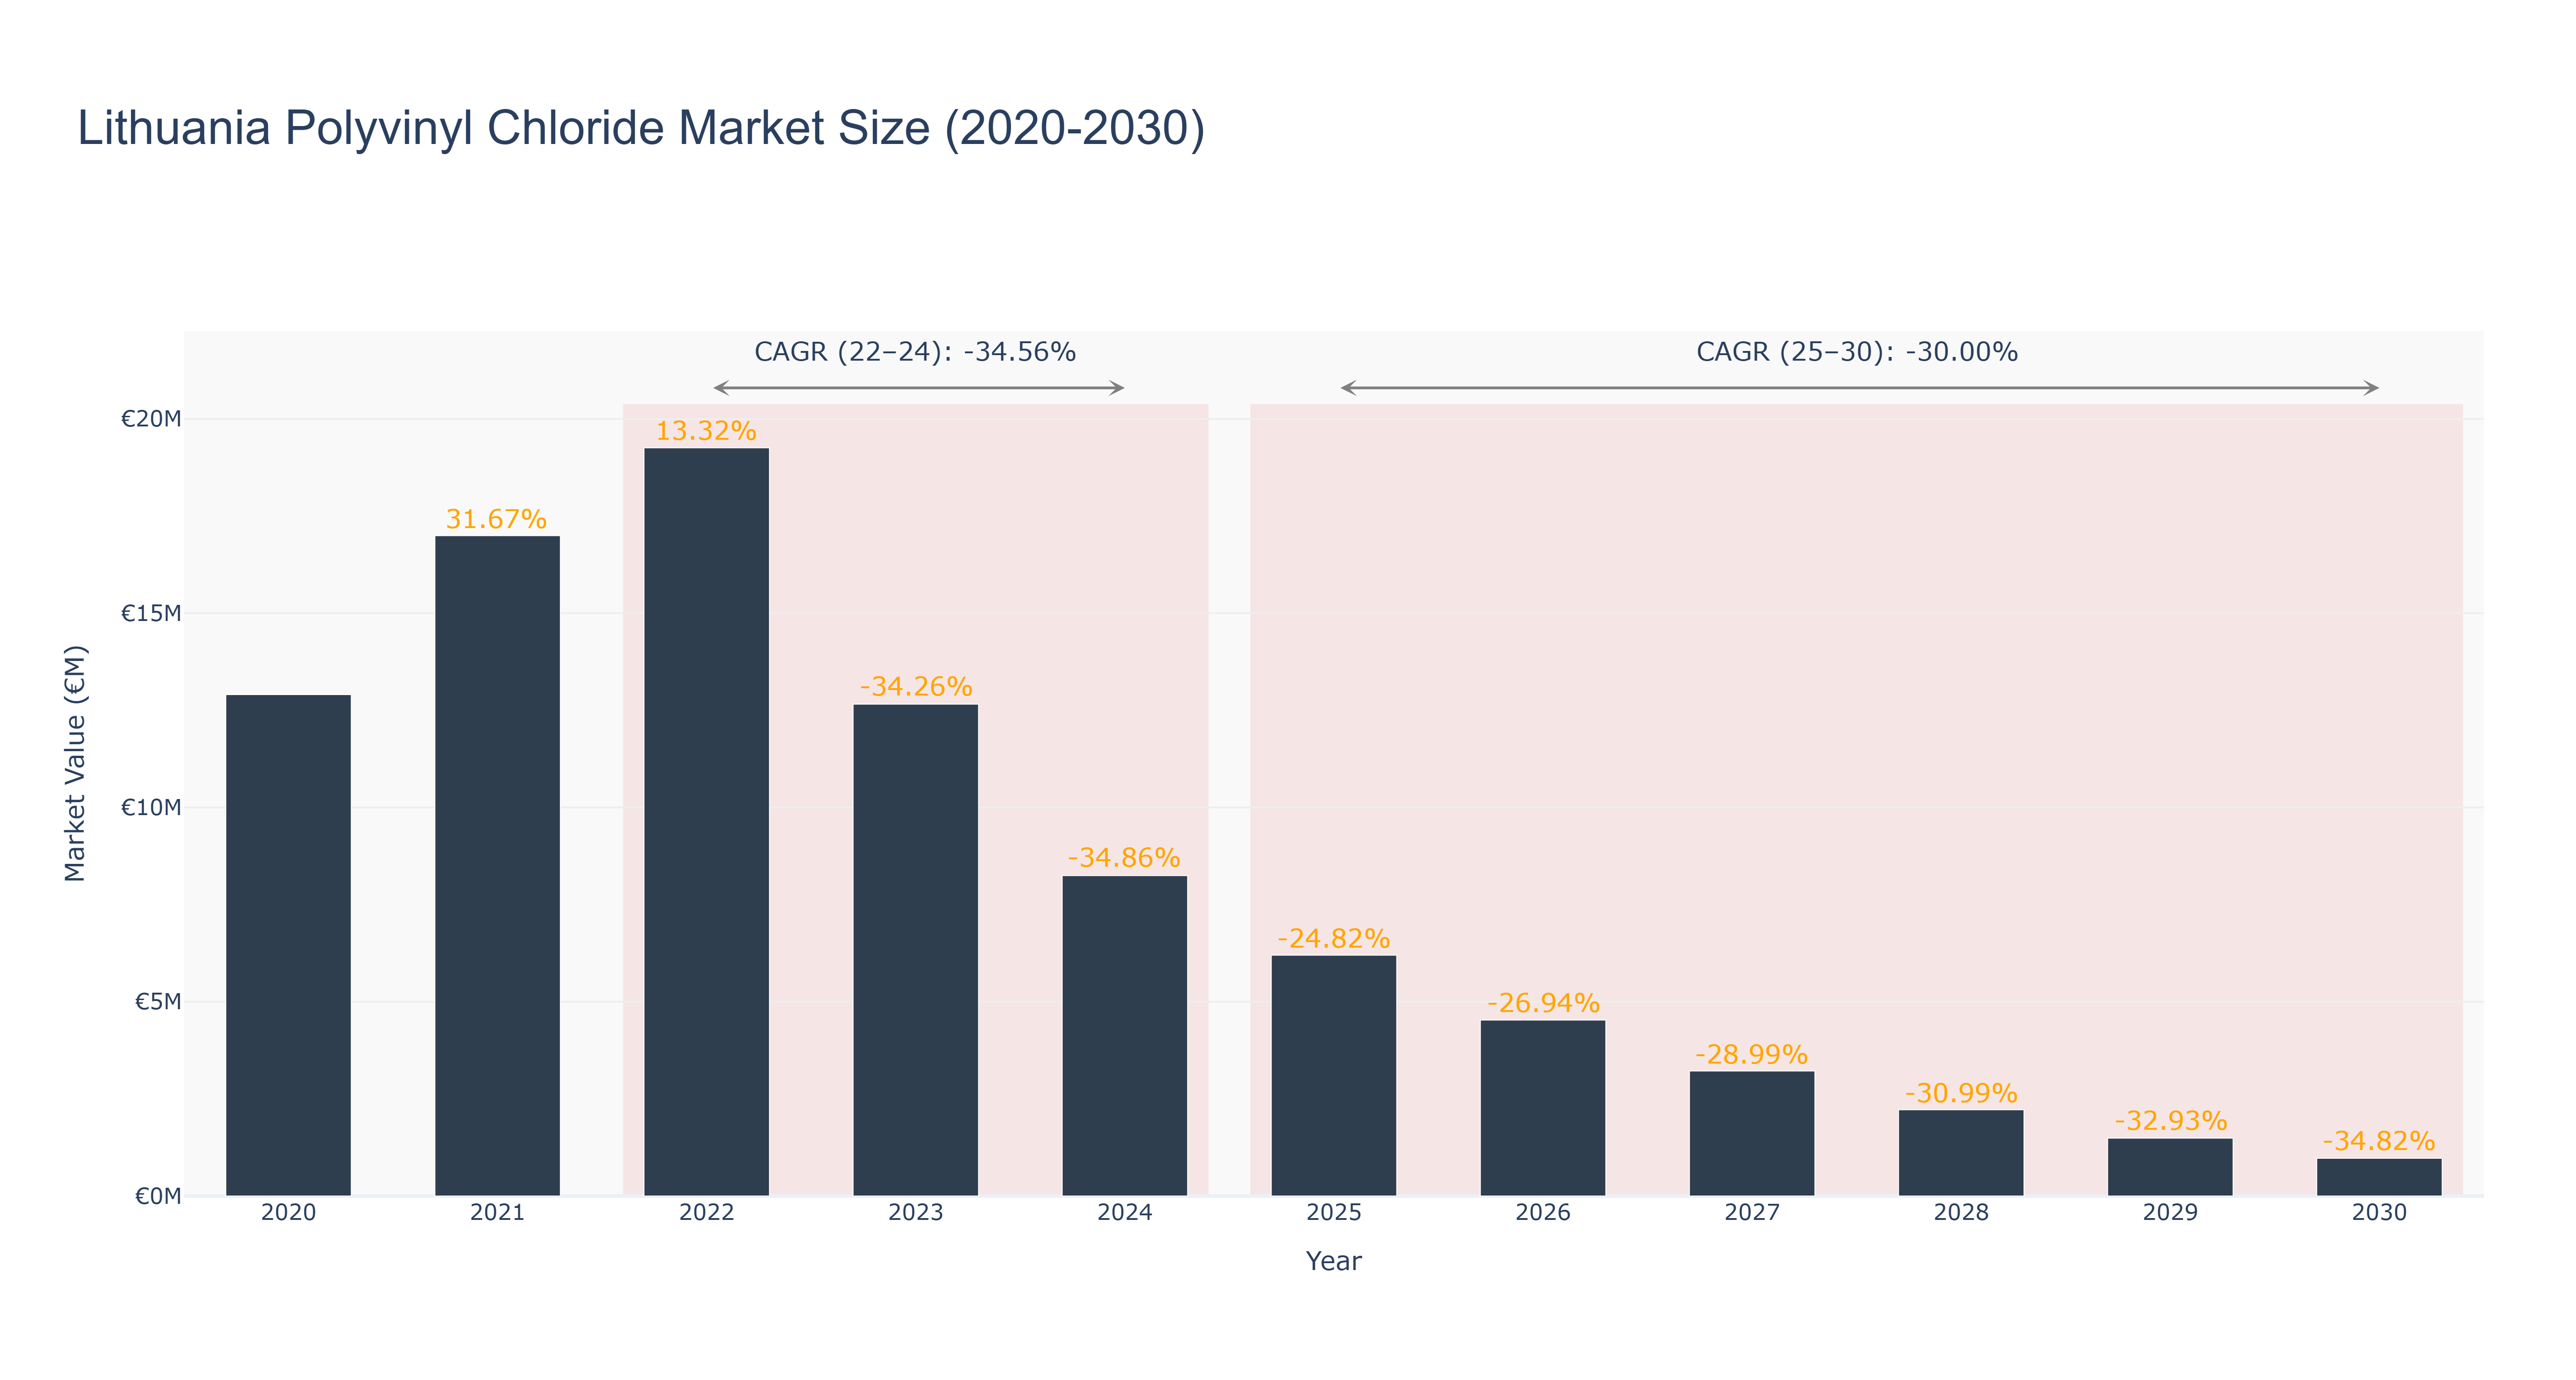
The Lithuania Polyvinyl Chloride Market has experienced a significant decline in market size over the years. The peak market size was €19.26 million in 2022, followed by a sharp decrease to €8.25 million in 2024. The forecasted market size from 2025 to 2030 continues on a downward trend, with an expected size of €0.97 million in 2030. The CAGR values reflect this downward trajectory, with a CAGR of -34.56% from 2022 to 2024 and -30.0% from 2025 to 2030. The market's decline can be attributed to various factors such as changing consumer preferences, economic conditions, and environmental concerns impacting the demand for PVC products. Looking ahead, Lithuania is focusing on sustainable initiatives in the PVC sector to align with global environmental standards, promoting innovation and eco-friendly practices to revitalize the market.
Lithuania Polyvinyl Chloride Market: Production & Trade Performance (2019-2025)
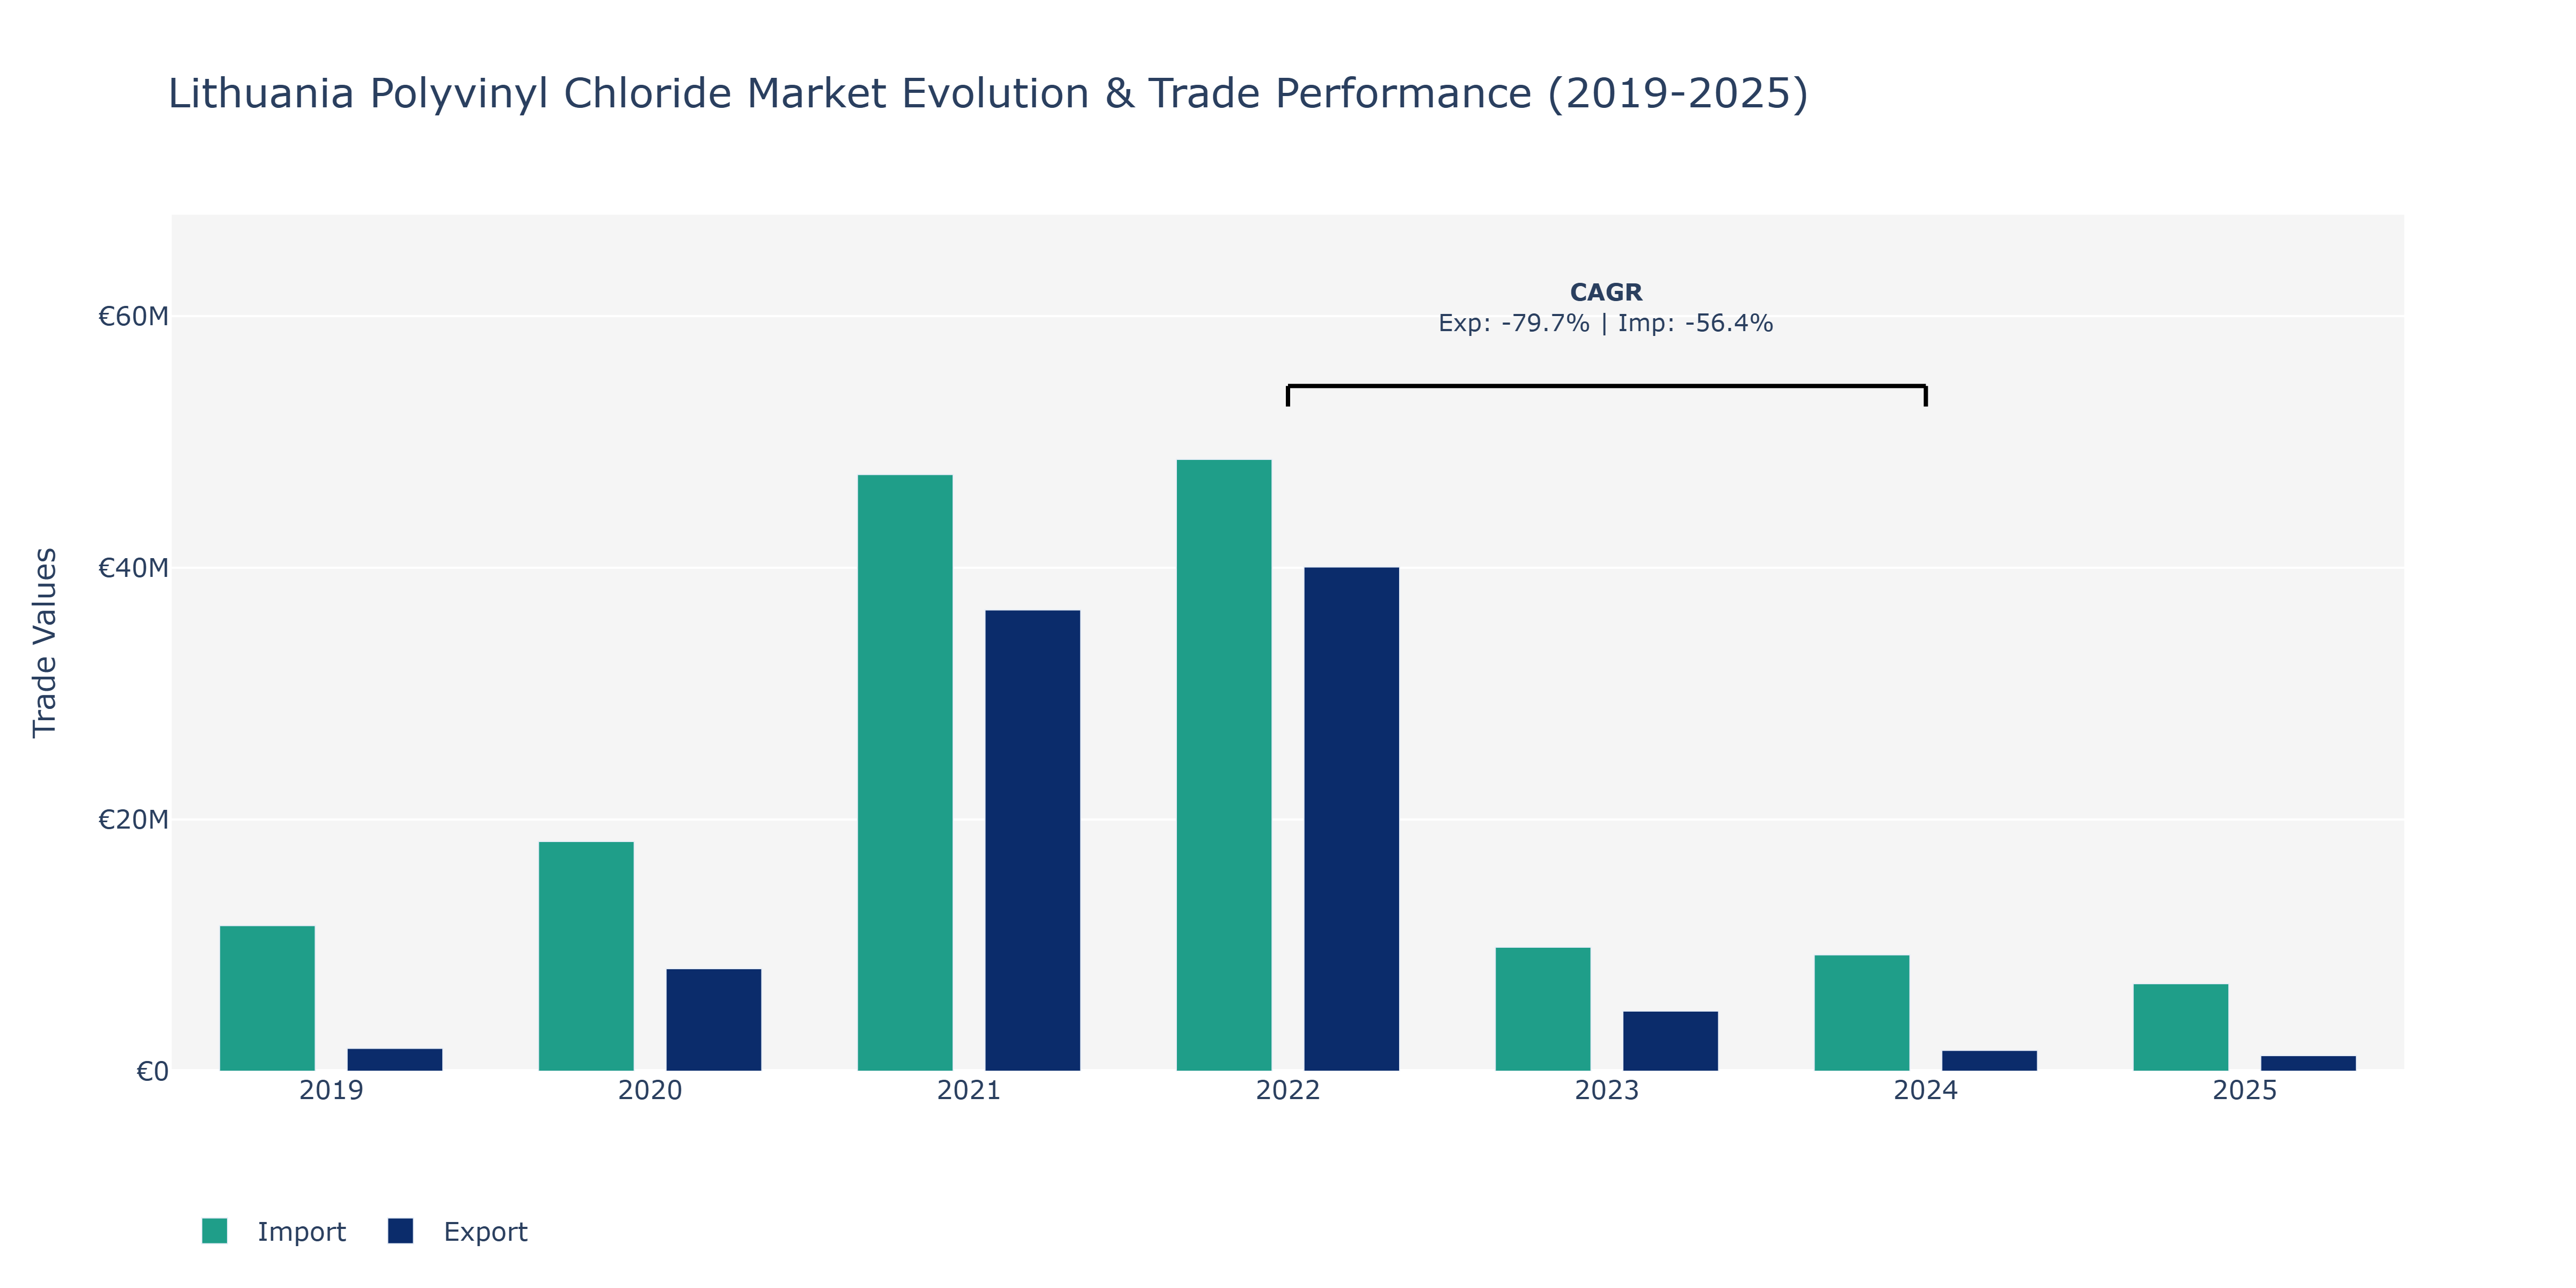
In the Lithuania Polyvinyl Chloride Market, exports demonstrated a fluctuating pattern over the years. In 2019, exports stood at €1.82 million, spiked to €8.15 million in 2020, and reached a peak at €40.06 million in 2021 before sharply declining to €4.78 million in 2023. This substantial drop in 2023 could be attributed to various factors such as global economic conditions, shifting market demands, or supply chain disruptions. Imports, on the other hand, followed a similar trend. Starting at €11.57 million in 2019, showing a significant rise to €18.25 million in 2020, reaching a peak of €48.61 million in 2022, imports then decreased to €9.25 million in 2024 and stabilized at €6.95 million in 2025. These fluctuations in imports may have been influenced by changes in domestic demand, currency fluctuations, or international trade policies impacting the PVC market. To sustain growth in this market, industry players may need to closely monitor these trends and adapt their strategies accordingly to navigate through future uncertainties in the global trade landscape.
Key Highlights of the Report:
- Lithuania Polyvinyl Chloride Market Outlook
- Market Size of Lithuania Polyvinyl Chloride Market, 2025
- Forecast of Lithuania Polyvinyl Chloride Market, 2032
- Historical Data and Forecast of Lithuania Polyvinyl Chloride Revenues & Volume for the Period 2022 - 2032F
- Lithuania Polyvinyl Chloride Market Trend Evolution
- Lithuania Polyvinyl Chloride Market Drivers and Challenges
- Lithuania Polyvinyl Chloride Price Trends
- Lithuania Polyvinyl Chloride Porter`s Five Forces
- Lithuania Polyvinyl Chloride Industry Life Cycle
- Historical Data and Forecast of Lithuania Polyvinyl Chloride Market Revenues & Volume By Type for the Period 2022 - 2032F
- Historical Data and Forecast of Lithuania Polyvinyl Chloride Market Revenues & Volume By Flexible for the Period 2022 - 2032F
- Historical Data and Forecast of Lithuania Polyvinyl Chloride Market Revenues & Volume By Rigid for the Period 2022 - 2032F
- Historical Data and Forecast of Lithuania Polyvinyl Chloride Market Revenues & Volume By Application for the Period 2022 - 2032F
- Historical Data and Forecast of Lithuania Polyvinyl Chloride Market Revenues & Volume By Pipes & Fittings for the Period 2022 - 2032F
- Historical Data and Forecast of Lithuania Polyvinyl Chloride Market Revenues & Volume By Films & Sheets for the Period 2022 - 2032F
- Historical Data and Forecast of Lithuania Polyvinyl Chloride Market Revenues & Volume By Profiles & Tubes for the Period 2022 - 2032F
- Historical Data and Forecast of Lithuania Polyvinyl Chloride Market Revenues & Volume By Cables for the Period 2022 - 2032F
- Historical Data and Forecast of Lithuania Polyvinyl Chloride Market Revenues & Volume By Bottles for the Period 2022 - 2032F
- Historical Data and Forecast of Lithuania Polyvinyl Chloride Market Revenues & Volume By Others for the Period 2022 - 2032F
- Historical Data and Forecast of Lithuania Polyvinyl Chloride Market Revenues & Volume By End Use for the Period 2022 - 2032F
- Historical Data and Forecast of Lithuania Polyvinyl Chloride Market Revenues & Volume By Construction for the Period 2022 - 2032F
- Historical Data and Forecast of Lithuania Polyvinyl Chloride Market Revenues & Volume By Automotive for the Period 2022 - 2032F
- Historical Data and Forecast of Lithuania Polyvinyl Chloride Market Revenues & Volume By Packaging for the Period 2022 - 2032F
- Historical Data and Forecast of Lithuania Polyvinyl Chloride Market Revenues & Volume By Consumer Goods for the Period 2022 - 2032F
- Historical Data and Forecast of Lithuania Polyvinyl Chloride Market Revenues & Volume By Others for the Period 2022 - 2032F
- Lithuania Polyvinyl Chloride Import Export Trade Statistics
- Market Opportunity Assessment By Type
- Market Opportunity Assessment By Application
- Market Opportunity Assessment By End Use
- Lithuania Polyvinyl Chloride Top Companies Market Share
- Lithuania Polyvinyl Chloride Competitive Benchmarking By Technical and Operational Parameters
- Lithuania Polyvinyl Chloride Company Profiles
- Lithuania Polyvinyl Chloride Key Strategic Recommendations
Frequently Asked Questions About the Market Study (FAQs):
6Wresearch actively monitors the Lithuania Polyvinyl Chloride Market and publishes its comprehensive annual report, highlighting emerging trends, growth drivers, revenue analysis, and forecast outlook. Our insights help businesses to make data-backed strategic decisions with ongoing market dynamics. Our analysts track relevent industries related to the Lithuania Polyvinyl Chloride Market, allowing our clients with actionable intelligence and reliable forecasts tailored to emerging regional needs.
Yes, we provide customisation as per your requirements. To learn more, feel free to contact us on sales@6wresearch.com
1 Executive Summary |
2 Introduction |
2.1 Key Highlights of the Report |
2.2 Report Description |
2.3 Market Scope & Segmentation |
2.4 Research Methodology |
2.5 Assumptions |
3 Lithuania Polyvinyl Chloride Market Overview |
3.1 Lithuania Country Macro Economic Indicators |
3.2 Lithuania Polyvinyl Chloride Market Revenues & Volume, 2022 & 2032F |
3.3 Lithuania Polyvinyl Chloride Market - Industry Life Cycle |
3.4 Lithuania Polyvinyl Chloride Market - Porter's Five Forces |
3.5 Lithuania Polyvinyl Chloride Market Revenues & Volume Share, By Type, 2022 & 2032F |
3.6 Lithuania Polyvinyl Chloride Market Revenues & Volume Share, By Application, 2022 & 2032F |
3.7 Lithuania Polyvinyl Chloride Market Revenues & Volume Share, By End Use, 2022 & 2032F |
4 Lithuania Polyvinyl Chloride Market Dynamics |
4.1 Impact Analysis |
4.2 Market Drivers |
4.2.1 Growing demand for construction materials in Lithuania |
4.2.2 Increasing use of polyvinyl chloride in the automotive industry |
4.2.3 Favorable government regulations promoting the use of polyvinyl chloride |
4.3 Market Restraints |
4.3.1 Fluctuating prices of raw materials used in polyvinyl chloride production |
4.3.2 Environmental concerns and regulations related to the use of polyvinyl chloride |
4.3.3 Competition from alternative materials such as polyethylene and polypropylene |
5 Lithuania Polyvinyl Chloride Market Trends |
6 Lithuania Polyvinyl Chloride Market Segmentations |
6.1 Lithuania Polyvinyl Chloride Market, By Type |
6.1.1 Overview and Analysis |
6.1.2 Lithuania Polyvinyl Chloride Market Revenues & Volume, By Flexible, 2022 - 2032F |
6.1.3 Lithuania Polyvinyl Chloride Market Revenues & Volume, By Rigid, 2022 - 2032F |
6.2 Lithuania Polyvinyl Chloride Market, By Application |
6.2.1 Overview and Analysis |
6.2.2 Lithuania Polyvinyl Chloride Market Revenues & Volume, By Pipes & Fittings, 2022 - 2032F |
6.2.3 Lithuania Polyvinyl Chloride Market Revenues & Volume, By Films & Sheets, 2022 - 2032F |
6.2.4 Lithuania Polyvinyl Chloride Market Revenues & Volume, By Profiles & Tubes, 2022 - 2032F |
6.2.5 Lithuania Polyvinyl Chloride Market Revenues & Volume, By Cables, 2022 - 2032F |
6.2.6 Lithuania Polyvinyl Chloride Market Revenues & Volume, By Bottles, 2022 - 2032F |
6.2.7 Lithuania Polyvinyl Chloride Market Revenues & Volume, By Others, 2022 - 2032F |
6.3 Lithuania Polyvinyl Chloride Market, By End Use |
6.3.1 Overview and Analysis |
6.3.2 Lithuania Polyvinyl Chloride Market Revenues & Volume, By Construction, 2022 - 2032F |
6.3.3 Lithuania Polyvinyl Chloride Market Revenues & Volume, By Automotive, 2022 - 2032F |
6.3.4 Lithuania Polyvinyl Chloride Market Revenues & Volume, By Packaging, 2022 - 2032F |
6.3.5 Lithuania Polyvinyl Chloride Market Revenues & Volume, By Consumer Goods, 2022 - 2032F |
6.3.6 Lithuania Polyvinyl Chloride Market Revenues & Volume, By Others, 2022 - 2032F |
7 Lithuania Polyvinyl Chloride Market Import-Export Trade Statistics |
7.1 Lithuania Polyvinyl Chloride Market Export to Major Countries |
7.2 Lithuania Polyvinyl Chloride Market Imports from Major Countries |
8 Lithuania Polyvinyl Chloride Market Key Performance Indicators |
8.1 Percentage increase in the demand for construction materials in Lithuania |
8.2 Number of automotive applications utilizing polyvinyl chloride |
8.3 Compliance rate with government regulations promoting polyvinyl chloride usage |
9 Lithuania Polyvinyl Chloride Market - Opportunity Assessment |
9.1 Lithuania Polyvinyl Chloride Market Opportunity Assessment, By Type, 2022 & 2032F |
9.2 Lithuania Polyvinyl Chloride Market Opportunity Assessment, By Application, 2022 & 2032F |
9.3 Lithuania Polyvinyl Chloride Market Opportunity Assessment, By End Use, 2022 & 2032F |
10 Lithuania Polyvinyl Chloride Market - Competitive Landscape |
10.1 Lithuania Polyvinyl Chloride Market Revenue Share, By Companies, 2025 |
10.2 Lithuania Polyvinyl Chloride Market Competitive Benchmarking, By Operating and Technical Parameters |
11 Company Profiles |
12 Recommendations | 13 Disclaimer |
Global Go To Market Strategy - 2030
Export potential enables firms to identify high-growth global markets with greater confidence by combining advanced trade intelligence with a structured quantitative methodology. The framework analyzes emerging demand trends and country-level import patterns while integrating macroeconomic and trade datasets such as GDP and population forecasts, bilateral import–export flows, tariff structures, elasticity differentials between developed and developing economies, geographic distance, and import demand projections. Using weighted trade values from 2020–2024 as the base period to project country-to-country export potential for 2030, these inputs are operationalized through calculated drivers such as gravity model parameters, tariff impact factors, and projected GDP per-capita growth. Through an analysis of hidden potentials, demand hotspots, and market conditions that are most favorable to success, this method enables firms to focus on target countries, maximize returns, and global expansion with data, backed by accuracy.
By factoring in the projected importer demand gap that is currently unmet and could be potential opportunity, it identifies the potential for the Exporter (Country) among 190 countries, against the general trade analysis, which identifies the biggest importer or exporter.
To discover high-growth global markets and optimize your business strategy:
Click Here
Pricing
- Single User License$ 1,995
- Department License$ 2,400
- Site License$ 3,120
- Global License$ 3,795

Leadership Perspectives from Industry Events
Search
Thought Leadership and Analyst Meet


Our Clients
6WResearch In News
- Doha a strategic location for EV manufacturing hub: IPA Qatar
- Demand for luxury TVs surging in the GCC, says Samsung
- Empowering Growth: The Thriving Journey of Bangladesh’s Cable Industry
- Demand for luxury TVs surging in the GCC, says Samsung
- Video call with a traditional healer? Once unthinkable, it’s now common in South Africa
- Intelligent Buildings To Smooth GCC’s Path To Net Zero
Latest Reports
- Taiwan Airport Wireless Infrastructure Market (2026-2032)
- Vietnam Airport Wireless Infrastructure Market (2026-2032)
- Thailand Airport Wireless Infrastructure Market (2026-2032)
- South Korea Airport Wireless Infrastructure Market (2026-2032)
- Romania Airport Wireless Infrastructure Market (2026-2032)
- Qatar Airport Wireless Infrastructure Market (2026-2032)
- Philippines Airport Wireless Infrastructure Market (2026-2032)
- Japan Airport Wireless Infrastructure Market (2026-2032)
- Taiwan Airport Winter Services Market (2026-2032)
- Vietnam Airport Winter Services Market (2026-2032)
Industry Events and Analyst Meet

HIMTEX 2026

India Refining Summit 2026

India EV Show 2026

EV tech India Expo 2026

Auto Tech Asia 2026
Whitepaper
- Middle East & Africa Commercial Security Market Click here to view more.
- Middle East & Africa Fire Safety Systems & Equipment Market Click here to view more.
- GCC Drone Market Click here to view more.
- Middle East Lighting Fixture Market Click here to view more.
- GCC Physical & Perimeter Security Market Click here to view more.