Lithuania Recloser Market (2026-2032) | Growth, Trends, Value, Revenue, Companies, Forecast, Segmentation, Outlook, Size, Analysis, Industry & Share
Market Forecast By Phase Type (Three Phase, Single Phase, Triple-single Phase), By Control Type (Electronic , Hydraulic), By Voltage Rating (Up to 15 kV, 16-27 kV, 28-38 kV) And Competitive Landscape
| Product Code: ETC5760935 | Publication Date: Nov 2023 | Updated Date: Apr 2026 | Product Type: Market Research Report | |
| Publisher: 6Wresearch | Author: Ravi Bhandari | No. of Pages: 60 | No. of Figures: 30 | No. of Tables: 5 |
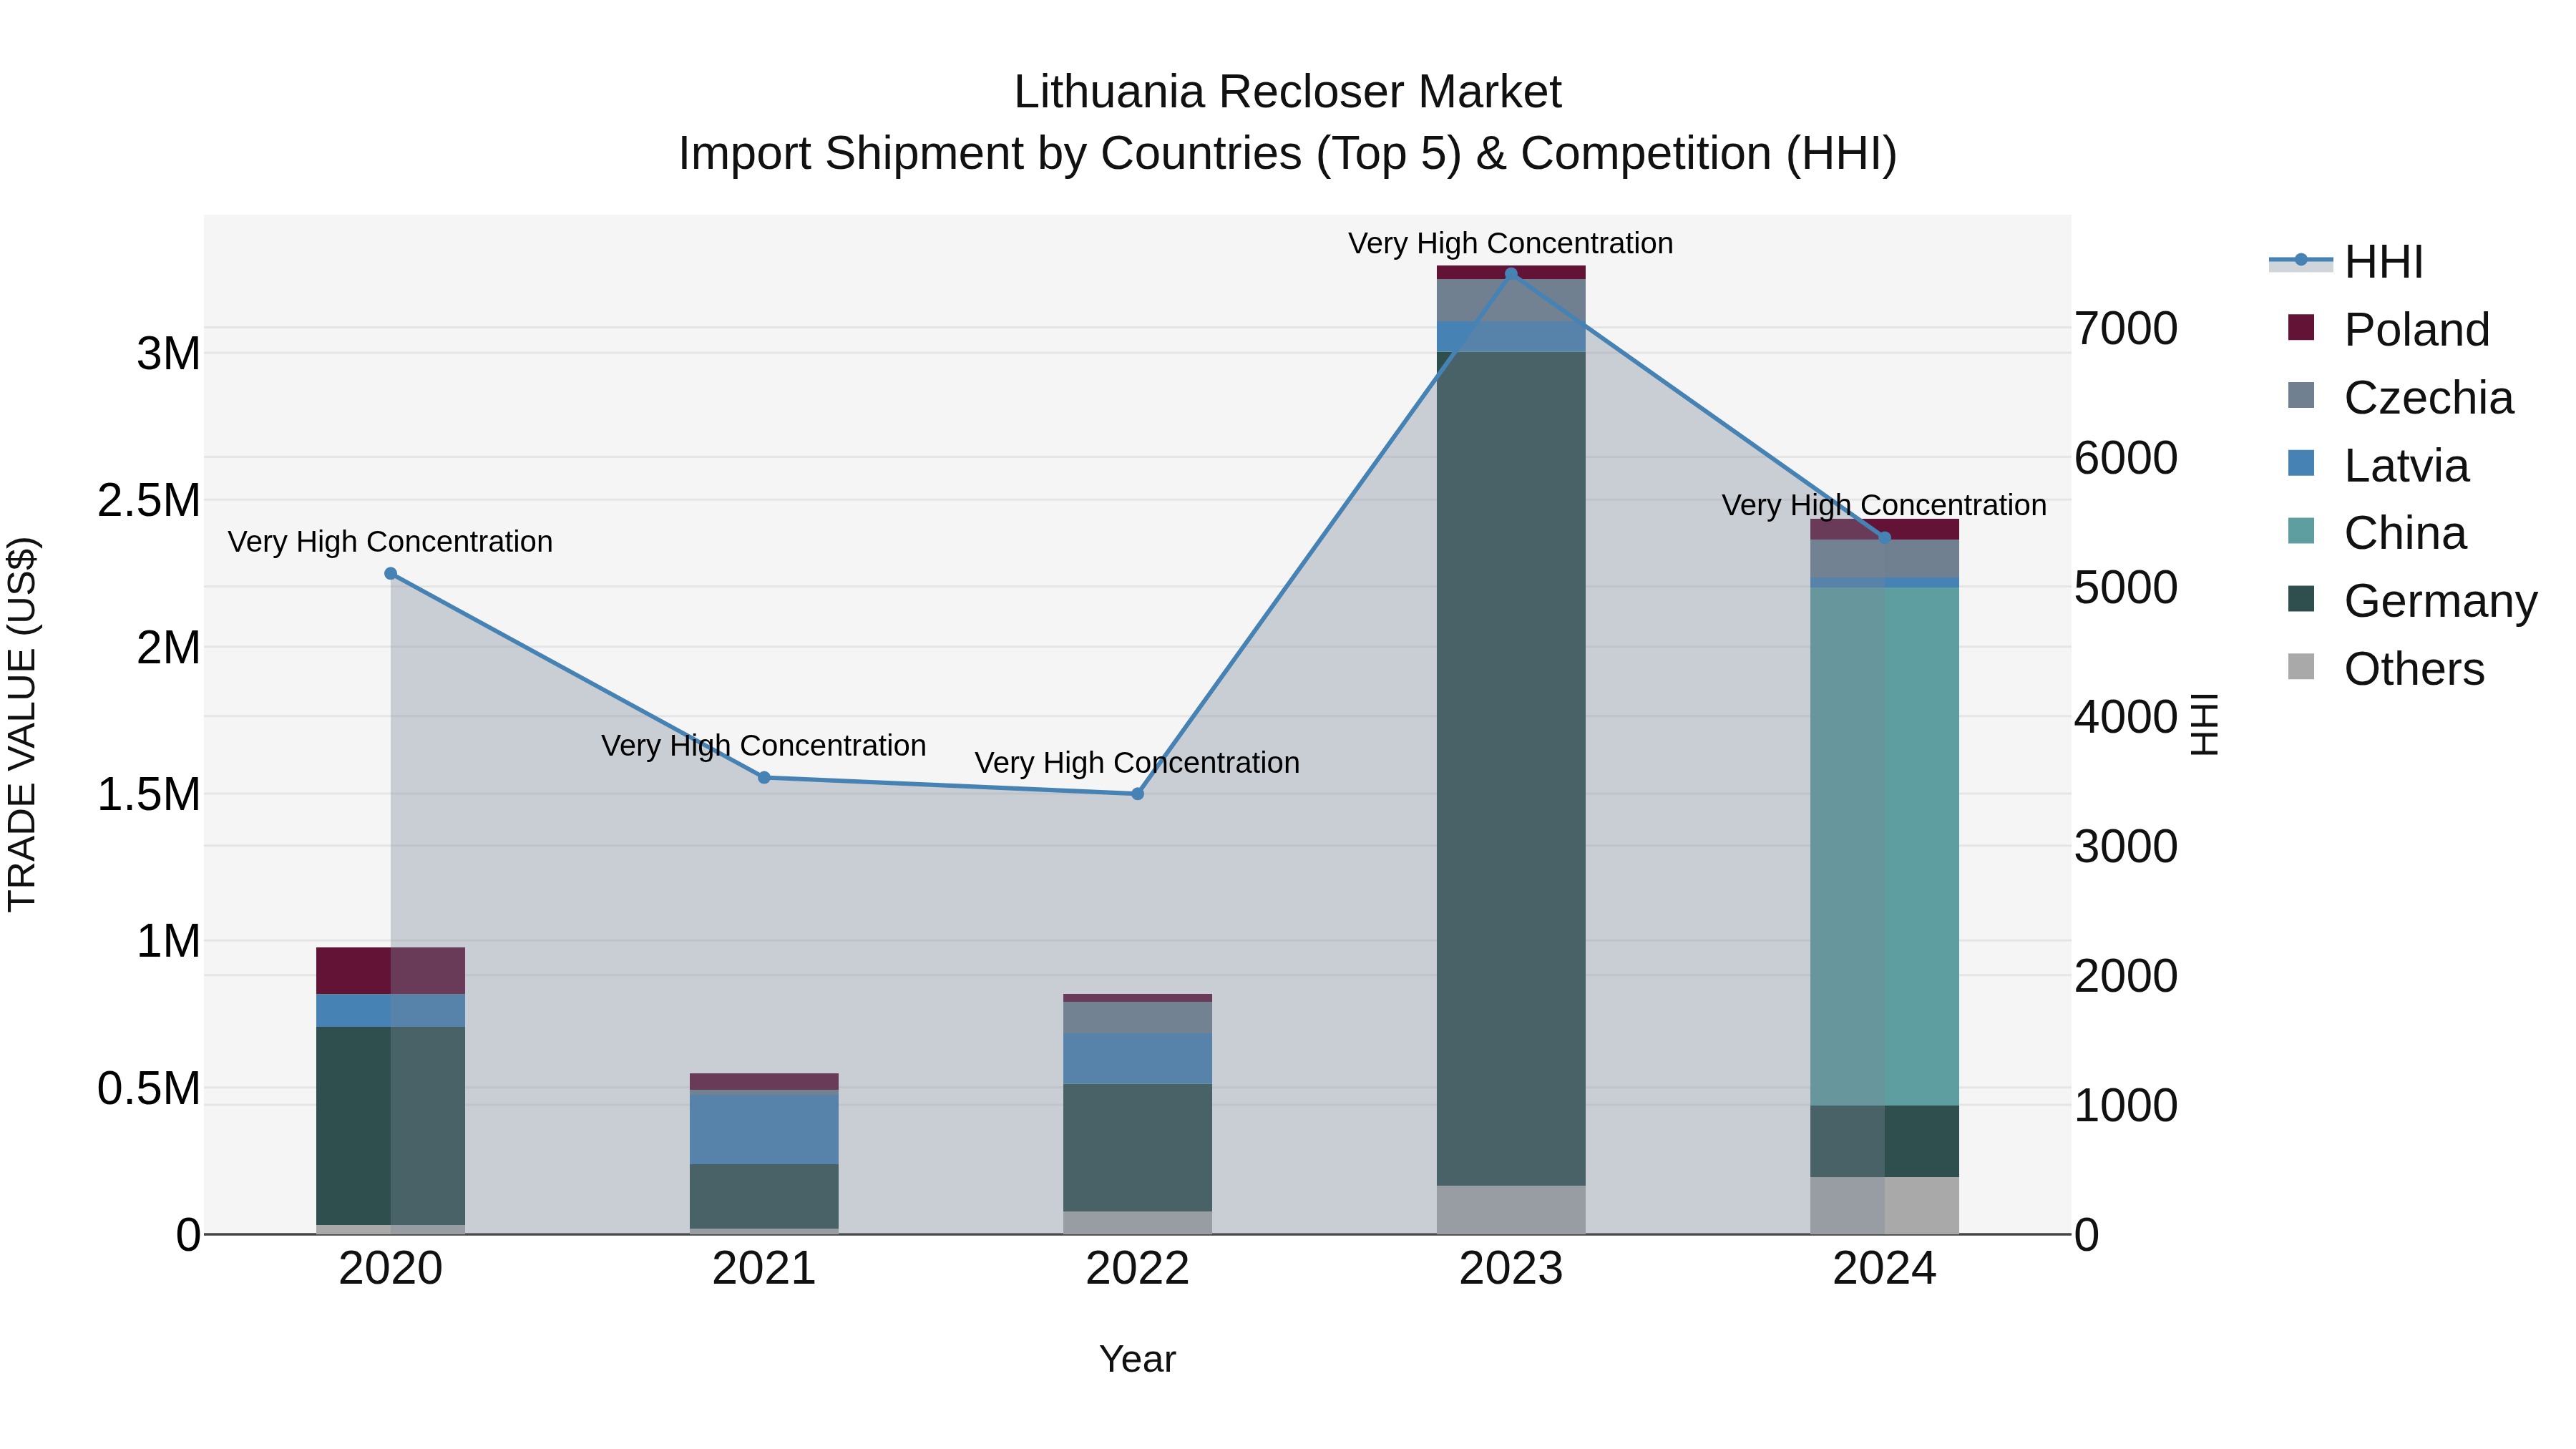
Lithuania Recloser Market Top 5 Importing Countries and Market Competition (HHI) Analysis
Lithuania`s recloser import market in 2024 continues to be dominated by top exporters such as China, Germany, Czechia, Australia, and Finland. Despite a notably high concentration with a Herfindahl-Hirschman Index (HHI), the market has shown impressive growth with a Compound Annual Growth Rate (CAGR) of 25.69% from 2020 to 2024. However, there was a slight setback in growth between 2023 and 2024 with a negative growth rate of -26.13%. The market dynamics suggest a competitive landscape with potential for further developments in the coming years.
Key Highlights of the Report:
- Lithuania Recloser Market Outlook
- Market Size of Lithuania Recloser Market, 2025
- Forecast of Lithuania Recloser Market, 2032
- Historical Data and Forecast of Lithuania Recloser Revenues & Volume for the Period 2022 - 2032F
- Lithuania Recloser Market Trend Evolution
- Lithuania Recloser Market Drivers and Challenges
- Lithuania Recloser Price Trends
- Lithuania Recloser Porter`s Five Forces
- Lithuania Recloser Industry Life Cycle
- Historical Data and Forecast of Lithuania Recloser Market Revenues & Volume By Phase Type for the Period 2022 - 2032F
- Historical Data and Forecast of Lithuania Recloser Market Revenues & Volume By Three Phase for the Period 2022 - 2032F
- Historical Data and Forecast of Lithuania Recloser Market Revenues & Volume By Single Phase for the Period 2022 - 2032F
- Historical Data and Forecast of Lithuania Recloser Market Revenues & Volume By Triple-single Phase for the Period 2022 - 2032F
- Historical Data and Forecast of Lithuania Recloser Market Revenues & Volume By Control Type for the Period 2022 - 2032F
- Historical Data and Forecast of Lithuania Recloser Market Revenues & Volume By Electronic for the Period 2022 - 2032F
- Historical Data and Forecast of Lithuania Recloser Market Revenues & Volume By Hydraulic for the Period 2022 - 2032F
- Historical Data and Forecast of Lithuania Recloser Market Revenues & Volume By Voltage Rating for the Period 2022 - 2032F
- Historical Data and Forecast of Lithuania Recloser Market Revenues & Volume By Up to 15 kV for the Period 2022 - 2032F
- Historical Data and Forecast of Lithuania Recloser Market Revenues & Volume By 16-27 kV for the Period 2022 - 2032F
- Historical Data and Forecast of Lithuania Recloser Market Revenues & Volume By 28-38 kV for the Period 2022 - 2032F
- Lithuania Recloser Import Export Trade Statistics
- Market Opportunity Assessment By Phase Type
- Market Opportunity Assessment By Control Type
- Market Opportunity Assessment By Voltage Rating
- Lithuania Recloser Top Companies Market Share
- Lithuania Recloser Competitive Benchmarking By Technical and Operational Parameters
- Lithuania Recloser Company Profiles
- Lithuania Recloser Key Strategic Recommendations
Frequently Asked Questions About the Market Study (FAQs):
6Wresearch actively monitors the Lithuania Recloser Market and publishes its comprehensive annual report, highlighting emerging trends, growth drivers, revenue analysis, and forecast outlook. Our insights help businesses to make data-backed strategic decisions with ongoing market dynamics. Our analysts track relevent industries related to the Lithuania Recloser Market, allowing our clients with actionable intelligence and reliable forecasts tailored to emerging regional needs.
Yes, we provide customisation as per your requirements. To learn more, feel free to contact us on sales@6wresearch.com
1 Executive Summary |
2 Introduction |
2.1 Key Highlights of the Report |
2.2 Report Description |
2.3 Market Scope & Segmentation |
2.4 Research Methodology |
2.5 Assumptions |
3 Lithuania Recloser Market Overview |
3.1 Lithuania Country Macro Economic Indicators |
3.2 Lithuania Recloser Market Revenues & Volume, 2022 & 2032F |
3.3 Lithuania Recloser Market - Industry Life Cycle |
3.4 Lithuania Recloser Market - Porter's Five Forces |
3.5 Lithuania Recloser Market Revenues & Volume Share, By Phase Type, 2022 & 2032F |
3.6 Lithuania Recloser Market Revenues & Volume Share, By Control Type, 2022 & 2032F |
3.7 Lithuania Recloser Market Revenues & Volume Share, By Voltage Rating, 2022 & 2032F |
4 Lithuania Recloser Market Dynamics |
4.1 Impact Analysis |
4.2 Market Drivers |
4.2.1 Increasing demand for reliable electricity supply in urban and rural areas |
4.2.2 Growing investments in modernizing and upgrading the aging electricity infrastructure |
4.2.3 Government initiatives promoting energy efficiency and grid reliability |
4.3 Market Restraints |
4.3.1 High initial investment costs associated with installing reclosers |
4.3.2 Lack of skilled technicians for maintenance and repair of recloser systems |
4.3.3 Regulatory challenges and delays in obtaining necessary approvals for infrastructure upgrades |
5 Lithuania Recloser Market Trends |
6 Lithuania Recloser Market Segmentations |
6.1 Lithuania Recloser Market, By Phase Type |
6.1.1 Overview and Analysis |
6.1.2 Lithuania Recloser Market Revenues & Volume, By Three Phase, 2022 - 2032F |
6.1.3 Lithuania Recloser Market Revenues & Volume, By Single Phase, 2022 - 2032F |
6.1.4 Lithuania Recloser Market Revenues & Volume, By Triple-single Phase, 2022 - 2032F |
6.2 Lithuania Recloser Market, By Control Type |
6.2.1 Overview and Analysis |
6.2.2 Lithuania Recloser Market Revenues & Volume, By Electronic , 2022 - 2032F |
6.2.3 Lithuania Recloser Market Revenues & Volume, By Hydraulic, 2022 - 2032F |
6.3 Lithuania Recloser Market, By Voltage Rating |
6.3.1 Overview and Analysis |
6.3.2 Lithuania Recloser Market Revenues & Volume, By Up to 15 kV, 2022 - 2032F |
6.3.3 Lithuania Recloser Market Revenues & Volume, By 16-27 kV, 2022 - 2032F |
6.3.4 Lithuania Recloser Market Revenues & Volume, By 28-38 kV, 2022 - 2032F |
7 Lithuania Recloser Market Import-Export Trade Statistics |
7.1 Lithuania Recloser Market Export to Major Countries |
7.2 Lithuania Recloser Market Imports from Major Countries |
8 Lithuania Recloser Market Key Performance Indicators |
8.1 Average time taken for recloser installation and commissioning |
8.2 Frequency of maintenance checks and system downtime |
8.3 Number of grid reliability incidents before and after recloser implementation |
9 Lithuania Recloser Market - Opportunity Assessment |
9.1 Lithuania Recloser Market Opportunity Assessment, By Phase Type, 2022 & 2032F |
9.2 Lithuania Recloser Market Opportunity Assessment, By Control Type, 2022 & 2032F |
9.3 Lithuania Recloser Market Opportunity Assessment, By Voltage Rating, 2022 & 2032F |
10 Lithuania Recloser Market - Competitive Landscape |
10.1 Lithuania Recloser Market Revenue Share, By Companies, 2025 |
10.2 Lithuania Recloser Market Competitive Benchmarking, By Operating and Technical Parameters |
11 Company Profiles |
12 Recommendations | 13 Disclaimer |
Global Go To Market Strategy - 2030
Export potential enables firms to identify high-growth global markets with greater confidence by combining advanced trade intelligence with a structured quantitative methodology. The framework analyzes emerging demand trends and country-level import patterns while integrating macroeconomic and trade datasets such as GDP and population forecasts, bilateral import–export flows, tariff structures, elasticity differentials between developed and developing economies, geographic distance, and import demand projections. Using weighted trade values from 2020–2024 as the base period to project country-to-country export potential for 2030, these inputs are operationalized through calculated drivers such as gravity model parameters, tariff impact factors, and projected GDP per-capita growth. Through an analysis of hidden potentials, demand hotspots, and market conditions that are most favorable to success, this method enables firms to focus on target countries, maximize returns, and global expansion with data, backed by accuracy.
By factoring in the projected importer demand gap that is currently unmet and could be potential opportunity, it identifies the potential for the Exporter (Country) among 190 countries, against the general trade analysis, which identifies the biggest importer or exporter.
To discover high-growth global markets and optimize your business strategy:
Click Here
Pricing
- Single User License$ 1,995
- Department License$ 2,400
- Site License$ 3,120
- Global License$ 3,795

Leadership Perspectives from Industry Events
Search
Thought Leadership and Analyst Meet


Our Clients
6WResearch In News
- Doha a strategic location for EV manufacturing hub: IPA Qatar
- Demand for luxury TVs surging in the GCC, says Samsung
- Empowering Growth: The Thriving Journey of Bangladesh’s Cable Industry
- Demand for luxury TVs surging in the GCC, says Samsung
- Video call with a traditional healer? Once unthinkable, it’s now common in South Africa
- Intelligent Buildings To Smooth GCC’s Path To Net Zero
Latest Reports
- Taiwan Airport Wireless Infrastructure Market (2026-2032)
- Vietnam Airport Wireless Infrastructure Market (2026-2032)
- Thailand Airport Wireless Infrastructure Market (2026-2032)
- South Korea Airport Wireless Infrastructure Market (2026-2032)
- Romania Airport Wireless Infrastructure Market (2026-2032)
- Qatar Airport Wireless Infrastructure Market (2026-2032)
- Philippines Airport Wireless Infrastructure Market (2026-2032)
- Japan Airport Wireless Infrastructure Market (2026-2032)
- Taiwan Airport Winter Services Market (2026-2032)
- Vietnam Airport Winter Services Market (2026-2032)
Industry Events and Analyst Meet

HIMTEX 2026

India Refining Summit 2026

India EV Show 2026

EV tech India Expo 2026

Auto Tech Asia 2026
Whitepaper
- Middle East & Africa Commercial Security Market Click here to view more.
- Middle East & Africa Fire Safety Systems & Equipment Market Click here to view more.
- GCC Drone Market Click here to view more.
- Middle East Lighting Fixture Market Click here to view more.
- GCC Physical & Perimeter Security Market Click here to view more.