Lithuania Ride on Bikes Market (2026-2032) | Growth, Strategic Insights, Competition, Strategy, Competitive, Share, Investment Trends, Pricing Analysis, Drivers, Revenue, Segments, Value, Restraints, Size, Outlook, Trends, Companies, Analysis, Forecast, Demand, Industry, Segmentation, Challenges, Opportunities, Consumer Insights, Supply
Market Forecast By Type (Electric Ride-On Bikes, Pedal Ride-On Bikes, Gas-Powered Ride-On Bikes, Foldable Ride-On Bikes), By Age Group (Kids (3-7 years), Teens (8-14 years), Adults (15+), All Ages), By Power Source (Battery-Powered, Manual, Gasoline-Powered, Hybrid), By Application (Recreational, Sports & Fitness, Adventure & Off-Roading, Commuting) And Competitive Landscape
| Product Code: ETC10448826 | Publication Date: Apr 2025 | Updated Date: Apr 2026 | Product Type: Market Research Report | |
| Publisher: 6Wresearch | Author: Bhawna Singh | No. of Pages: 65 | No. of Figures: 34 | No. of Tables: 19 |
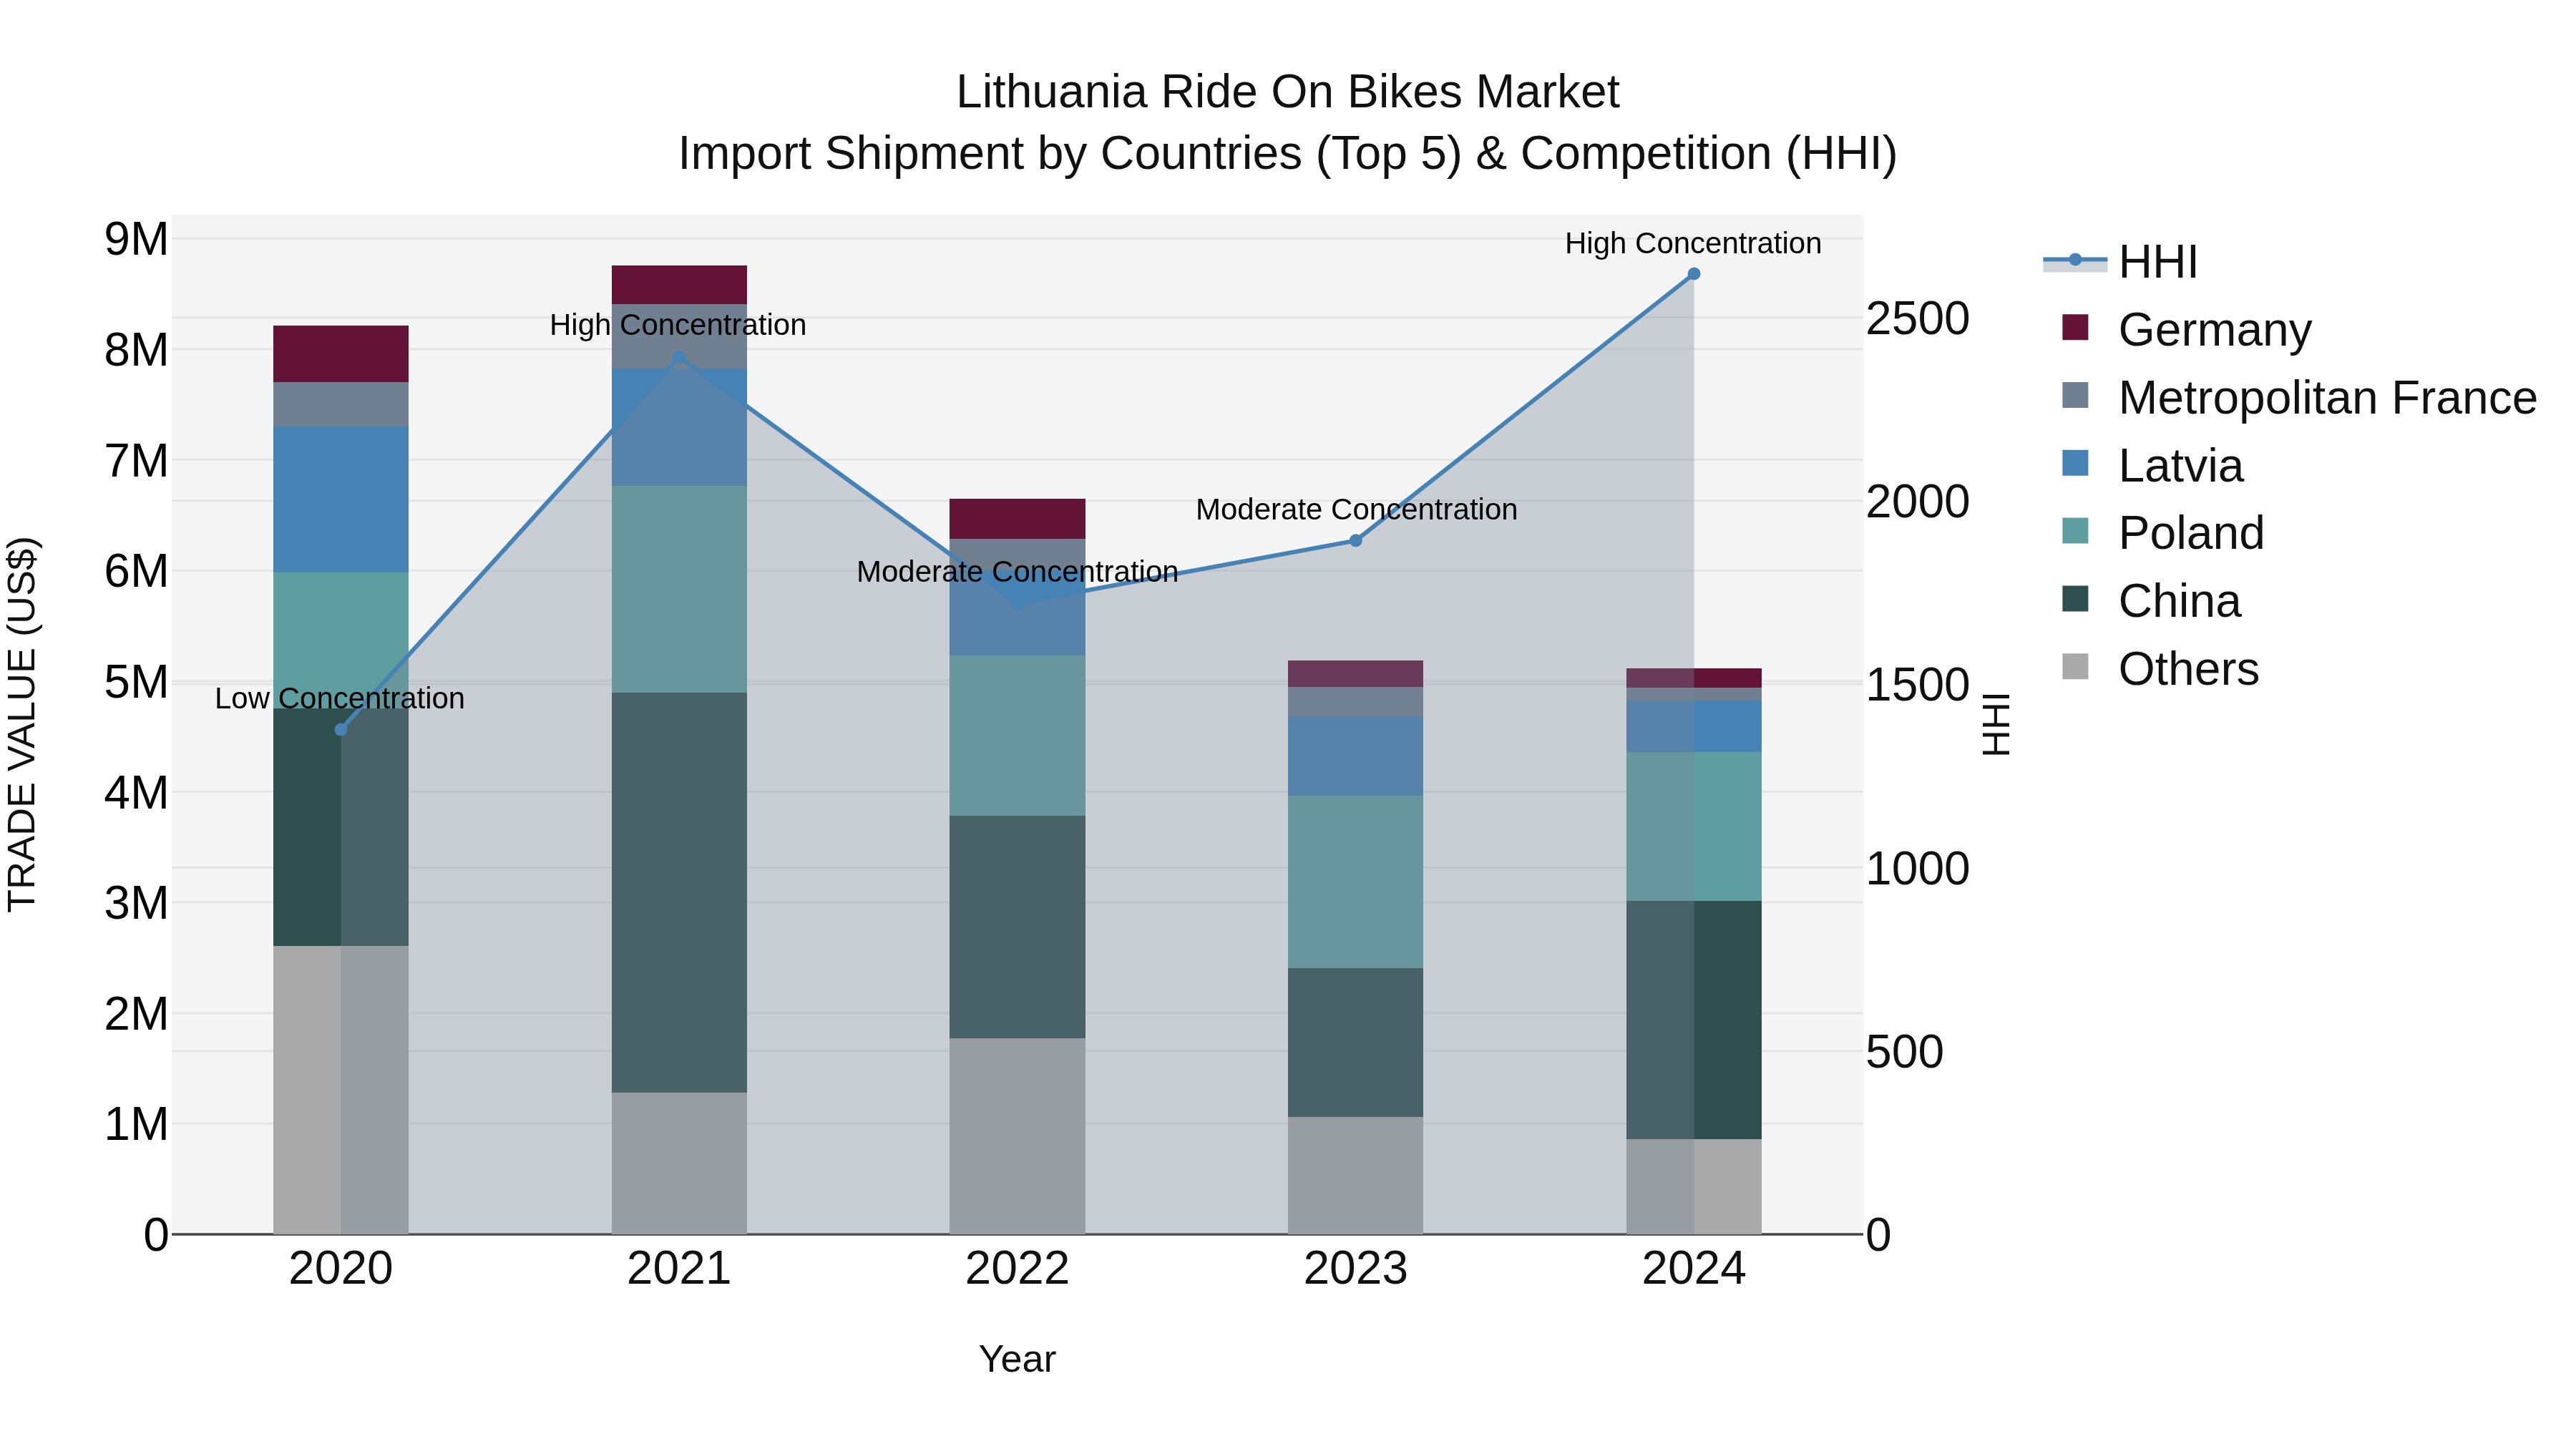
Lithuania Ride on Bikes Market Top 5 Importing Countries and Market Competition (HHI) Analysis
The import shipments of ride-on bikes to Lithuania saw a shift in market concentration from moderate to high in 2024. Top exporting countries include China, Poland, Latvia, Netherlands, and Estonia. Despite a negative Compound Annual Growth Rate (CAGR) of -11.17% from 2020 to 2024, the market experienced a slightly improved growth rate of -1.36% from 2023 to 2024. This suggests a challenging market environment, but the continued presence of key exporting countries indicates ongoing interest and potential opportunities for the industry in Lithuania.
Key Highlights of the Report:
- Lithuania Ride on Bikes Market Outlook
- Market Size of Lithuania Ride on Bikes Market, 2025
- Forecast of Lithuania Ride on Bikes Market, 2032
- Historical Data and Forecast of Lithuania Ride on Bikes Revenues & Volume for the Period 2022 - 2032F
- Lithuania Ride on Bikes Market Trend Evolution
- Lithuania Ride on Bikes Market Drivers and Challenges
- Lithuania Ride on Bikes Price Trends
- Lithuania Ride on Bikes Porter's Five Forces
- Lithuania Ride on Bikes Industry Life Cycle
- Historical Data and Forecast of Lithuania Ride on Bikes Market Revenues & Volume By Type for the Period 2022 - 2032F
- Historical Data and Forecast of Lithuania Ride on Bikes Market Revenues & Volume By Electric Ride-On Bikes for the Period 2022 - 2032F
- Historical Data and Forecast of Lithuania Ride on Bikes Market Revenues & Volume By Pedal Ride-On Bikes for the Period 2022 - 2032F
- Historical Data and Forecast of Lithuania Ride on Bikes Market Revenues & Volume By Gas-Powered Ride-On Bikes for the Period 2022 - 2032F
- Historical Data and Forecast of Lithuania Ride on Bikes Market Revenues & Volume By Foldable Ride-On Bikes for the Period 2022 - 2032F
- Historical Data and Forecast of Lithuania Ride on Bikes Market Revenues & Volume By Age Group for the Period 2022 - 2032F
- Historical Data and Forecast of Lithuania Ride on Bikes Market Revenues & Volume By Kids (3-7 years) for the Period 2022 - 2032F
- Historical Data and Forecast of Lithuania Ride on Bikes Market Revenues & Volume By Teens (8-14 years) for the Period 2022 - 2032F
- Historical Data and Forecast of Lithuania Ride on Bikes Market Revenues & Volume By Adults (15+) for the Period 2022 - 2032F
- Historical Data and Forecast of Lithuania Ride on Bikes Market Revenues & Volume By All Ages for the Period 2022 - 2032F
- Historical Data and Forecast of Lithuania Ride on Bikes Market Revenues & Volume By Power Source for the Period 2022 - 2032F
- Historical Data and Forecast of Lithuania Ride on Bikes Market Revenues & Volume By Battery-Powered for the Period 2022 - 2032F
- Historical Data and Forecast of Lithuania Ride on Bikes Market Revenues & Volume By Manual for the Period 2022 - 2032F
- Historical Data and Forecast of Lithuania Ride on Bikes Market Revenues & Volume By Gasoline-Powered for the Period 2022 - 2032F
- Historical Data and Forecast of Lithuania Ride on Bikes Market Revenues & Volume By Hybrid for the Period 2022 - 2032F
- Historical Data and Forecast of Lithuania Ride on Bikes Market Revenues & Volume By Application for the Period 2022 - 2032F
- Historical Data and Forecast of Lithuania Ride on Bikes Market Revenues & Volume By Recreational for the Period 2022 - 2032F
- Historical Data and Forecast of Lithuania Ride on Bikes Market Revenues & Volume By Sports & Fitness for the Period 2022 - 2032F
- Historical Data and Forecast of Lithuania Ride on Bikes Market Revenues & Volume By Adventure & Off-Roading for the Period 2022 - 2032F
- Historical Data and Forecast of Lithuania Ride on Bikes Market Revenues & Volume By Commuting for the Period 2022 - 2032F
- Lithuania Ride on Bikes Import Export Trade Statistics
- Market Opportunity Assessment By Type
- Market Opportunity Assessment By Age Group
- Market Opportunity Assessment By Power Source
- Market Opportunity Assessment By Application
- Lithuania Ride on Bikes Top Companies Market Share
- Lithuania Ride on Bikes Competitive Benchmarking By Technical and Operational Parameters
- Lithuania Ride on Bikes Company Profiles
- Lithuania Ride on Bikes Key Strategic Recommendations
Frequently Asked Questions About the Market Study (FAQs):
6Wresearch actively monitors the Lithuania Ride on Bikes Market and publishes its comprehensive annual report, highlighting emerging trends, growth drivers, revenue analysis, and forecast outlook. Our insights help businesses to make data-backed strategic decisions with ongoing market dynamics. Our analysts track relevent industries related to the Lithuania Ride on Bikes Market, allowing our clients with actionable intelligence and reliable forecasts tailored to emerging regional needs.
Yes, we provide customisation as per your requirements. To learn more, feel free to contact us on sales@6wresearch.com
1 Executive Summary |
2 Introduction |
2.1 Key Highlights of the Report |
2.2 Report Description |
2.3 Market Scope & Segmentation |
2.4 Research Methodology |
2.5 Assumptions |
3 Lithuania Ride on Bikes Market Overview |
3.1 Lithuania Country Macro Economic Indicators |
3.2 Lithuania Ride on Bikes Market Revenues & Volume, 2022 & 2032F |
3.3 Lithuania Ride on Bikes Market - Industry Life Cycle |
3.4 Lithuania Ride on Bikes Market - Porter's Five Forces |
3.5 Lithuania Ride on Bikes Market Revenues & Volume Share, By Type, 2022 & 2032F |
3.6 Lithuania Ride on Bikes Market Revenues & Volume Share, By Age Group, 2022 & 2032F |
3.7 Lithuania Ride on Bikes Market Revenues & Volume Share, By Power Source, 2022 & 2032F |
3.8 Lithuania Ride on Bikes Market Revenues & Volume Share, By Application, 2022 & 2032F |
4 Lithuania Ride on Bikes Market Dynamics |
4.1 Impact Analysis |
4.2 Market Drivers |
4.2.1 Growing awareness of health and environmental benefits of biking |
4.2.2 Increasing government initiatives to promote cycling as a sustainable mode of transportation |
4.2.3 Rise in urbanization leading to traffic congestion, encouraging the use of bicycles as a convenient mode of commute |
4.3 Market Restraints |
4.3.1 Limited infrastructure and safety concerns for cyclists in Lithuania |
4.3.2 Seasonal weather variations affecting the frequency of bike usage |
4.3.3 Competition from other modes of transportation such as cars and public transport |
5 Lithuania Ride on Bikes Market Trends |
6 Lithuania Ride on Bikes Market, By Types |
6.1 Lithuania Ride on Bikes Market, By Type |
6.1.1 Overview and Analysis |
6.1.2 Lithuania Ride on Bikes Market Revenues & Volume, By Type, 2022 - 2032F |
6.1.3 Lithuania Ride on Bikes Market Revenues & Volume, By Electric Ride-On Bikes, 2022 - 2032F |
6.1.4 Lithuania Ride on Bikes Market Revenues & Volume, By Pedal Ride-On Bikes, 2022 - 2032F |
6.1.5 Lithuania Ride on Bikes Market Revenues & Volume, By Gas-Powered Ride-On Bikes, 2022 - 2032F |
6.1.6 Lithuania Ride on Bikes Market Revenues & Volume, By Foldable Ride-On Bikes, 2022 - 2032F |
6.2 Lithuania Ride on Bikes Market, By Age Group |
6.2.1 Overview and Analysis |
6.2.2 Lithuania Ride on Bikes Market Revenues & Volume, By Kids (3-7 years), 2022 - 2032F |
6.2.3 Lithuania Ride on Bikes Market Revenues & Volume, By Teens (8-14 years), 2022 - 2032F |
6.2.4 Lithuania Ride on Bikes Market Revenues & Volume, By Adults (15+), 2022 - 2032F |
6.2.5 Lithuania Ride on Bikes Market Revenues & Volume, By All Ages, 2022 - 2032F |
6.3 Lithuania Ride on Bikes Market, By Power Source |
6.3.1 Overview and Analysis |
6.3.2 Lithuania Ride on Bikes Market Revenues & Volume, By Battery-Powered, 2022 - 2032F |
6.3.3 Lithuania Ride on Bikes Market Revenues & Volume, By Manual, 2022 - 2032F |
6.3.4 Lithuania Ride on Bikes Market Revenues & Volume, By Gasoline-Powered, 2022 - 2032F |
6.3.5 Lithuania Ride on Bikes Market Revenues & Volume, By Hybrid, 2022 - 2032F |
6.4 Lithuania Ride on Bikes Market, By Application |
6.4.1 Overview and Analysis |
6.4.2 Lithuania Ride on Bikes Market Revenues & Volume, By Recreational, 2022 - 2032F |
6.4.3 Lithuania Ride on Bikes Market Revenues & Volume, By Sports & Fitness, 2022 - 2032F |
6.4.4 Lithuania Ride on Bikes Market Revenues & Volume, By Adventure & Off-Roading, 2022 - 2032F |
6.4.5 Lithuania Ride on Bikes Market Revenues & Volume, By Commuting, 2022 - 2032F |
7 Lithuania Ride on Bikes Market Import-Export Trade Statistics |
7.1 Lithuania Ride on Bikes Market Export to Major Countries |
7.2 Lithuania Ride on Bikes Market Imports from Major Countries |
8 Lithuania Ride on Bikes Market Key Performance Indicators |
8.1 Average daily ridership on bike-sharing platforms |
8.2 Number of dedicated bike lanes and cycling infrastructure projects implemented |
8.3 Participation rate in community cycling events |
9 Lithuania Ride on Bikes Market - Opportunity Assessment |
9.1 Lithuania Ride on Bikes Market Opportunity Assessment, By Type, 2022 & 2032F |
9.2 Lithuania Ride on Bikes Market Opportunity Assessment, By Age Group, 2022 & 2032F |
9.3 Lithuania Ride on Bikes Market Opportunity Assessment, By Power Source, 2022 & 2032F |
9.4 Lithuania Ride on Bikes Market Opportunity Assessment, By Application, 2022 & 2032F |
10 Lithuania Ride on Bikes Market - Competitive Landscape |
10.1 Lithuania Ride on Bikes Market Revenue Share, By Companies, 2025 |
10.2 Lithuania Ride on Bikes Market Competitive Benchmarking, By Operating and Technical Parameters |
11 Company Profiles |
12 Recommendations |
13 Disclaimer |
Global Go To Market Strategy - 2030
Export potential enables firms to identify high-growth global markets with greater confidence by combining advanced trade intelligence with a structured quantitative methodology. The framework analyzes emerging demand trends and country-level import patterns while integrating macroeconomic and trade datasets such as GDP and population forecasts, bilateral import–export flows, tariff structures, elasticity differentials between developed and developing economies, geographic distance, and import demand projections. Using weighted trade values from 2020–2024 as the base period to project country-to-country export potential for 2030, these inputs are operationalized through calculated drivers such as gravity model parameters, tariff impact factors, and projected GDP per-capita growth. Through an analysis of hidden potentials, demand hotspots, and market conditions that are most favorable to success, this method enables firms to focus on target countries, maximize returns, and global expansion with data, backed by accuracy.
By factoring in the projected importer demand gap that is currently unmet and could be potential opportunity, it identifies the potential for the Exporter (Country) among 190 countries, against the general trade analysis, which identifies the biggest importer or exporter.
To discover high-growth global markets and optimize your business strategy:
Click Here
Pricing
- Single User License$ 1,995
- Department License$ 2,400
- Site License$ 3,120
- Global License$ 3,795

Leadership Perspectives from Industry Events
Search
Thought Leadership and Analyst Meet


Our Clients
6WResearch In News
- Doha a strategic location for EV manufacturing hub: IPA Qatar
- Demand for luxury TVs surging in the GCC, says Samsung
- Empowering Growth: The Thriving Journey of Bangladesh’s Cable Industry
- Demand for luxury TVs surging in the GCC, says Samsung
- Video call with a traditional healer? Once unthinkable, it’s now common in South Africa
- Intelligent Buildings To Smooth GCC’s Path To Net Zero
Latest Reports
- New Zealand Aseptic Manufacturing Market (2026-2032)
- Netherlands Aseptic Manufacturing Market (2026-2032)
- Nauru Aseptic Manufacturing Market (2026-2032)
- Namibia Aseptic Manufacturing Market (2026-2032)
- Mozambique Aseptic Manufacturing Market (2026-2032)
- Montenegro Aseptic Manufacturing Market (2026-2032)
- Mongolia Aseptic Manufacturing Market (2026-2032)
- Monaco Aseptic Manufacturing Market (2026-2032)
- Micronesia Aseptic Manufacturing Market (2026-2032)
- Mauritius Aseptic Manufacturing Market (2026-2032)
Industry Events and Analyst Meet

HIMTEX 2026

India Refining Summit 2026

India EV Show 2026

EV tech India Expo 2026

Auto Tech Asia 2026
Whitepaper
- Middle East & Africa Commercial Security Market Click here to view more.
- Middle East & Africa Fire Safety Systems & Equipment Market Click here to view more.
- GCC Drone Market Click here to view more.
- Middle East Lighting Fixture Market Click here to view more.
- GCC Physical & Perimeter Security Market Click here to view more.