Lithuania Signal Generator Market (2026-2032) | Size, Segmentation, Analysis, Value, Trends, Companies, Outlook, Share, Revenue, Industry, Forecast & Growth
Market Forecast By End Users (Telecommunication, Aerospace and Defense, Automotive, Electronics Manufacturing, Healthcare, Other End-user Industries), By Technology (2G, 3G, 5G - 4G), By Product (General Purpose Signal Generator, Special Purpose Signal Generator, Function Generator), By Applications (Designing, Testing, Manufacturing, Troubleshooting, Repairing, Other Applications) And Competitive Landscape
| Product Code: ETC5590961 | Publication Date: Nov 2023 | Updated Date: Mar 2026 | Product Type: Market Research Report | |
| Publisher: 6Wresearch | Author: Ravi Bhandari | No. of Pages: 60 | No. of Figures: 30 | No. of Tables: 5 |
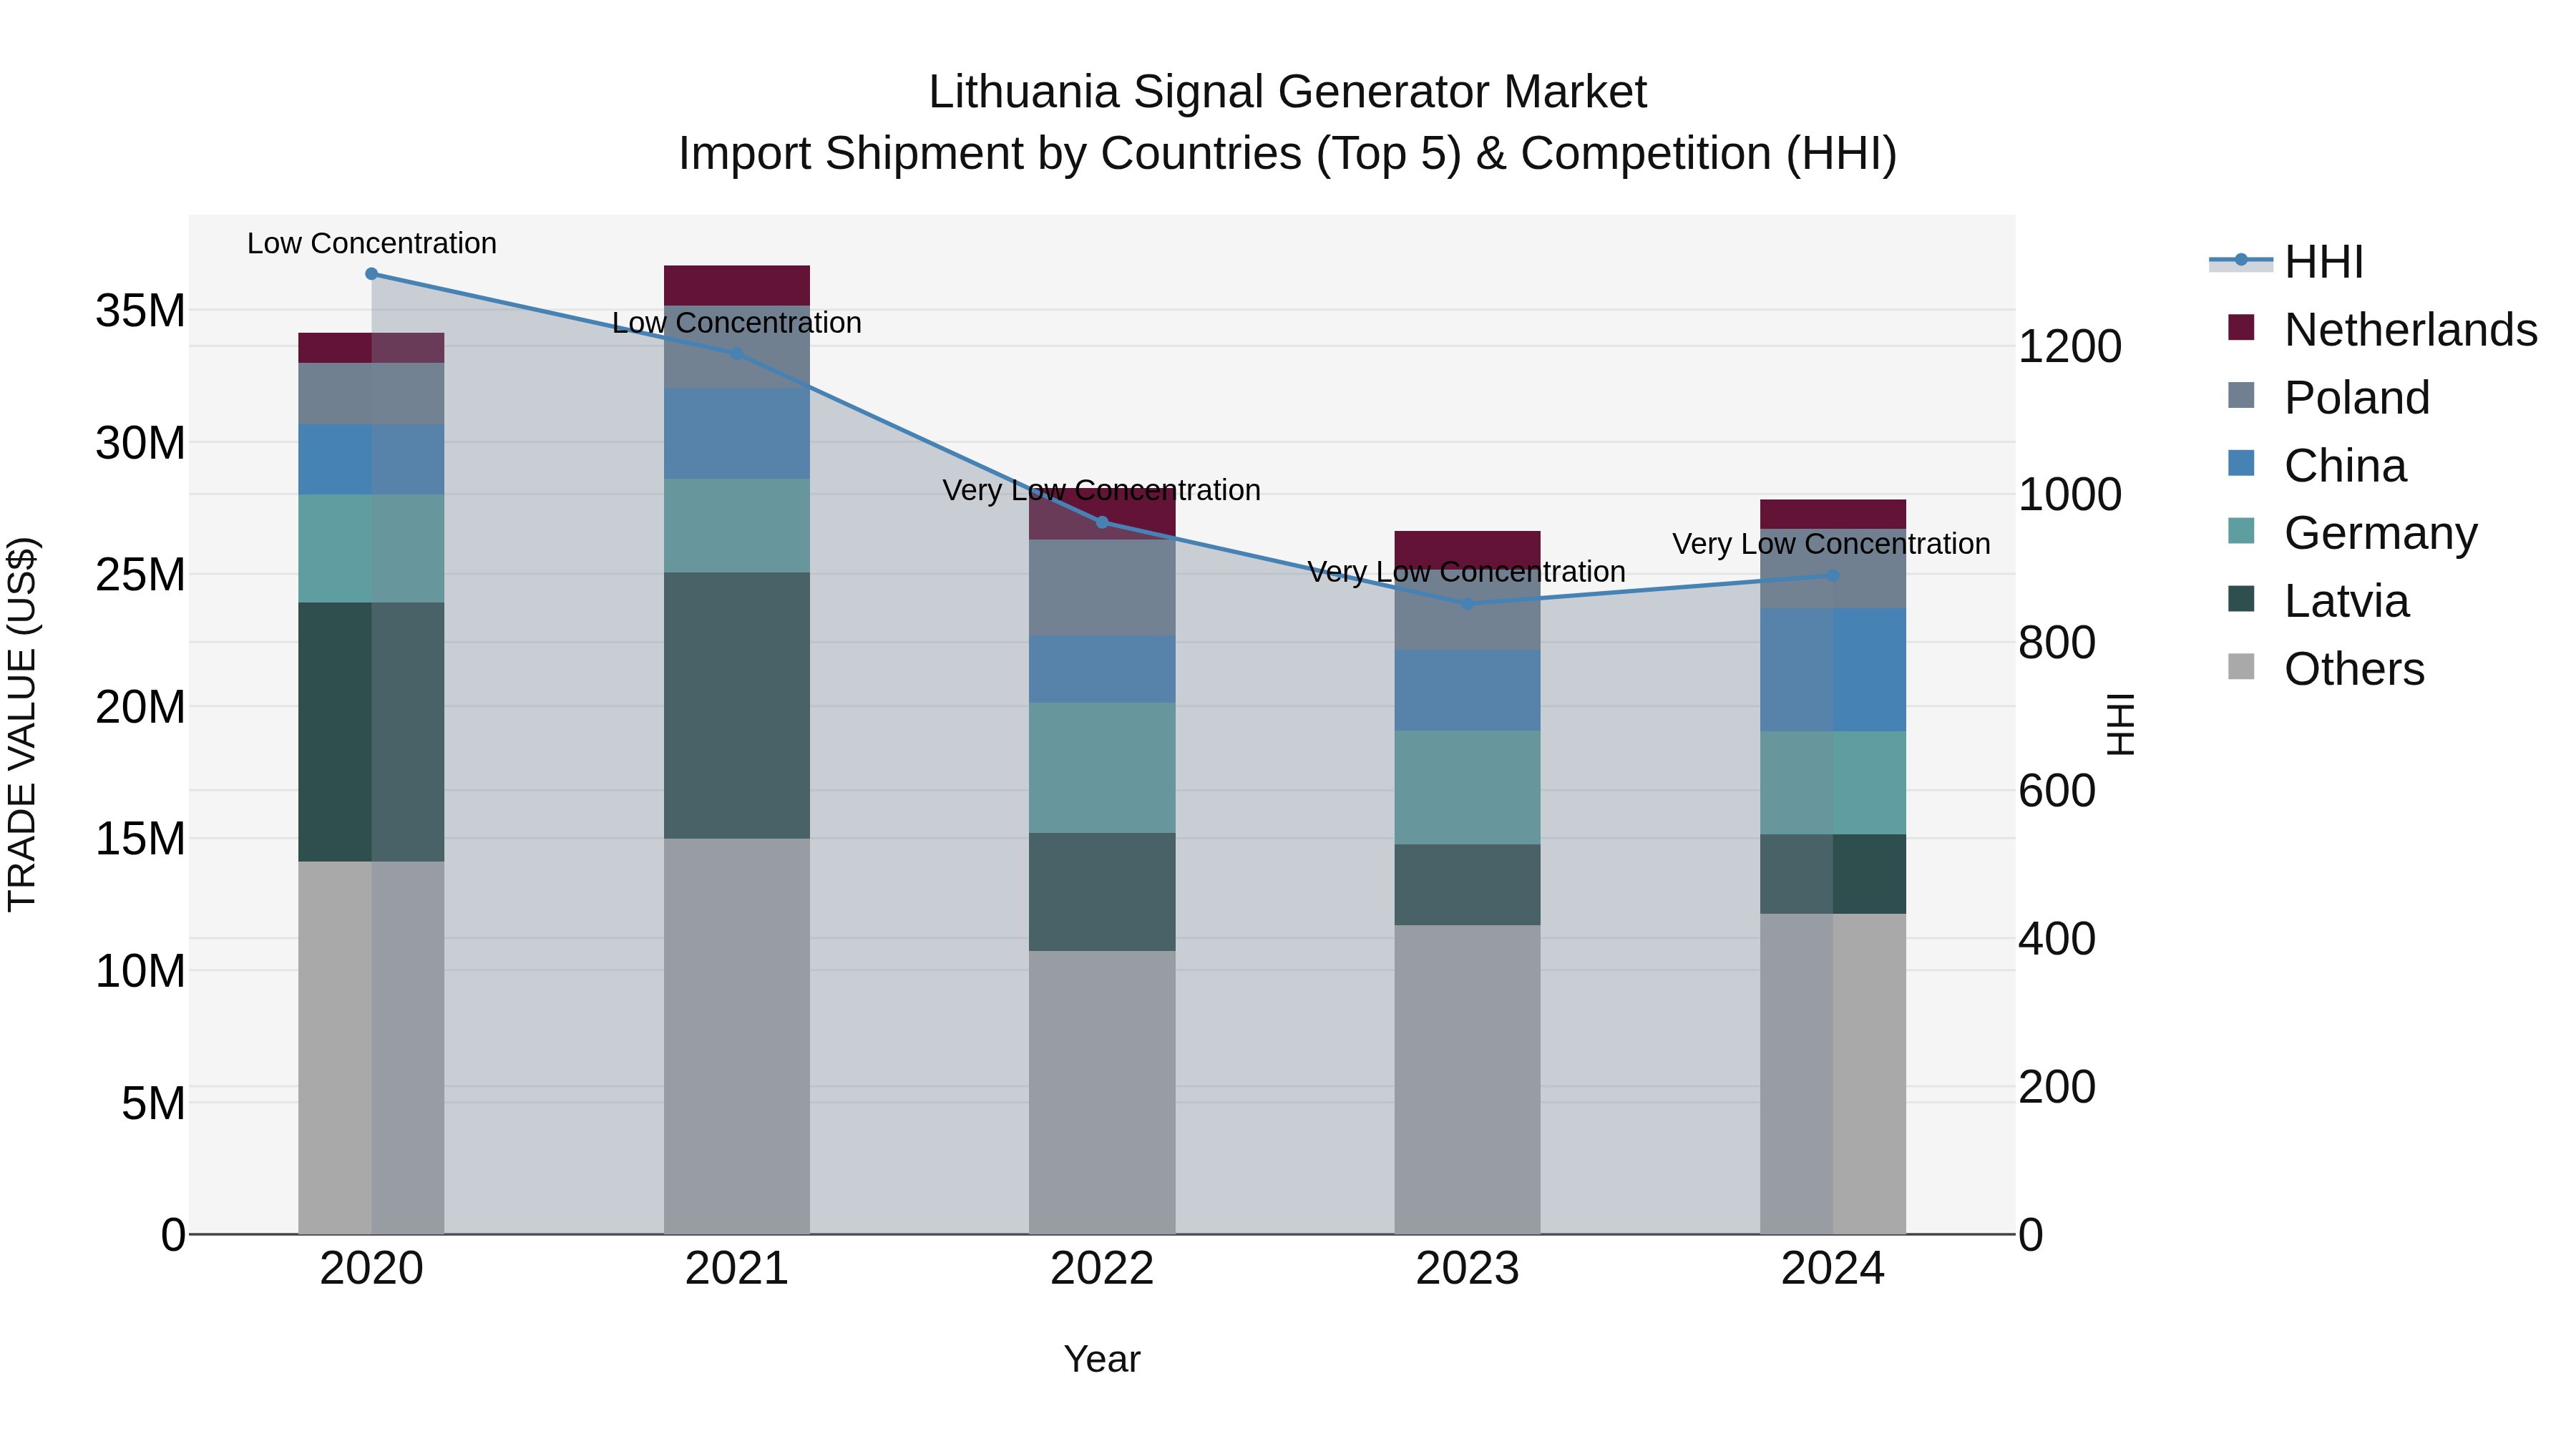
Lithuania Signal Generator Market Top 5 Importing Countries and Market Competition (HHI) Analysis
In 2024, Lithuania continued to import signal generators primarily from China, Germany, Latvia, Poland, and Estonia. The market remained competitive with a low Herfindahl-Hirschman Index (HHI) concentration. Despite a negative Compound Annual Growth Rate (CAGR) of -4.98% from 2020 to 2024, there was a slight positive growth rate of 4.48% from 2023 to 2024. This indicates a potential shift in market dynamics and opportunities for further market expansion in the coming years.
Key Highlights of the Report:
- Lithuania Signal Generator Market Outlook
- Market Size of Lithuania Signal Generator Market, 2025
- Forecast of Lithuania Signal Generator Market, 2032
- Historical Data and Forecast of Lithuania Signal Generator Revenues & Volume for the Period 2022 - 2032F
- Lithuania Signal Generator Market Trend Evolution
- Lithuania Signal Generator Market Drivers and Challenges
- Lithuania Signal Generator Price Trends
- Lithuania Signal Generator Porter`s Five Forces
- Lithuania Signal Generator Industry Life Cycle
- Historical Data and Forecast of Lithuania Signal Generator Market Revenues & Volume By End Users for the Period 2022 - 2032F
- Historical Data and Forecast of Lithuania Signal Generator Market Revenues & Volume By Telecommunication for the Period 2022 - 2032F
- Historical Data and Forecast of Lithuania Signal Generator Market Revenues & Volume By Aerospace and Defense for the Period 2022 - 2032F
- Historical Data and Forecast of Lithuania Signal Generator Market Revenues & Volume By Automotive for the Period 2022 - 2032F
- Historical Data and Forecast of Lithuania Signal Generator Market Revenues & Volume By Electronics Manufacturing for the Period 2022 - 2032F
- Historical Data and Forecast of Lithuania Signal Generator Market Revenues & Volume By Healthcare for the Period 2022 - 2032F
- Historical Data and Forecast of Lithuania Signal Generator Market Revenues & Volume By Other End-user Industries for the Period 2022 - 2032F
- Historical Data and Forecast of Lithuania Signal Generator Market Revenues & Volume By Technology for the Period 2022 - 2032F
- Historical Data and Forecast of Lithuania Signal Generator Market Revenues & Volume By 2G for the Period 2022 - 2032F
- Historical Data and Forecast of Lithuania Signal Generator Market Revenues & Volume By 3G for the Period 2022 - 2032F
- Historical Data and Forecast of Lithuania Signal Generator Market Revenues & Volume By 5G - 4G for the Period 2022 - 2032F
- Historical Data and Forecast of Lithuania Signal Generator Market Revenues & Volume By Product for the Period 2022 - 2032F
- Historical Data and Forecast of Lithuania Signal Generator Market Revenues & Volume By General Purpose Signal Generator for the Period 2022 - 2032F
- Historical Data and Forecast of Lithuania Signal Generator Market Revenues & Volume By Special Purpose Signal Generator for the Period 2022 - 2032F
- Historical Data and Forecast of Lithuania Signal Generator Market Revenues & Volume By Function Generator for the Period 2022 - 2032F
- Historical Data and Forecast of Lithuania Signal Generator Market Revenues & Volume By Applications for the Period 2022 - 2032F
- Historical Data and Forecast of Lithuania Signal Generator Market Revenues & Volume By Designing for the Period 2022 - 2032F
- Historical Data and Forecast of Lithuania Signal Generator Market Revenues & Volume By Testing for the Period 2022 - 2032F
- Historical Data and Forecast of Lithuania Signal Generator Market Revenues & Volume By Manufacturing for the Period 2022 - 2032F
- Historical Data and Forecast of Lithuania Signal Generator Market Revenues & Volume By Troubleshooting for the Period 2022 - 2032F
- Historical Data and Forecast of Lithuania Signal Generator Market Revenues & Volume By Repairing for the Period 2022 - 2032F
- Historical Data and Forecast of Lithuania Signal Generator Market Revenues & Volume By Other Applications for the Period 2022 - 2032F
- Lithuania Signal Generator Import Export Trade Statistics
- Market Opportunity Assessment By End Users
- Market Opportunity Assessment By Technology
- Market Opportunity Assessment By Product
- Market Opportunity Assessment By Applications
- Lithuania Signal Generator Top Companies Market Share
- Lithuania Signal Generator Competitive Benchmarking By Technical and Operational Parameters
- Lithuania Signal Generator Company Profiles
- Lithuania Signal Generator Key Strategic Recommendations
Frequently Asked Questions About the Market Study (FAQs):
6Wresearch actively monitors the Lithuania Signal Generator Market and publishes its comprehensive annual report, highlighting emerging trends, growth drivers, revenue analysis, and forecast outlook. Our insights help businesses to make data-backed strategic decisions with ongoing market dynamics. Our analysts track relevent industries related to the Lithuania Signal Generator Market, allowing our clients with actionable intelligence and reliable forecasts tailored to emerging regional needs.
Yes, we provide customisation as per your requirements. To learn more, feel free to contact us on sales@6wresearch.com
1 Executive Summary |
2 Introduction |
2.1 Key Highlights of the Report |
2.2 Report Description |
2.3 Market Scope & Segmentation |
2.4 Research Methodology |
2.5 Assumptions |
3 Lithuania Signal Generator Market Overview |
3.1 Lithuania Country Macro Economic Indicators |
3.2 Lithuania Signal Generator Market Revenues & Volume, 2022 & 2032F |
3.3 Lithuania Signal Generator Market - Industry Life Cycle |
3.4 Lithuania Signal Generator Market - Porter's Five Forces |
3.5 Lithuania Signal Generator Market Revenues & Volume Share, By End Users , 2022 & 2032F |
3.6 Lithuania Signal Generator Market Revenues & Volume Share, By Technology, 2022 & 2032F |
3.7 Lithuania Signal Generator Market Revenues & Volume Share, By Product, 2022 & 2032F |
3.8 Lithuania Signal Generator Market Revenues & Volume Share, By Applications, 2022 & 2032F |
4 Lithuania Signal Generator Market Dynamics |
4.1 Impact Analysis |
4.2 Market Drivers |
4.2.1 Increasing demand for advanced wireless communication technologies |
4.2.2 Growing adoption of Internet of Things (IoT) devices |
4.2.3 Technological advancements in signal generation equipment |
4.2.4 Rise in demand for electronic testing and measurement equipment |
4.2.5 Favorable government initiatives supporting the electronics industry |
4.3 Market Restraints |
4.3.1 High initial investment cost for signal generators |
4.3.2 Limited expertise in handling complex signal generator equipment |
4.3.3 Economic fluctuations impacting purchasing power |
4.3.4 Competition from substitute technologies like software-defined radio |
4.3.5 Regulatory compliance challenges in the electronics sector |
5 Lithuania Signal Generator Market Trends |
6 Lithuania Signal Generator Market Segmentations |
6.1 Lithuania Signal Generator Market, By End Users |
6.1.1 Overview and Analysis |
6.1.2 Lithuania Signal Generator Market Revenues & Volume, By Telecommunication, 2022 - 2032F |
6.1.3 Lithuania Signal Generator Market Revenues & Volume, By Aerospace and Defense, 2022 - 2032F |
6.1.4 Lithuania Signal Generator Market Revenues & Volume, By Automotive, 2022 - 2032F |
6.1.5 Lithuania Signal Generator Market Revenues & Volume, By Electronics Manufacturing, 2022 - 2032F |
6.1.6 Lithuania Signal Generator Market Revenues & Volume, By Healthcare, 2022 - 2032F |
6.1.7 Lithuania Signal Generator Market Revenues & Volume, By Other End-user Industries, 2022 - 2032F |
6.2 Lithuania Signal Generator Market, By Technology |
6.2.1 Overview and Analysis |
6.2.2 Lithuania Signal Generator Market Revenues & Volume, By 2G, 2022 - 2032F |
6.2.3 Lithuania Signal Generator Market Revenues & Volume, By 3G, 2022 - 2032F |
6.2.4 Lithuania Signal Generator Market Revenues & Volume, By 5G - 4G, 2022 - 2032F |
6.3 Lithuania Signal Generator Market, By Product |
6.3.1 Overview and Analysis |
6.3.2 Lithuania Signal Generator Market Revenues & Volume, By General Purpose Signal Generator, 2022 - 2032F |
6.3.3 Lithuania Signal Generator Market Revenues & Volume, By Special Purpose Signal Generator, 2022 - 2032F |
6.3.4 Lithuania Signal Generator Market Revenues & Volume, By Function Generator, 2022 - 2032F |
6.4 Lithuania Signal Generator Market, By Applications |
6.4.1 Overview and Analysis |
6.4.2 Lithuania Signal Generator Market Revenues & Volume, By Designing, 2022 - 2032F |
6.4.3 Lithuania Signal Generator Market Revenues & Volume, By Testing, 2022 - 2032F |
6.4.4 Lithuania Signal Generator Market Revenues & Volume, By Manufacturing, 2022 - 2032F |
6.4.5 Lithuania Signal Generator Market Revenues & Volume, By Troubleshooting, 2022 - 2032F |
6.4.6 Lithuania Signal Generator Market Revenues & Volume, By Repairing, 2022 - 2032F |
6.4.7 Lithuania Signal Generator Market Revenues & Volume, By Other Applications, 2022 - 2032F |
7 Lithuania Signal Generator Market Import-Export Trade Statistics |
7.1 Lithuania Signal Generator Market Export to Major Countries |
7.2 Lithuania Signal Generator Market Imports from Major Countries |
8 Lithuania Signal Generator Market Key Performance Indicators |
8.1 Average selling price (ASP) of signal generators |
8.2 Number of research and development collaborations in signal generator technology |
8.3 Adoption rate of signal generators in emerging industries |
8.4 Rate of product innovation in signal generator market |
8.5 Customer satisfaction scores for signal generator manufacturers |
9 Lithuania Signal Generator Market - Opportunity Assessment |
9.1 Lithuania Signal Generator Market Opportunity Assessment, By End Users , 2022 & 2032F |
9.2 Lithuania Signal Generator Market Opportunity Assessment, By Technology, 2022 & 2032F |
9.3 Lithuania Signal Generator Market Opportunity Assessment, By Product, 2022 & 2032F |
9.4 Lithuania Signal Generator Market Opportunity Assessment, By Applications, 2022 & 2032F |
10 Lithuania Signal Generator Market - Competitive Landscape |
10.1 Lithuania Signal Generator Market Revenue Share, By Companies, 2025 |
10.2 Lithuania Signal Generator Market Competitive Benchmarking, By Operating and Technical Parameters |
11 Company Profiles |
12 Recommendations | 13 Disclaimer |
Global Go To Market Strategy - 2030
Export potential enables firms to identify high-growth global markets with greater confidence by combining advanced trade intelligence with a structured quantitative methodology. The framework analyzes emerging demand trends and country-level import patterns while integrating macroeconomic and trade datasets such as GDP and population forecasts, bilateral import–export flows, tariff structures, elasticity differentials between developed and developing economies, geographic distance, and import demand projections. Using weighted trade values from 2020–2024 as the base period to project country-to-country export potential for 2030, these inputs are operationalized through calculated drivers such as gravity model parameters, tariff impact factors, and projected GDP per-capita growth. Through an analysis of hidden potentials, demand hotspots, and market conditions that are most favorable to success, this method enables firms to focus on target countries, maximize returns, and global expansion with data, backed by accuracy.
By factoring in the projected importer demand gap that is currently unmet and could be potential opportunity, it identifies the potential for the Exporter (Country) among 190 countries, against the general trade analysis, which identifies the biggest importer or exporter.
To discover high-growth global markets and optimize your business strategy:
Click Here
Pricing
- Single User License$ 1,995
- Department License$ 2,400
- Site License$ 3,120
- Global License$ 3,795

Leadership Perspectives from Industry Events
Search
Thought Leadership and Analyst Meet


Our Clients
6WResearch In News
- Doha a strategic location for EV manufacturing hub: IPA Qatar
- Demand for luxury TVs surging in the GCC, says Samsung
- Empowering Growth: The Thriving Journey of Bangladesh’s Cable Industry
- Demand for luxury TVs surging in the GCC, says Samsung
- Video call with a traditional healer? Once unthinkable, it’s now common in South Africa
- Intelligent Buildings To Smooth GCC’s Path To Net Zero
Latest Reports
- Taiwan Airport Wireless Infrastructure Market (2026-2032)
- Vietnam Airport Wireless Infrastructure Market (2026-2032)
- Thailand Airport Wireless Infrastructure Market (2026-2032)
- South Korea Airport Wireless Infrastructure Market (2026-2032)
- Romania Airport Wireless Infrastructure Market (2026-2032)
- Qatar Airport Wireless Infrastructure Market (2026-2032)
- Philippines Airport Wireless Infrastructure Market (2026-2032)
- Japan Airport Wireless Infrastructure Market (2026-2032)
- Taiwan Airport Winter Services Market (2026-2032)
- Vietnam Airport Winter Services Market (2026-2032)
Industry Events and Analyst Meet

HIMTEX 2026

India Refining Summit 2026

India EV Show 2026

EV tech India Expo 2026

Auto Tech Asia 2026
Whitepaper
- Middle East & Africa Commercial Security Market Click here to view more.
- Middle East & Africa Fire Safety Systems & Equipment Market Click here to view more.
- GCC Drone Market Click here to view more.
- Middle East Lighting Fixture Market Click here to view more.
- GCC Physical & Perimeter Security Market Click here to view more.