Lithuania Soybean Meal Market (2026-2032) | Segmentation, Revenue, Industry, Size, Companies, Share, Forecast, Trends, Outlook, Value, Analysis & Growth
Market Forecast By Application (Animal Feed, Food Industry, Beverage, Healthcare Products) And Competitive Landscape
| Product Code: ETC4993278 | Publication Date: Nov 2023 | Updated Date: Apr 2026 | Product Type: Market Research Report | |
| Publisher: 6Wresearch | Author: Shubham Padhi | No. of Pages: 60 | No. of Figures: 30 | No. of Tables: 5 |
Lithuania Soybean Meal Market Size (2020-2030)
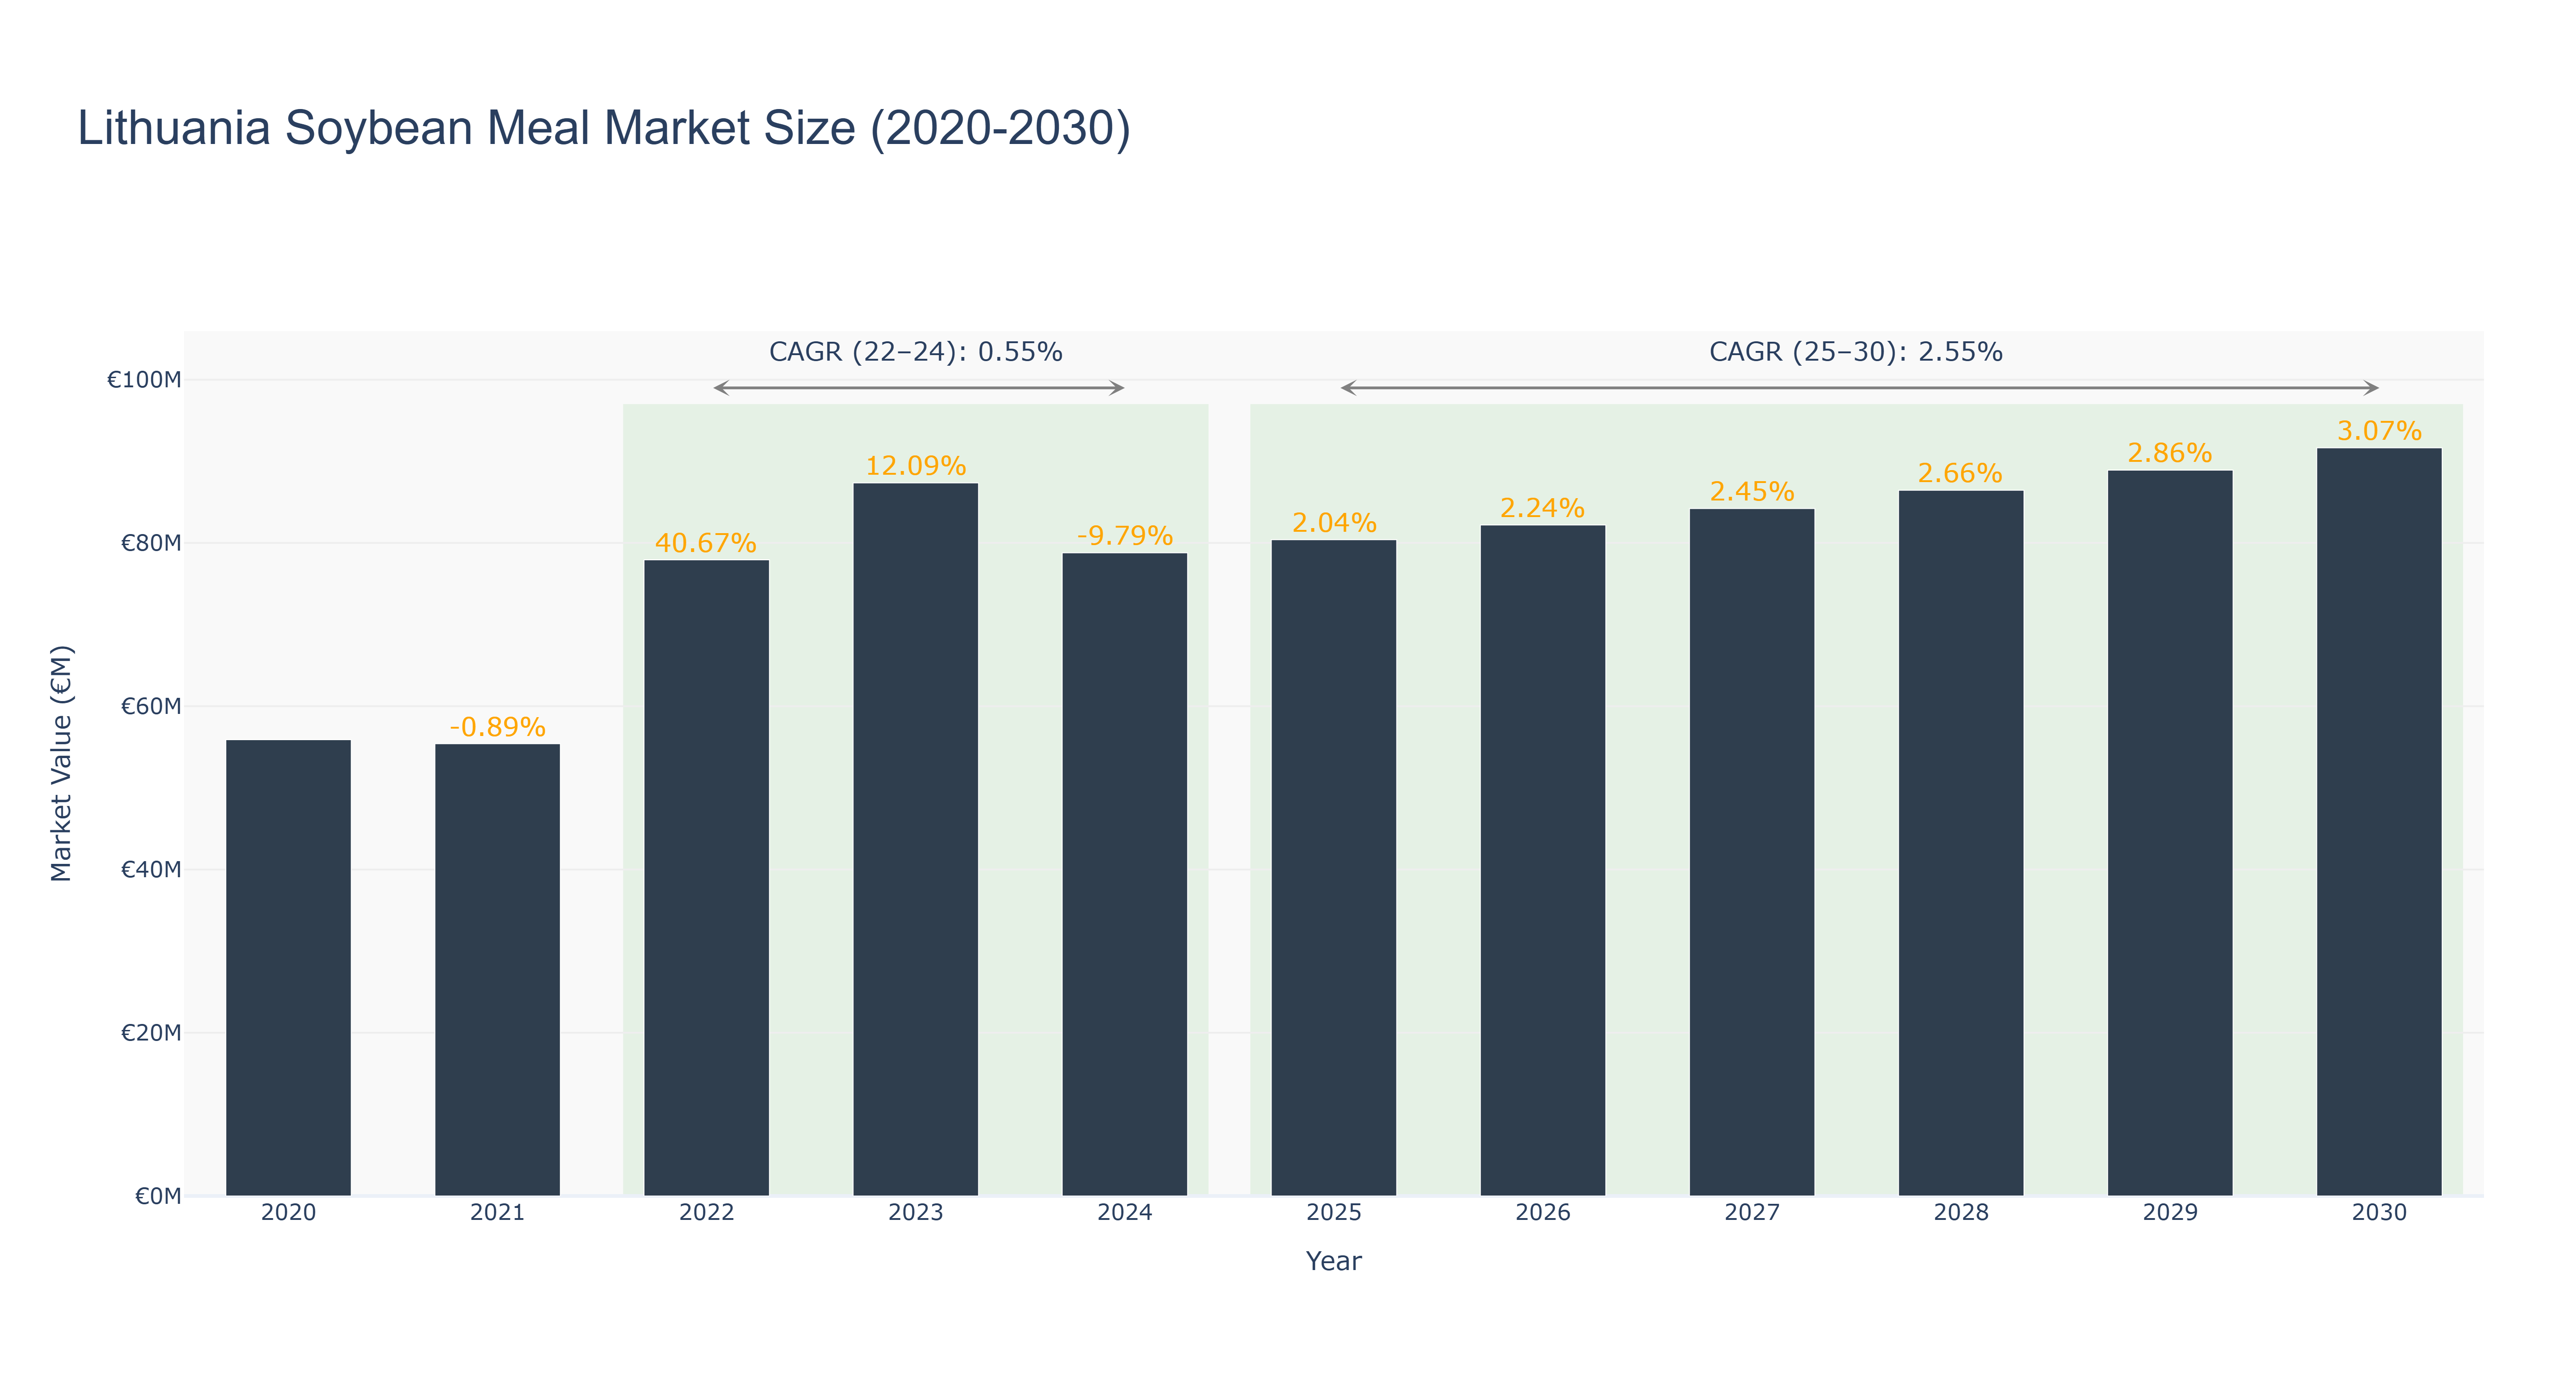
The Lithuania Soybean Meal Market has shown a fluctuating trend over the years. The peak market size of €91.66 million was reached in 2030. From 2020 to 2024, the actual market size experienced fluctuations, starting at €55.90 million in 2020, reaching a low of €78.80 million in 2024. However, a positive growth trajectory is forecasted from 2025 to 2030, with an expected market size of €88.93 million in 2029 and €91.66 million in 2030. The market experienced a significant growth rate of 40.67% in 2022, attributed to increased demand for soybean meal products. The subsequent decline in 2024 could be due to external factors affecting the agricultural industry. Looking ahead, Lithuania is set to implement sustainable farming practices in the soybean industry, aiming to boost production efficiency and meet growing consumer demands.
Lithuania Soybean Meal Market: Production & Trade Performance (2019-2025)
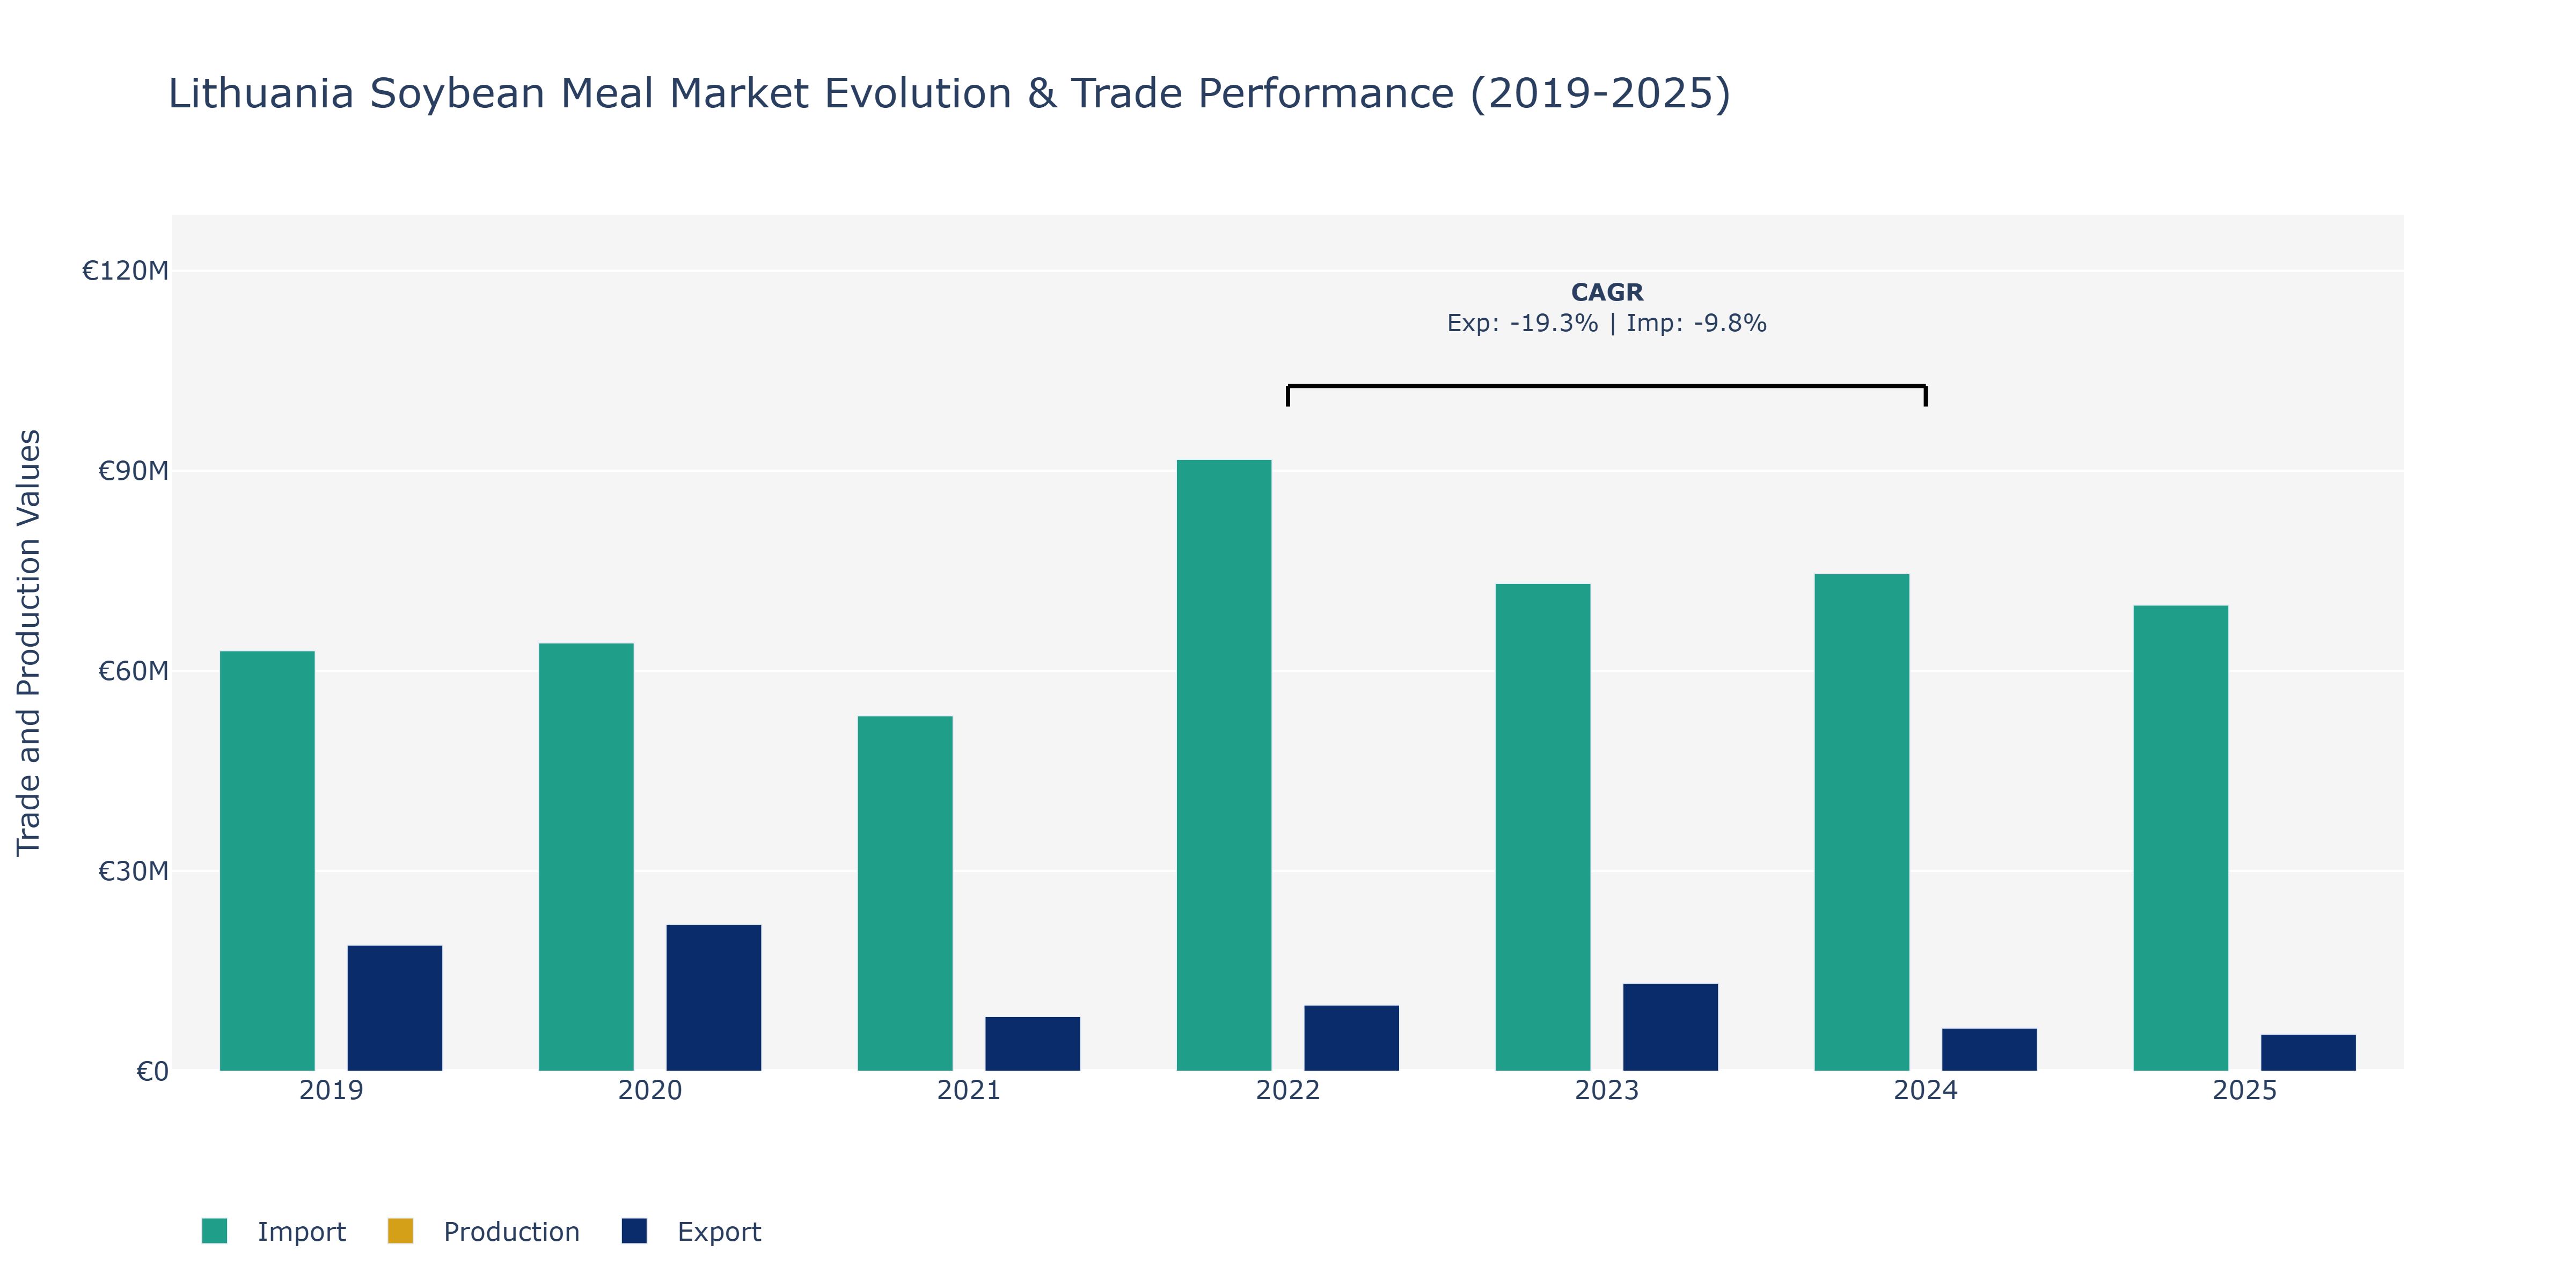
In the Lithuania Soybean Meal Market, significant fluctuations are observed in exports, imports, and production. In 2019, both exports (€18.9 million) and imports (€63.03 million) started at relatively high levels, indicating a robust market. However, a notable decline in 2021 saw exports plummet to €8.2 million, potentially influenced by global trade dynamics or domestic production challenges. Imports also decreased to €53.28 million, suggesting shifting supply chains or economic factors. In subsequent years, exports and imports displayed mixed trends with varying peaks and troughs, potentially affected by currency fluctuations, trade agreements, or changes in international demand for soybean meal products. The market's resilience amid trade uncertainties underscores the sector's adaptability. Additional research on global soybean meal consumption patterns and trade policies could provide further insights into Lithuania's market dynamics.
Key Highlights of the Report:
- Lithuania Soybean Meal Market Outlook
- Market Size of Lithuania Soybean Meal Market, 2025
- Forecast of Lithuania Soybean Meal Market, 2032
- Historical Data and Forecast of Lithuania Soybean Meal Revenues & Volume for the Period 2022 - 2032F
- Lithuania Soybean Meal Market Trend Evolution
- Lithuania Soybean Meal Market Drivers and Challenges
- Lithuania Soybean Meal Price Trends
- Lithuania Soybean Meal Porter`s Five Forces
- Lithuania Soybean Meal Industry Life Cycle
- Historical Data and Forecast of Lithuania Soybean Meal Market Revenues & Volume By Application for the Period 2022 - 2032F
- Historical Data and Forecast of Lithuania Soybean Meal Market Revenues & Volume By Animal Feed for the Period 2022 - 2032F
- Historical Data and Forecast of Lithuania Soybean Meal Market Revenues & Volume By Food Industry for the Period 2022 - 2032F
- Historical Data and Forecast of Lithuania Soybean Meal Market Revenues & Volume By Beverage for the Period 2022 - 2032F
- Historical Data and Forecast of Lithuania Soybean Meal Market Revenues & Volume By Healthcare Products for the Period 2022 - 2032F
- Lithuania Soybean Meal Import Export Trade Statistics
- Market Opportunity Assessment By Application
- Lithuania Soybean Meal Top Companies Market Share
- Lithuania Soybean Meal Competitive Benchmarking By Technical and Operational Parameters
- Lithuania Soybean Meal Company Profiles
- Lithuania Soybean Meal Key Strategic Recommendations
Frequently Asked Questions About the Market Study (FAQs):
6Wresearch actively monitors the Lithuania Soybean Meal Market and publishes its comprehensive annual report, highlighting emerging trends, growth drivers, revenue analysis, and forecast outlook. Our insights help businesses to make data-backed strategic decisions with ongoing market dynamics. Our analysts track relevent industries related to the Lithuania Soybean Meal Market, allowing our clients with actionable intelligence and reliable forecasts tailored to emerging regional needs.
Yes, we provide customisation as per your requirements. To learn more, feel free to contact us on sales@6wresearch.com
1 Executive Summary |
2 Introduction |
2.1 Key Highlights of the Report |
2.2 Report Description |
2.3 Market Scope & Segmentation |
2.4 Research Methodology |
2.5 Assumptions |
3 Lithuania Soybean Meal Market Overview |
3.1 Lithuania Country Macro Economic Indicators |
3.2 Lithuania Soybean Meal Market Revenues & Volume, 2022 & 2032F |
3.3 Lithuania Soybean Meal Market - Industry Life Cycle |
3.4 Lithuania Soybean Meal Market - Porter's Five Forces |
3.5 Lithuania Soybean Meal Market Revenues & Volume Share, By Application, 2022 & 2032F |
4 Lithuania Soybean Meal Market Dynamics |
4.1 Impact Analysis |
4.2 Market Drivers |
4.2.1 Increasing demand for protein-rich animal feed in Lithuania |
4.2.2 Growing awareness about the nutritional benefits of soybean meal |
4.2.3 Favorable government policies supporting the agriculture sector in Lithuania |
4.3 Market Restraints |
4.3.1 Fluctuations in soybean prices in the global market |
4.3.2 Competition from alternative protein sources |
4.3.3 Environmental concerns related to soybean cultivation |
5 Lithuania Soybean Meal Market Trends |
6 Lithuania Soybean Meal Market Segmentations |
6.1 Lithuania Soybean Meal Market, By Application |
6.1.1 Overview and Analysis |
6.1.2 Lithuania Soybean Meal Market Revenues & Volume, By Animal Feed, 2022 - 2032F |
6.1.3 Lithuania Soybean Meal Market Revenues & Volume, By Food Industry, 2022 - 2032F |
6.1.4 Lithuania Soybean Meal Market Revenues & Volume, By Beverage, 2022 - 2032F |
6.1.5 Lithuania Soybean Meal Market Revenues & Volume, By Healthcare Products, 2022 - 2032F |
7 Lithuania Soybean Meal Market Import-Export Trade Statistics |
7.1 Lithuania Soybean Meal Market Export to Major Countries |
7.2 Lithuania Soybean Meal Market Imports from Major Countries |
8 Lithuania Soybean Meal Market Key Performance Indicators |
8.1 Average selling price of soybean meal in Lithuania |
8.2 Import/export volume of soybean meal in Lithuania |
8.3 Adoption rate of soybean meal in animal feed formulations in Lithuania |
8.4 Number of new product launches incorporating soybean meal in the Lithuanian market |
8.5 Sustainability practices adopted by soybean meal manufacturers in Lithuania |
9 Lithuania Soybean Meal Market - Opportunity Assessment |
9.1 Lithuania Soybean Meal Market Opportunity Assessment, By Application, 2022 & 2032F |
10 Lithuania Soybean Meal Market - Competitive Landscape |
10.1 Lithuania Soybean Meal Market Revenue Share, By Companies, 2025 |
10.2 Lithuania Soybean Meal Market Competitive Benchmarking, By Operating and Technical Parameters |
11 Company Profiles |
12 Recommendations | 13 Disclaimer |
Export potential assessment - trade Analytics for 2030
Export potential enables firms to identify high-growth global markets with greater confidence by combining advanced trade intelligence with a structured quantitative methodology. The framework analyzes emerging demand trends and country-level import patterns while integrating macroeconomic and trade datasets such as GDP and population forecasts, bilateral import–export flows, tariff structures, elasticity differentials between developed and developing economies, geographic distance, and import demand projections. Using weighted trade values from 2020–2024 as the base period to project country-to-country export potential for 2030, these inputs are operationalized through calculated drivers such as gravity model parameters, tariff impact factors, and projected GDP per-capita growth. Through an analysis of hidden potentials, demand hotspots, and market conditions that are most favorable to success, this method enables firms to focus on target countries, maximize returns, and global expansion with data, backed by accuracy.
By factoring in the projected importer demand gap that is currently unmet and could be potential opportunity, it identifies the potential for the Exporter (Country) among 190 countries, against the general trade analysis, which identifies the biggest importer or exporter.
To discover high-growth global markets and optimize your business strategy:
Click Here
Pricing
- Single User License$ 1,995
- Department License$ 2,400
- Site License$ 3,120
- Global License$ 3,795

Thought Leadership
Search
Thought Leadership and Analyst Meet


Our Clients
Latest Reports
- New Zealand Aseptic Manufacturing Market (2026-2032)
- Netherlands Aseptic Manufacturing Market (2026-2032)
- Nauru Aseptic Manufacturing Market (2026-2032)
- Namibia Aseptic Manufacturing Market (2026-2032)
- Mozambique Aseptic Manufacturing Market (2026-2032)
- Montenegro Aseptic Manufacturing Market (2026-2032)
- Mongolia Aseptic Manufacturing Market (2026-2032)
- Monaco Aseptic Manufacturing Market (2026-2032)
- Micronesia Aseptic Manufacturing Market (2026-2032)
- Mauritius Aseptic Manufacturing Market (2026-2032)
Industry Events and Analyst Meet

HIMTEX 2026

India Refining Summit 2026

India EV Show 2026

EV tech India Expo 2026

Auto Tech Asia 2026
Whitepaper
- Middle East & Africa Commercial Security Market Click here to view more.
- Middle East & Africa Fire Safety Systems & Equipment Market Click here to view more.
- GCC Drone Market Click here to view more.
- Middle East Lighting Fixture Market Click here to view more.
- GCC Physical & Perimeter Security Market Click here to view more.
6WResearch In News
- Doha a strategic location for EV manufacturing hub: IPA Qatar
- Demand for luxury TVs surging in the GCC, says Samsung
- Empowering Growth: The Thriving Journey of Bangladesh’s Cable Industry
- Demand for luxury TVs surging in the GCC, says Samsung
- Video call with a traditional healer? Once unthinkable, it’s now common in South Africa
- Intelligent Buildings To Smooth GCC’s Path To Net Zero