Lithuania Stannic Chloride Market (2026-2032) | Share, Trends, Value, Size & Revenue, Growth, Analysis, Outlook, Industry, Segmentation, Forecast, Companies, Competitive Landscape
Market Forecast By Product Form (Liquid, Solid), By Purity of Product (0.99, Others), By Applications (Electronics, Tinplate, Float Glass, Brass & Bronze), By End-User Industry (Polymers, Agriculture, Pharmaceuticals, Electrical & Electronics, Chemical, Other Industrial), By Product (Stannic Chloride Anhydrate, Stannic Chloride Pentahydrate) And Competitive Landscape
| Product Code: ETC8052052 | Publication Date: Sep 2024 | Updated Date: Apr 2026 | Product Type: Market Research Report | |
| Publisher: 6Wresearch | Author: Summon Dutta | No. of Pages: 75 | No. of Figures: 35 | No. of Tables: 20 |
Lithuania Stannic Chloride Market Size (2020-2030)
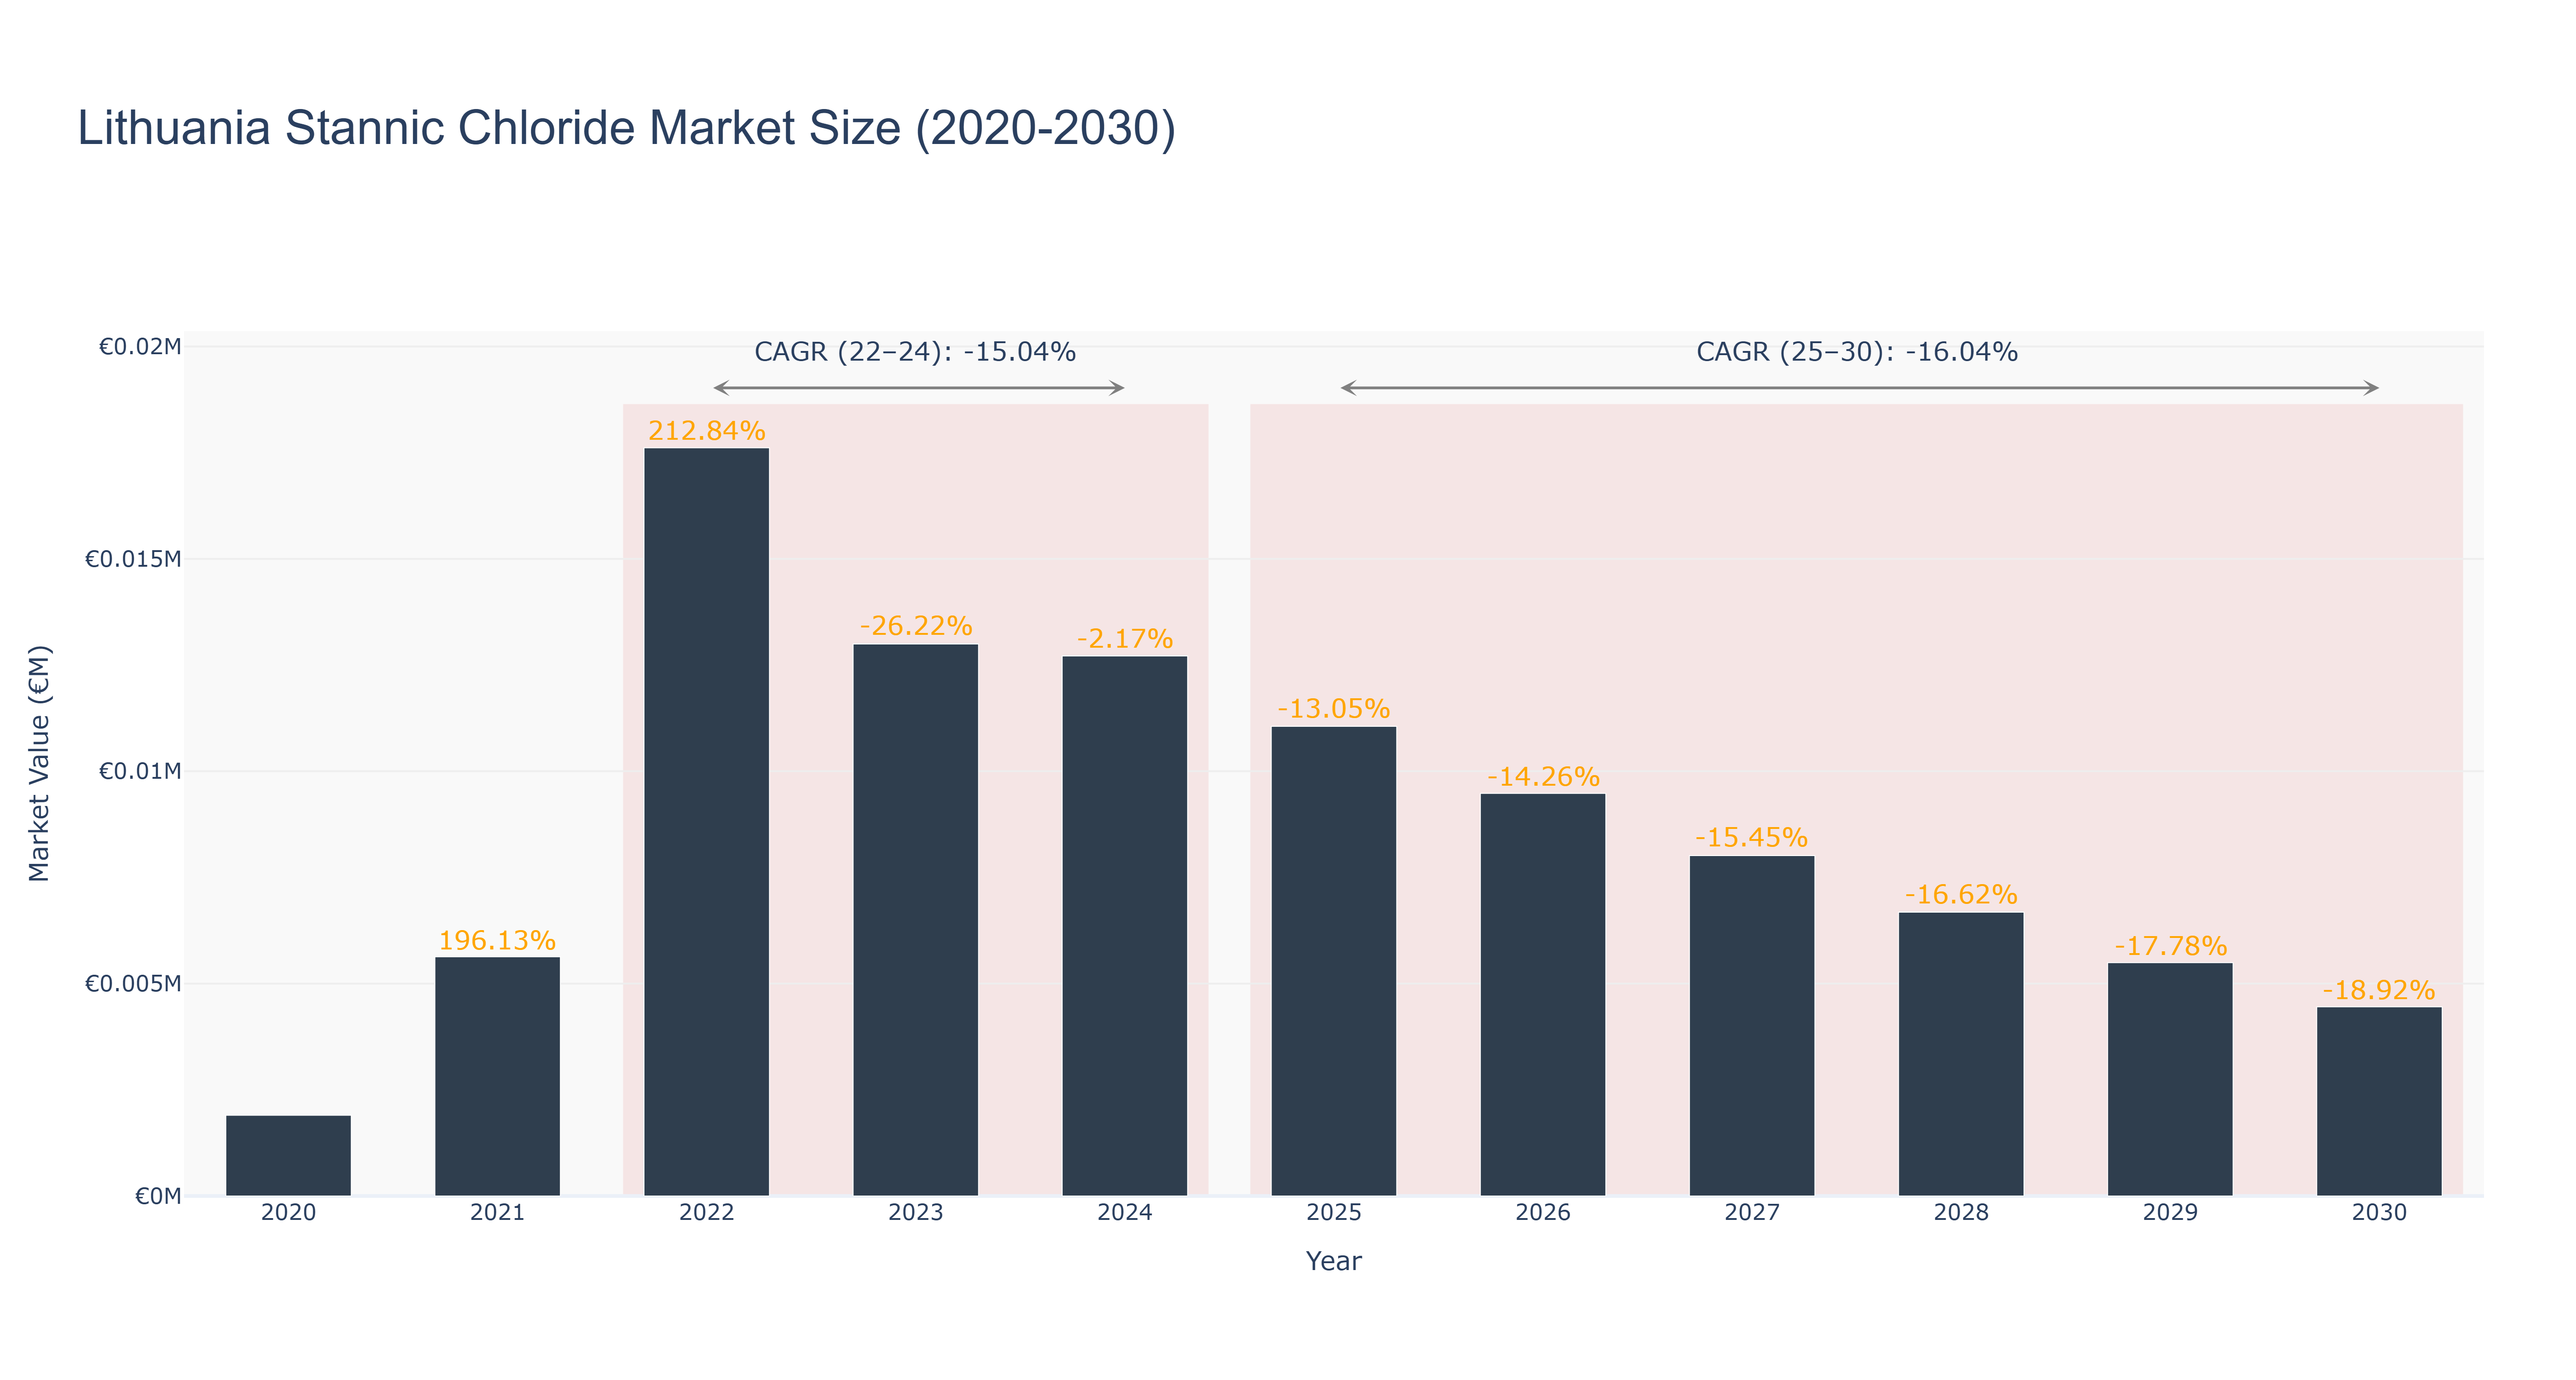
Lithuania Stannic Chloride Market has experienced a fluctuating trend in market size over the past decade. The peak market size of €0.02 million was recorded in 2022, followed by a decline to €0.01 million in 2023 and 2024. The market is forecasted to continue shrinking from 2025 to 2030, with a CAGR of -16.04%. The downward trend can be attributed to factors such as changing consumer preferences, increased competition, and economic uncertainties. However, recent developments in sustainable production methods and partnerships with key industries are expected to drive growth in the near future. These initiatives aim to enhance product quality and expand market reach, positioning Lithuania as a key player in the global stannic chloride market.
Lithuania Stannic Chloride Market: Production & Trade Performance (2019-2025)
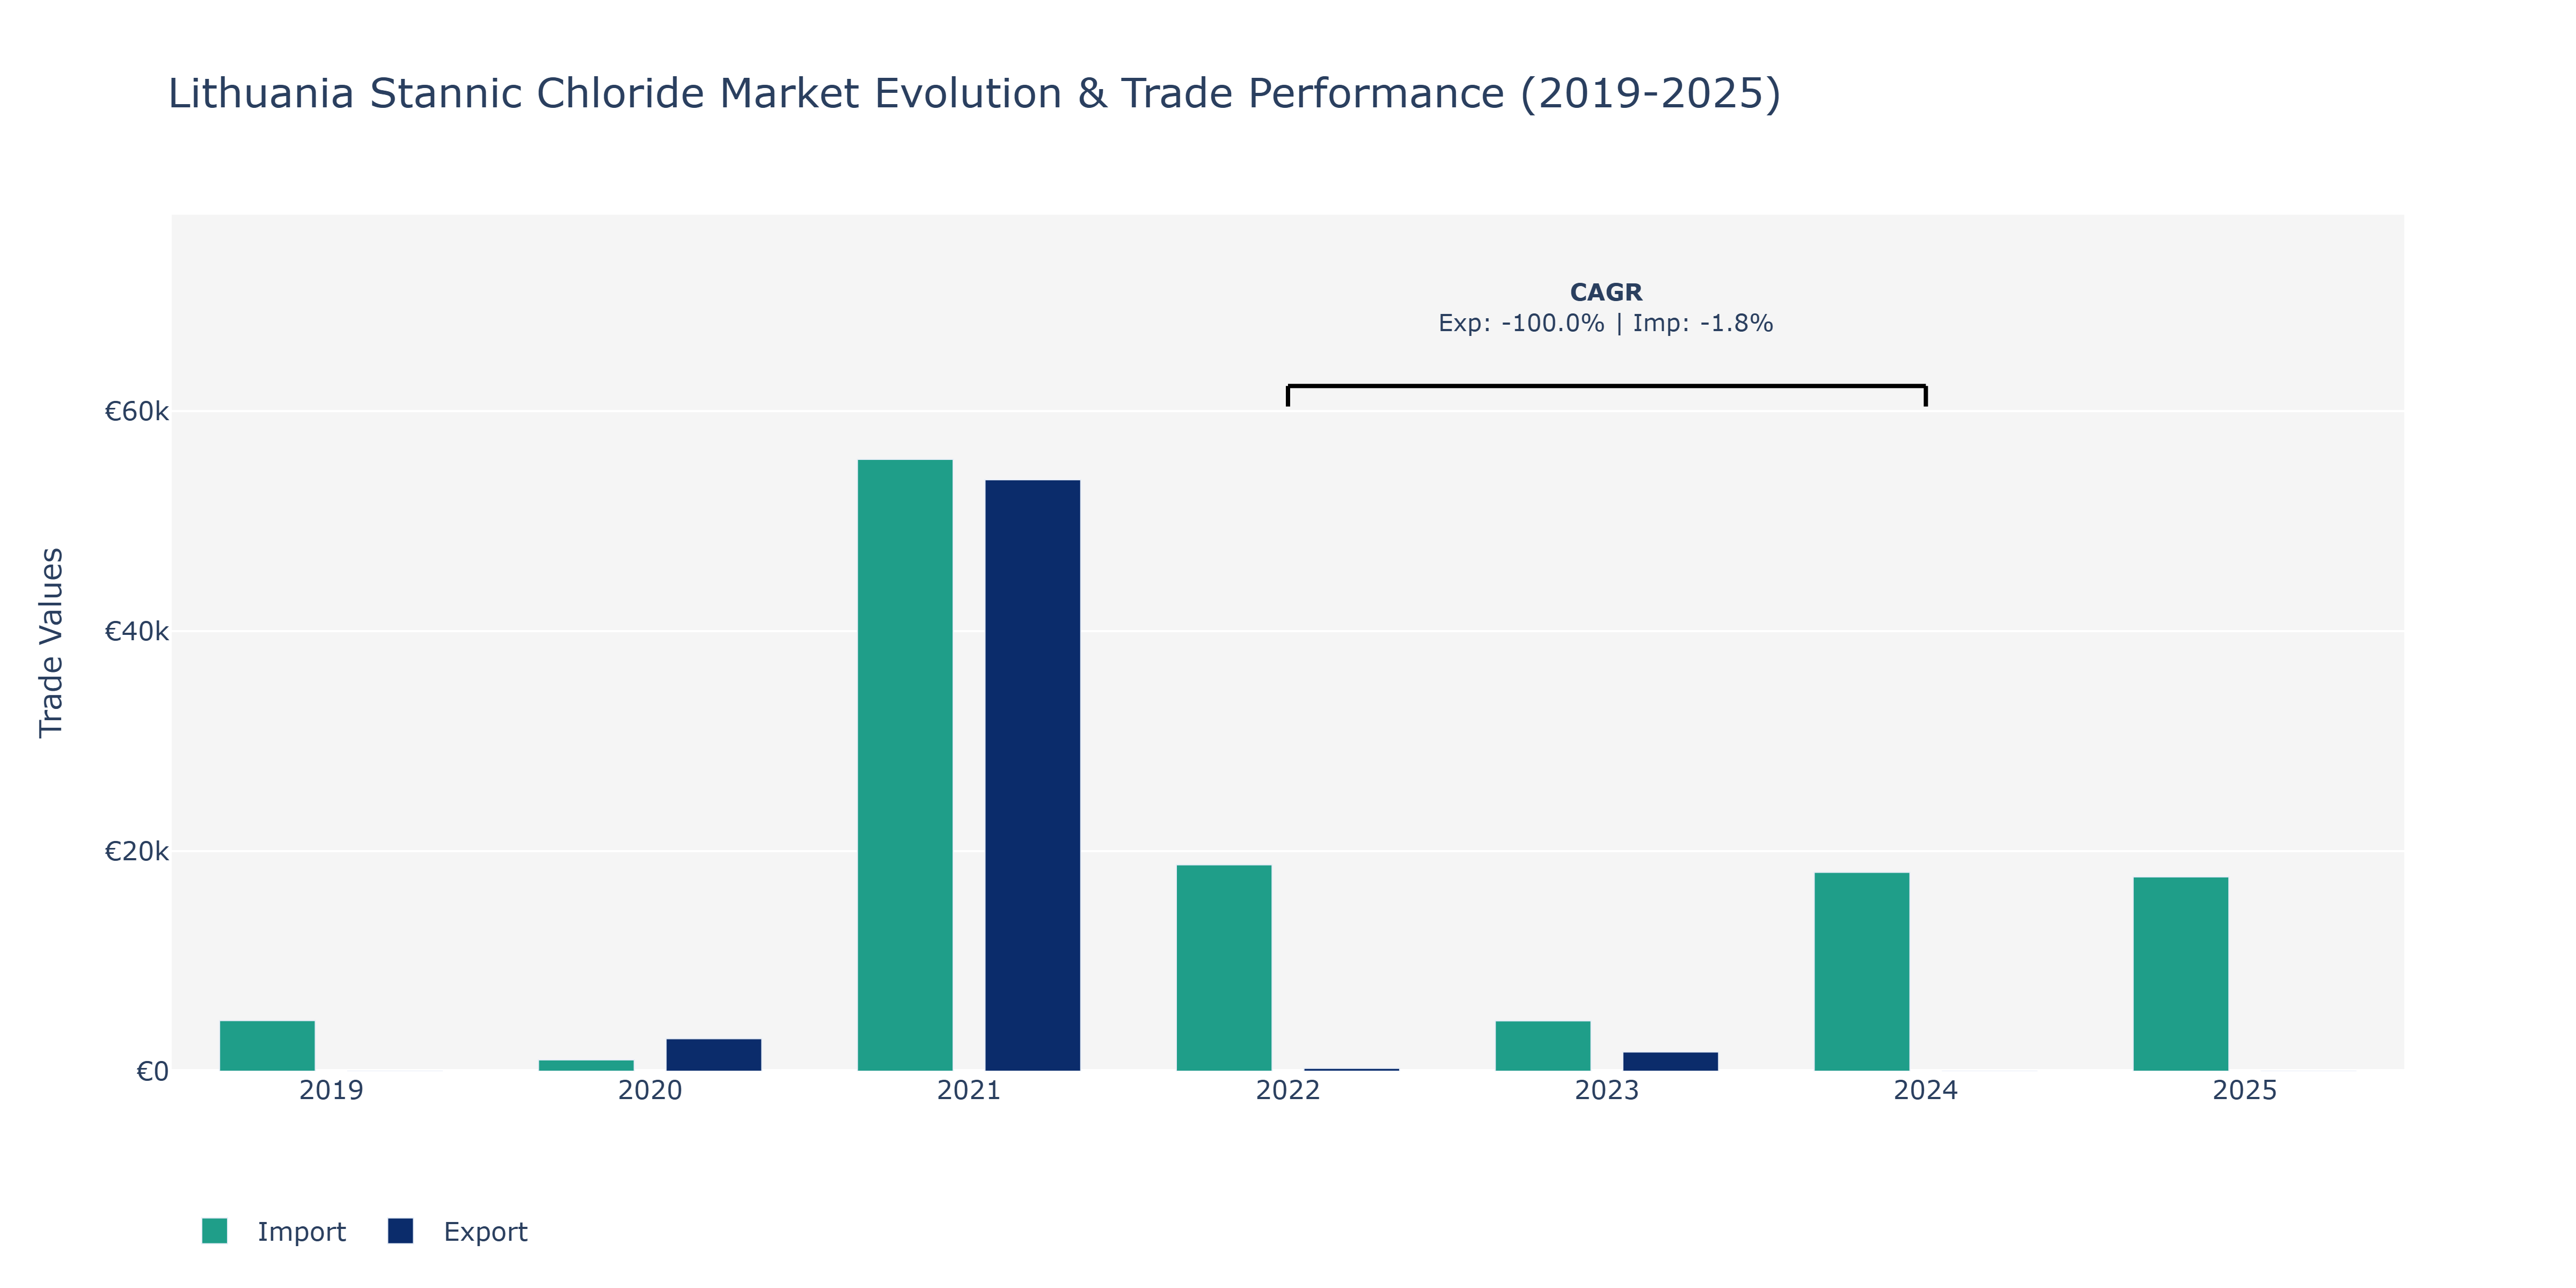
The Lithuania Stannic Chloride Market witnessed notable fluctuations in exports and imports during the period under review. In 2020, exports sharply decreased to €2.95 thousand from the previous year's €4.6 thousand, potentially due to global economic challenges impacting demand. However, in 2021, exports surged significantly to €53.75 thousand, indicating a strong recovery and potentially driven by increased international demand for Stannic Chloride. Imports followed a similar trend, with a decrease in 2020 to €1.02 thousand and a substantial increase in 2021 to €55.61 thousand, suggesting a recovery in domestic consumption or manufacturing activities requiring imports of this chemical. The market experienced a downturn in 2022, with exports and imports decreasing to €255 and €18.75 thousand, respectively, possibly influenced by supply chain disruptions or shifts in market dynamics. The subsequent years showed varying levels of imports. Overall, the market's export and import dynamics reflect a blend of global economic conditions, market demand, and supply chain factors impacting the Lithuania Stannic Chloride Market.
Key Highlights of the Report:
- Lithuania Stannic Chloride Market Outlook
- Market Size of Lithuania Stannic Chloride Market, 2025
- Forecast of Lithuania Stannic Chloride Market, 2032
- Historical Data and Forecast of Lithuania Stannic Chloride Revenues & Volume for the Period 2022 - 2032
- Lithuania Stannic Chloride Market Trend Evolution
- Lithuania Stannic Chloride Market Drivers and Challenges
- Lithuania Stannic Chloride Price Trends
- Lithuania Stannic Chloride Porter's Five Forces
- Lithuania Stannic Chloride Industry Life Cycle
- Historical Data and Forecast of Lithuania Stannic Chloride Market Revenues & Volume By Product Form for the Period 2022 - 2032
- Historical Data and Forecast of Lithuania Stannic Chloride Market Revenues & Volume By Liquid for the Period 2022 - 2032
- Historical Data and Forecast of Lithuania Stannic Chloride Market Revenues & Volume By Solid for the Period 2022 - 2032
- Historical Data and Forecast of Lithuania Stannic Chloride Market Revenues & Volume By Purity of Product for the Period 2022 - 2032
- Historical Data and Forecast of Lithuania Stannic Chloride Market Revenues & Volume By 0.99 for the Period 2022 - 2032
- Historical Data and Forecast of Lithuania Stannic Chloride Market Revenues & Volume By Others for the Period 2022 - 2032
- Historical Data and Forecast of Lithuania Stannic Chloride Market Revenues & Volume By Applications for the Period 2022 - 2032
- Historical Data and Forecast of Lithuania Stannic Chloride Market Revenues & Volume By Electronics for the Period 2022 - 2032
- Historical Data and Forecast of Lithuania Stannic Chloride Market Revenues & Volume By Tinplate for the Period 2022 - 2032
- Historical Data and Forecast of Lithuania Stannic Chloride Market Revenues & Volume By Float Glass for the Period 2022 - 2032
- Historical Data and Forecast of Lithuania Stannic Chloride Market Revenues & Volume By Brass & Bronze for the Period 2022 - 2032
- Historical Data and Forecast of Lithuania Stannic Chloride Market Revenues & Volume By End-User Industry for the Period 2022 - 2032
- Historical Data and Forecast of Lithuania Stannic Chloride Market Revenues & Volume By Polymers for the Period 2022 - 2032
- Historical Data and Forecast of Lithuania Stannic Chloride Market Revenues & Volume By Agriculture for the Period 2022 - 2032
- Historical Data and Forecast of Lithuania Stannic Chloride Market Revenues & Volume By Pharmaceuticals for the Period 2022 - 2032
- Historical Data and Forecast of Lithuania Stannic Chloride Market Revenues & Volume By Electrical & Electronics for the Period 2022 - 2032
- Historical Data and Forecast of Lithuania Stannic Chloride Market Revenues & Volume By Chemical for the Period 2022 - 2032
- Historical Data and Forecast of Lithuania Stannic Chloride Market Revenues & Volume By Other Industrial for the Period 2022 - 2032
- Historical Data and Forecast of Lithuania Stannic Chloride Market Revenues & Volume By Product for the Period 2022 - 2032
- Historical Data and Forecast of Lithuania Stannic Chloride Market Revenues & Volume By Stannic Chloride Anhydrate for the Period 2022 - 2032
- Historical Data and Forecast of Lithuania Stannic Chloride Market Revenues & Volume By Stannic Chloride Pentahydrate for the Period 2022 - 2032
- Lithuania Stannic Chloride Import Export Trade Statistics
- Market Opportunity Assessment By Product Form
- Market Opportunity Assessment By Purity of Product
- Market Opportunity Assessment By Applications
- Market Opportunity Assessment By End-User Industry
- Market Opportunity Assessment By Product
- Lithuania Stannic Chloride Top Companies Market Share
- Lithuania Stannic Chloride Competitive Benchmarking By Technical and Operational Parameters
- Lithuania Stannic Chloride Company Profiles
- Lithuania Stannic Chloride Key Strategic Recommendations
Frequently Asked Questions About the Market Study (FAQs):
6Wresearch actively monitors the Lithuania Stannic Chloride Market and publishes its comprehensive annual report, highlighting emerging trends, growth drivers, revenue analysis, and forecast outlook. Our insights help businesses to make data-backed strategic decisions with ongoing market dynamics. Our analysts track relevent industries related to the Lithuania Stannic Chloride Market, allowing our clients with actionable intelligence and reliable forecasts tailored to emerging regional needs.
Yes, we provide customisation as per your requirements. To learn more, feel free to contact us on sales@6wresearch.com
1 Executive Summary |
2 Introduction |
2.1 Key Highlights of the Report |
2.2 Report Description |
2.3 Market Scope & Segmentation |
2.4 Research Methodology |
2.5 Assumptions |
3 Lithuania Stannic Chloride Market Overview |
3.1 Lithuania Country Macro Economic Indicators |
3.2 Lithuania Stannic Chloride Market Revenues & Volume, 2022 & 2032F |
3.3 Lithuania Stannic Chloride Market - Industry Life Cycle |
3.4 Lithuania Stannic Chloride Market - Porter's Five Forces |
3.5 Lithuania Stannic Chloride Market Revenues & Volume Share, By Product Form, 2022 & 2032F |
3.6 Lithuania Stannic Chloride Market Revenues & Volume Share, By Purity of Product, 2022 & 2032F |
3.7 Lithuania Stannic Chloride Market Revenues & Volume Share, By Applications, 2022 & 2032F |
3.8 Lithuania Stannic Chloride Market Revenues & Volume Share, By End-User Industry, 2022 & 2032F |
3.9 Lithuania Stannic Chloride Market Revenues & Volume Share, By Product, 2022 & 2032F |
4 Lithuania Stannic Chloride Market Dynamics |
4.1 Impact Analysis |
4.2 Market Drivers |
4.2.1 Increasing demand for stannic chloride in the electronics industry for manufacturing semiconductors and other electronic components. |
4.2.2 Growing application of stannic chloride in the textile industry for dyeing and printing processes. |
4.2.3 Rising investments in research and development activities to explore new applications and properties of stannic chloride. |
4.3 Market Restraints |
4.3.1 Fluctuating prices of raw materials used in the production of stannic chloride. |
4.3.2 Stringent regulations and environmental concerns related to the handling and disposal of stannic chloride. |
4.3.3 Competition from alternative materials or substitutes impacting the demand for stannic chloride. |
5 Lithuania Stannic Chloride Market Trends |
6 Lithuania Stannic Chloride Market, By Types |
6.1 Lithuania Stannic Chloride Market, By Product Form |
6.1.1 Overview and Analysis |
6.1.2 Lithuania Stannic Chloride Market Revenues & Volume, By Product Form, 2022 - 2032F |
6.1.3 Lithuania Stannic Chloride Market Revenues & Volume, By Liquid, 2022 - 2032F |
6.1.4 Lithuania Stannic Chloride Market Revenues & Volume, By Solid, 2022 - 2032F |
6.2 Lithuania Stannic Chloride Market, By Purity of Product |
6.2.1 Overview and Analysis |
6.2.2 Lithuania Stannic Chloride Market Revenues & Volume, By 0.99, 2022 - 2032F |
6.2.3 Lithuania Stannic Chloride Market Revenues & Volume, By Others, 2022 - 2032F |
6.3 Lithuania Stannic Chloride Market, By Applications |
6.3.1 Overview and Analysis |
6.3.2 Lithuania Stannic Chloride Market Revenues & Volume, By Electronics, 2022 - 2032F |
6.3.3 Lithuania Stannic Chloride Market Revenues & Volume, By Tinplate, 2022 - 2032F |
6.3.4 Lithuania Stannic Chloride Market Revenues & Volume, By Float Glass, 2022 - 2032F |
6.3.5 Lithuania Stannic Chloride Market Revenues & Volume, By Brass & Bronze, 2022 - 2032F |
6.4 Lithuania Stannic Chloride Market, By End-User Industry |
6.4.1 Overview and Analysis |
6.4.2 Lithuania Stannic Chloride Market Revenues & Volume, By Polymers, 2022 - 2032F |
6.4.3 Lithuania Stannic Chloride Market Revenues & Volume, By Agriculture, 2022 - 2032F |
6.4.4 Lithuania Stannic Chloride Market Revenues & Volume, By Pharmaceuticals, 2022 - 2032F |
6.4.5 Lithuania Stannic Chloride Market Revenues & Volume, By Electrical & Electronics, 2022 - 2032F |
6.4.6 Lithuania Stannic Chloride Market Revenues & Volume, By Chemical, 2022 - 2032F |
6.4.7 Lithuania Stannic Chloride Market Revenues & Volume, By Other Industrial, 2022 - 2032F |
6.5 Lithuania Stannic Chloride Market, By Product |
6.5.1 Overview and Analysis |
6.5.2 Lithuania Stannic Chloride Market Revenues & Volume, By Stannic Chloride Anhydrate, 2022 - 2032F |
6.5.3 Lithuania Stannic Chloride Market Revenues & Volume, By Stannic Chloride Pentahydrate, 2022 - 2032F |
7 Lithuania Stannic Chloride Market Import-Export Trade Statistics |
7.1 Lithuania Stannic Chloride Market Export to Major Countries |
7.2 Lithuania Stannic Chloride Market Imports from Major Countries |
8 Lithuania Stannic Chloride Market Key Performance Indicators |
8.1 Number of new product developments or innovations in the stannic chloride market. |
8.2 Research and development expenditure dedicated to improving stannic chloride production processes or applications. |
8.3 Percentage of market share held by stannic chloride in key industries where it is used. |
8.4 Environmental impact indicators related to the production and use of stannic chloride, such as waste management practices or emissions reduction initiatives. |
9 Lithuania Stannic Chloride Market - Opportunity Assessment |
9.1 Lithuania Stannic Chloride Market Opportunity Assessment, By Product Form, 2022 & 2032F |
9.2 Lithuania Stannic Chloride Market Opportunity Assessment, By Purity of Product, 2022 & 2032F |
9.3 Lithuania Stannic Chloride Market Opportunity Assessment, By Applications, 2022 & 2032F |
9.4 Lithuania Stannic Chloride Market Opportunity Assessment, By End-User Industry, 2022 & 2032F |
9.5 Lithuania Stannic Chloride Market Opportunity Assessment, By Product, 2022 & 2032F |
10 Lithuania Stannic Chloride Market - Competitive Landscape |
10.1 Lithuania Stannic Chloride Market Revenue Share, By Companies, 2025 |
10.2 Lithuania Stannic Chloride Market Competitive Benchmarking, By Operating and Technical Parameters |
11 Company Profiles |
12 Recommendations |
13 Disclaimer |
Export potential assessment - trade Analytics for 2030
Export potential enables firms to identify high-growth global markets with greater confidence by combining advanced trade intelligence with a structured quantitative methodology. The framework analyzes emerging demand trends and country-level import patterns while integrating macroeconomic and trade datasets such as GDP and population forecasts, bilateral import–export flows, tariff structures, elasticity differentials between developed and developing economies, geographic distance, and import demand projections. Using weighted trade values from 2020–2024 as the base period to project country-to-country export potential for 2030, these inputs are operationalized through calculated drivers such as gravity model parameters, tariff impact factors, and projected GDP per-capita growth. Through an analysis of hidden potentials, demand hotspots, and market conditions that are most favorable to success, this method enables firms to focus on target countries, maximize returns, and global expansion with data, backed by accuracy.
By factoring in the projected importer demand gap that is currently unmet and could be potential opportunity, it identifies the potential for the Exporter (Country) among 190 countries, against the general trade analysis, which identifies the biggest importer or exporter.
To discover high-growth global markets and optimize your business strategy:
Click Here
Pricing
- Single User License$ 1,995
- Department License$ 2,400
- Site License$ 3,120
- Global License$ 3,795

Search
Thought Leadership and Analyst Meet


Our Clients
Latest Reports
- Canada Cloud CFD Market (2026-2032) | Size & Revenue, Industry, Growth, Competitive Landscape, Forecast, Segmentation, Value, Outlook, Trends, Share, Analysis, Companies
- Taiwan Food Delivery Platform Market (2026-2032) | Companies, Outlook, Analysis, Trends, Value, Revenue, Segmentation, Share, Forecast, Competitive Landscape, Growth, Size & Forecast
- United Kingdom (UK) Long-term Care Insurance Market (2026-2032) | Growth, Share, Consumer Insights, Drivers, Opportunities, Competition, Pricing Analysis, Segments, Restraints, Companies, Competitive, Value, Outlook, Size, Demand, Analysis, Challenges, Strategic Insights, Investment Trends, Revenue, Trends, Supply, Forecast
- United Kingdom (UK) Long Term Care Market (2026-2032) | Companies, Outlook, Analysis, Trends, Value, Revenue, Segmentation, Share, Forecast, Competitive Landscape, Growth, Size & Forecast
- Iraq Insulation and Waterproofing Market (2026-2032) | Outlook, Drivers, Growth, Size, Share, Industry, Revenue, Trends, Demand, Competitive, Strategic Insights, Opportunities, Segments, Companies, Challenges, Strategy, Consumer Insights, Analysis, Investment Trends, Value, Segmentation, Forecast, Restraints
- India Switchgear Market Outlook (2026-2032) | Size, Share, Trends, Growth, Revenue, Forecast, Analysis, Value, Outlook
- Pakistan Contraceptive Implants Market (2025-2031) | Demand, Growth, Size, Share, Industry, Pricing Analysis, Competitive, Strategic Insights, Strategy, Consumer Insights, Analysis, Investment Trends, Opportunities, Revenue, Segments, Value, Segmentation, Supply, Forecast, Restraints, Outlook, Competition, Drivers, Trends, Companies, Challenges
- Sri Lanka Packaging Market (2026-2032) | Outlook, Competition, Drivers, Trends, Demand, Pricing Analysis, Competitive, Strategic Insights, Companies, Challenges, Strategy, Consumer Insights, Analysis, Investment Trends, Opportunities, Growth, Size, Share, Industry, Revenue, Segments, Value, Segmentation, Supply, Forecast, Restraints
- India Kids Watches Market (2026-2032) | Strategy, Consumer Insights, Analysis, Investment Trends, Opportunities, Growth, Size, Share, Industry, Revenue, Segments, Value, Segmentation, Supply, Forecast, Restraints, Outlook, Competition, Drivers, Trends, Demand, Pricing Analysis, Competitive, Strategic Insights, Companies, Challenges
- Saudi Arabia Core Assurance Service Market (2025-2031) | Strategy, Consumer Insights, Analysis, Investment Trends, Opportunities, Growth, Size, Share, Industry, Revenue, Segments, Value, Segmentation, Supply, Forecast, Restraints, Outlook, Competition, Drivers, Trends, Demand, Pricing Analysis, Competitive, Strategic Insights, Companies, Challenges
Industry Events and Analyst Meet

India EV Show 2026

EV tech India Expo 2026

Auto Tech Asia 2026

Battery Tech India 2026

Smart Production Solutions Guangzhou 2026
Whitepaper
- Middle East & Africa Commercial Security Market Click here to view more.
- Middle East & Africa Fire Safety Systems & Equipment Market Click here to view more.
- GCC Drone Market Click here to view more.
- Middle East Lighting Fixture Market Click here to view more.
- GCC Physical & Perimeter Security Market Click here to view more.
6WResearch In News
- Doha a strategic location for EV manufacturing hub: IPA Qatar
- Demand for luxury TVs surging in the GCC, says Samsung
- Empowering Growth: The Thriving Journey of Bangladesh’s Cable Industry
- Demand for luxury TVs surging in the GCC, says Samsung
- Video call with a traditional healer? Once unthinkable, it’s now common in South Africa
- Intelligent Buildings To Smooth GCC’s Path To Net Zero