Lithuania Stuffed Animals And Plush Toys Market (2026-2032) | Share, Industry, Companies, Outlook, Analysis, Forecast, Size & Revenue, Trends, Competitive Landscape, Value, Growth, Segmentation
Market Forecast By Product (Stuffed Animals, Cartoon Toys, Action Figures, Others), By Distribution Channel (Online, Offline) And Competitive Landscape
| Product Code: ETC8052249 | Publication Date: Sep 2024 | Updated Date: Apr 2026 | Product Type: Market Research Report | |
| Publisher: 6Wresearch | Author: Summon Dutta | No. of Pages: 75 | No. of Figures: 35 | No. of Tables: 20 |
Lithuania Stuffed Animals And Plush Toys Market Size (2020-2030)
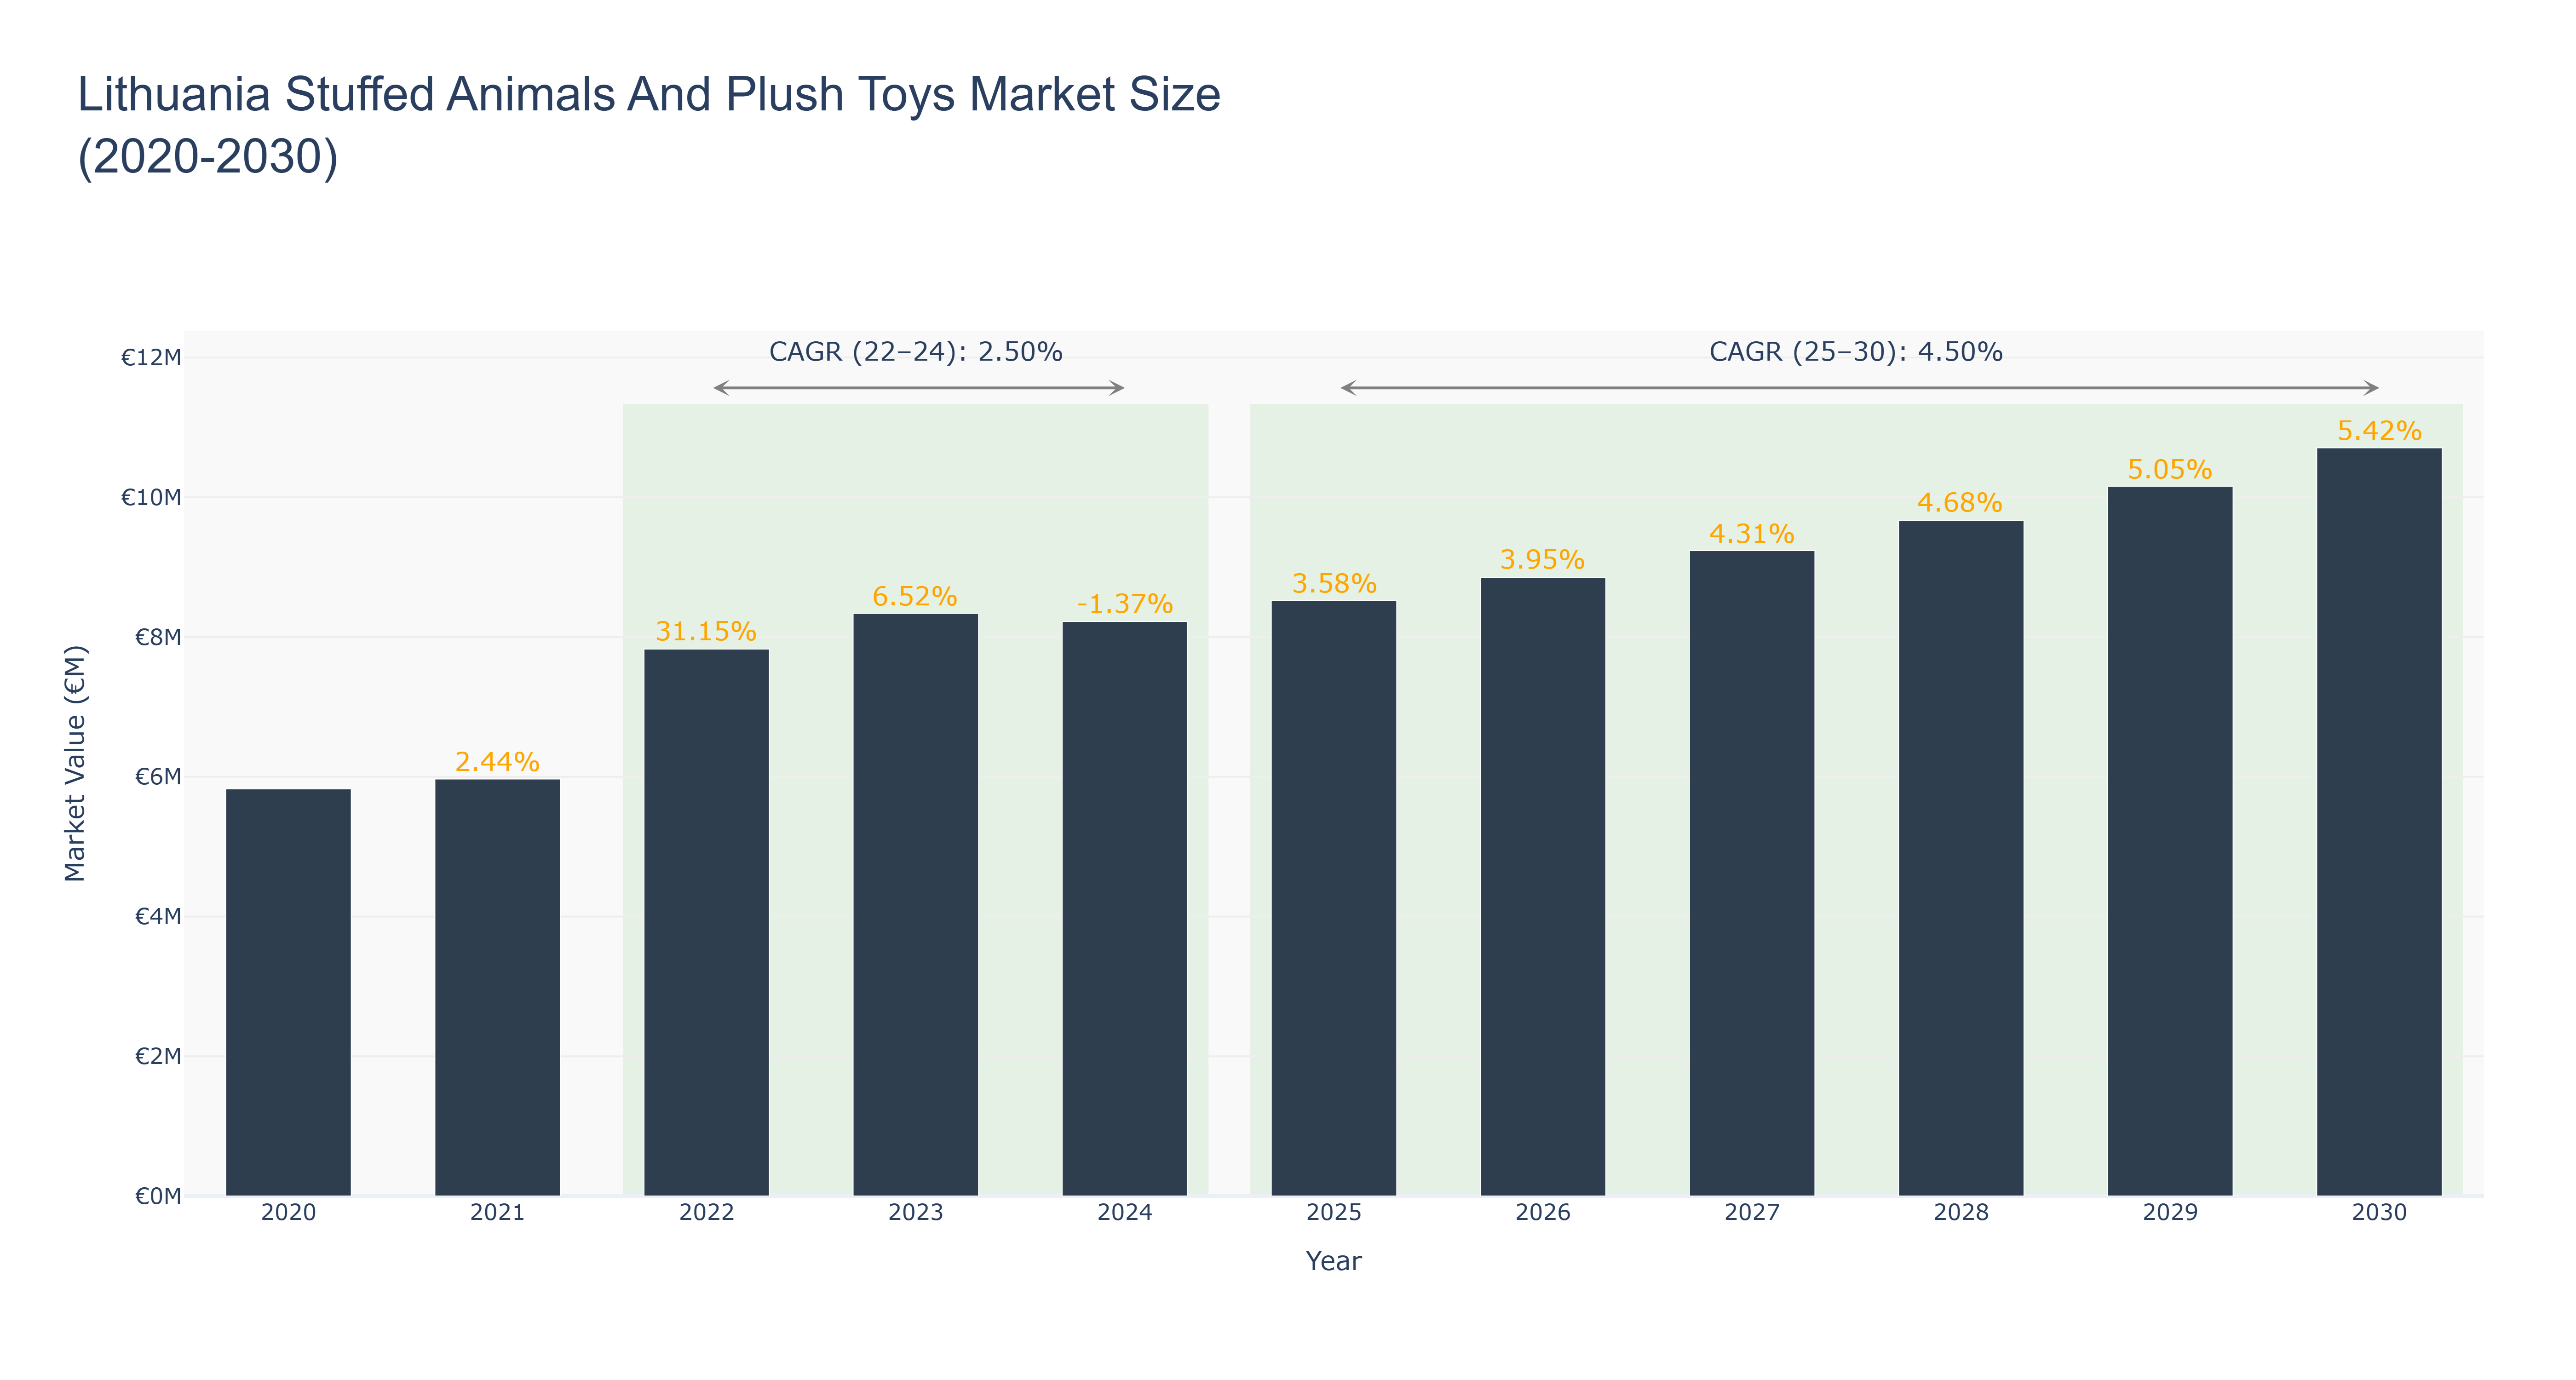
The Lithuania Stuffed Animals And Plush Toys Market witnessed a steady growth trajectory from 2020 to 2024, with the market size increasing from €5.83 million in 2020 to €8.22 million in 2024. However, a slight decline was observed in 2024 due to a -1.37% growth rate. Looking ahead, the market is forecasted to continue its upward trend, with an expected market size of €10.71 million in 2030, driven by a CAGR of 4.50% from 2025 to 2030. The market experienced a notable spike in growth from 2022 to 2024, attributed to increased consumer demand for unique and high-quality stuffed animals and plush toys. Moving forward, upcoming initiatives in Lithuania, such as collaborations with international toy manufacturers and innovative product launches, are expected to further boost market growth and competitiveness in the industry.
Lithuania Stuffed Animals And Plush Toys Market: Production & Trade Performance (2019-2025)
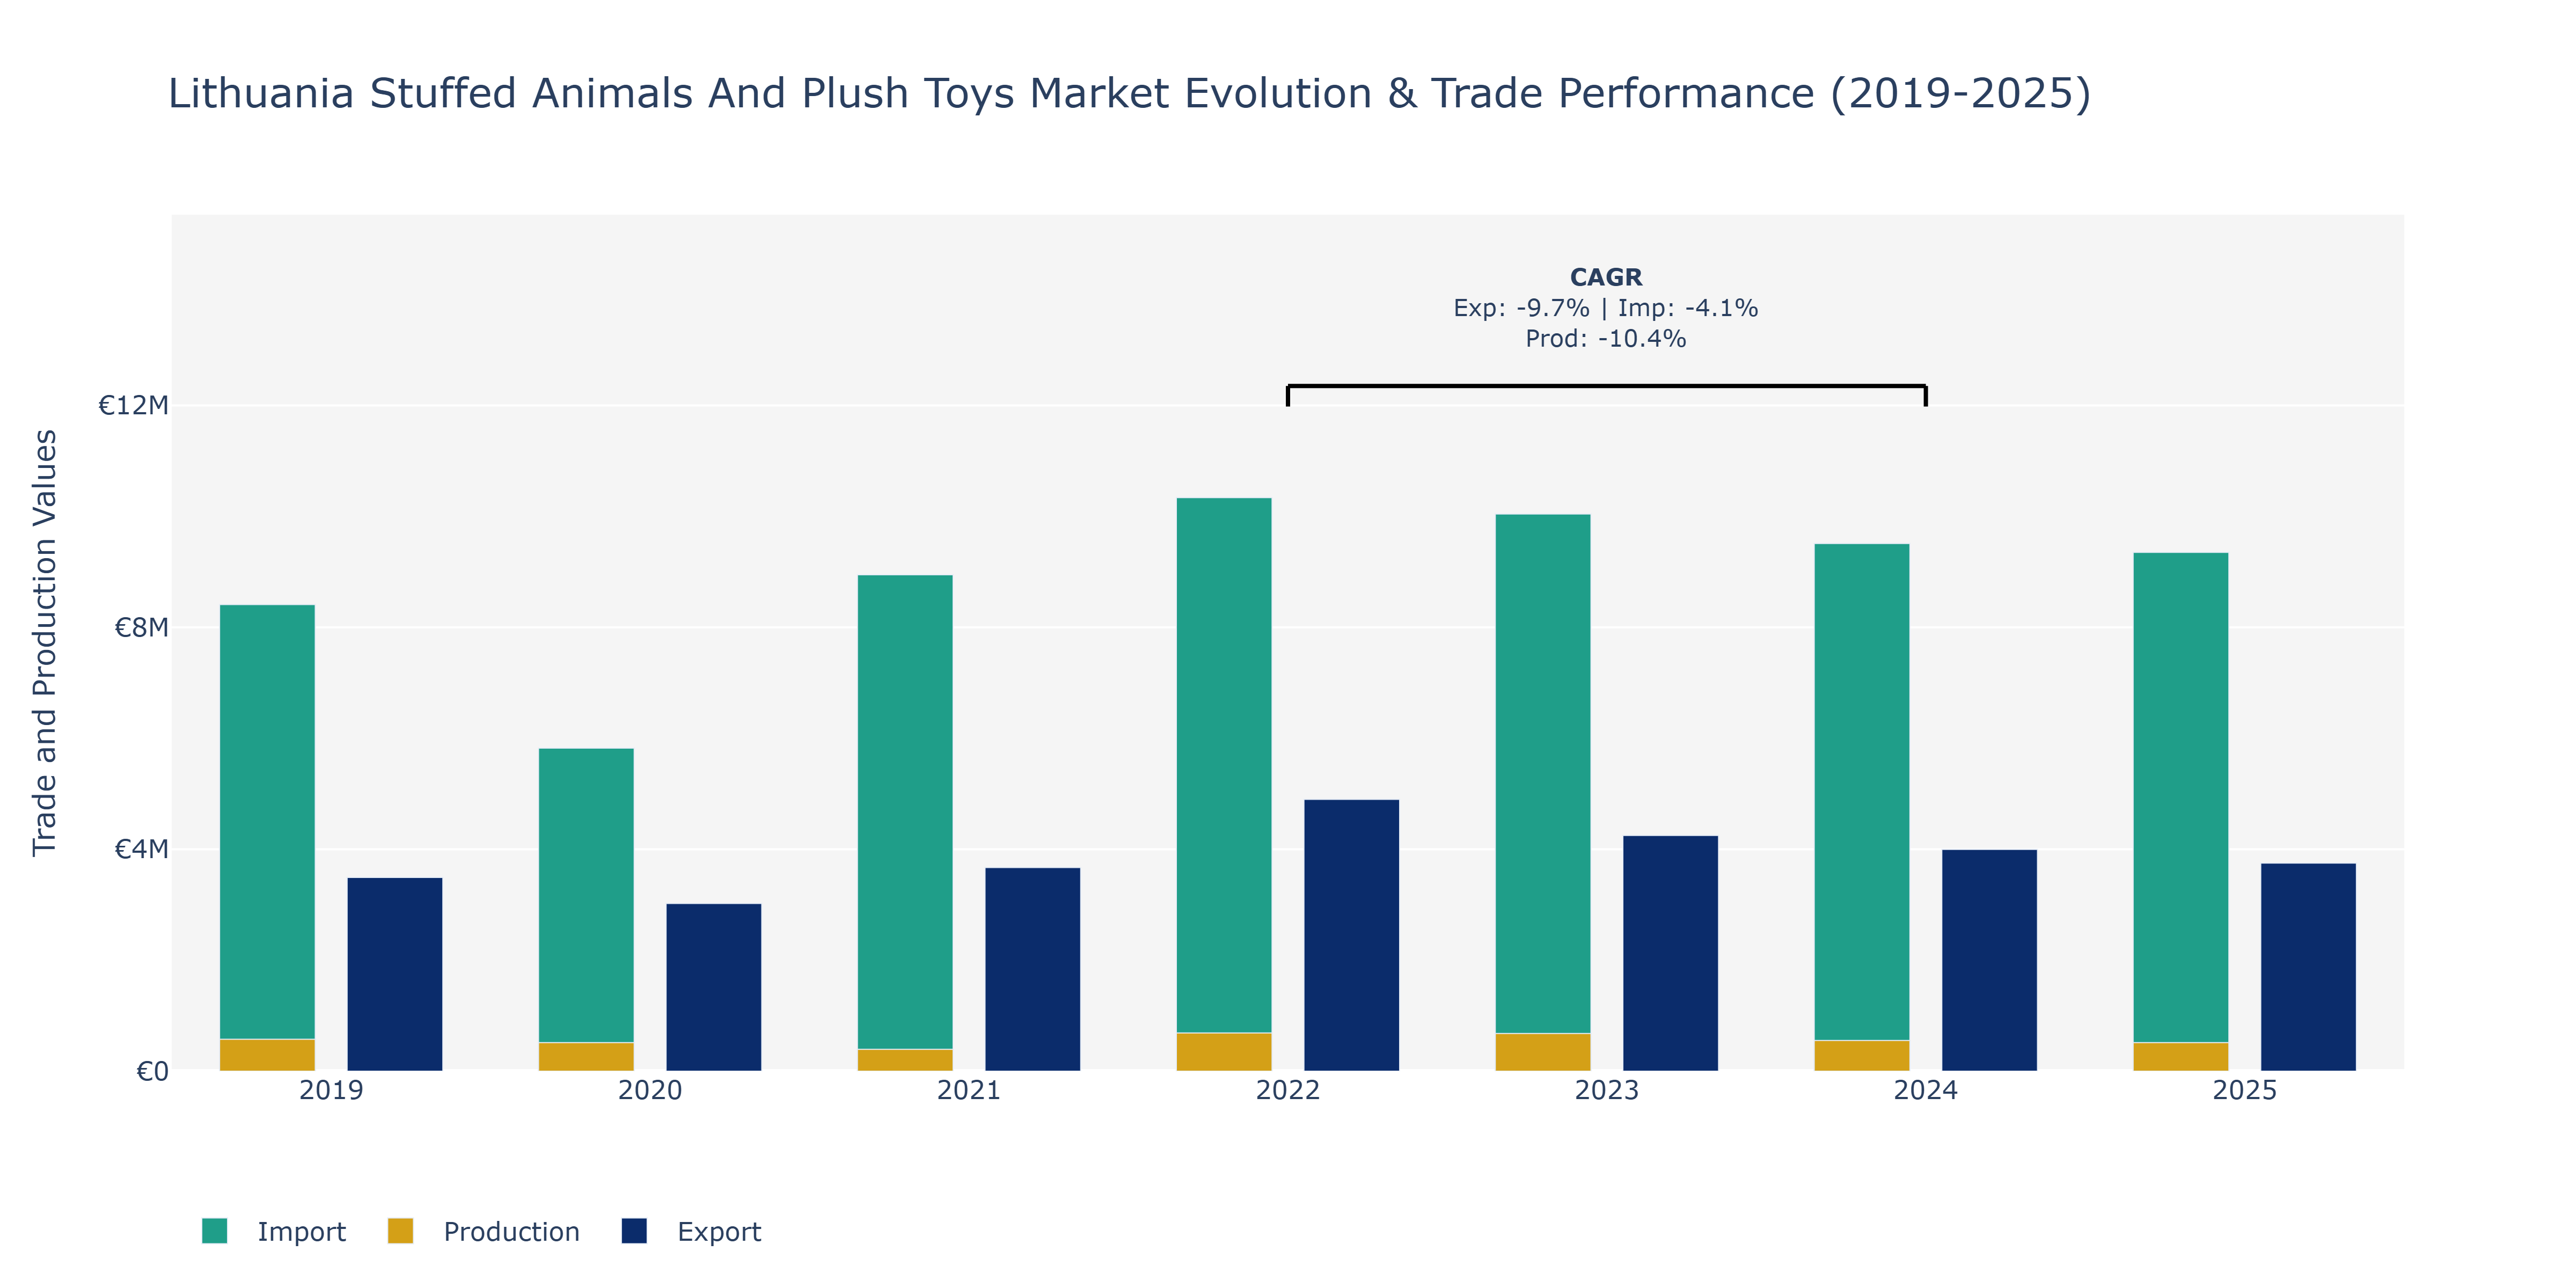
The Lithuania Stuffed Animals And Plush Toys Market witnessed fluctuations in Exports, Imports, and Production from 2019 to 2025. Exports started at €3.49 million in 2019, declined to €3.75 million by 2025, with a peak of €4.9 million in 2022. Imports began at €8.41 million, rose to €10.34 million in 2022, and decreased to €9.35 million by 2025, with a peak in 2022. Production, initially at €576 million, dropped to €515 million in 2025, with the highest value in 2022 at €689 million. The declines in Exports, Imports, and Production could be attributed to various factors such as changing consumer preferences towards other toy categories, global economic conditions affecting trade patterns, and increased competition from other markets offering similar products. The market may benefit from strategic partnerships with international retailers, innovative product designs, and sustainable manufacturing practices to enhance competitiveness and stimulate growth in the coming years.
Key Highlights of the Report:
- Lithuania Stuffed Animals And Plush Toys Market Outlook
- Market Size of Lithuania Stuffed Animals And Plush Toys Market, 2025
- Forecast of Lithuania Stuffed Animals And Plush Toys Market, 2032
- Historical Data and Forecast of Lithuania Stuffed Animals And Plush Toys Revenues & Volume for the Period 2022 - 2032
- Lithuania Stuffed Animals And Plush Toys Market Trend Evolution
- Lithuania Stuffed Animals And Plush Toys Market Drivers and Challenges
- Lithuania Stuffed Animals And Plush Toys Price Trends
- Lithuania Stuffed Animals And Plush Toys Porter's Five Forces
- Lithuania Stuffed Animals And Plush Toys Industry Life Cycle
- Historical Data and Forecast of Lithuania Stuffed Animals And Plush Toys Market Revenues & Volume By Product for the Period 2022 - 2032
- Historical Data and Forecast of Lithuania Stuffed Animals And Plush Toys Market Revenues & Volume By Stuffed Animals for the Period 2022 - 2032
- Historical Data and Forecast of Lithuania Stuffed Animals And Plush Toys Market Revenues & Volume By Cartoon Toys for the Period 2022 - 2032
- Historical Data and Forecast of Lithuania Stuffed Animals And Plush Toys Market Revenues & Volume By Action Figures for the Period 2022 - 2032
- Historical Data and Forecast of Lithuania Stuffed Animals And Plush Toys Market Revenues & Volume By Others for the Period 2022 - 2032
- Historical Data and Forecast of Lithuania Stuffed Animals And Plush Toys Market Revenues & Volume By Distribution Channel for the Period 2022 - 2032
- Historical Data and Forecast of Lithuania Stuffed Animals And Plush Toys Market Revenues & Volume By Online for the Period 2022 - 2032
- Historical Data and Forecast of Lithuania Stuffed Animals And Plush Toys Market Revenues & Volume By Offline for the Period 2022 - 2032
- Lithuania Stuffed Animals And Plush Toys Import Export Trade Statistics
- Market Opportunity Assessment By Product
- Market Opportunity Assessment By Distribution Channel
- Lithuania Stuffed Animals And Plush Toys Top Companies Market Share
- Lithuania Stuffed Animals And Plush Toys Competitive Benchmarking By Technical and Operational Parameters
- Lithuania Stuffed Animals And Plush Toys Company Profiles
- Lithuania Stuffed Animals And Plush Toys Key Strategic Recommendations
Frequently Asked Questions About the Market Study (FAQs):
6Wresearch actively monitors the Lithuania Stuffed Animals And Plush Toys Market and publishes its comprehensive annual report, highlighting emerging trends, growth drivers, revenue analysis, and forecast outlook. Our insights help businesses to make data-backed strategic decisions with ongoing market dynamics. Our analysts track relevent industries related to the Lithuania Stuffed Animals And Plush Toys Market, allowing our clients with actionable intelligence and reliable forecasts tailored to emerging regional needs.
Yes, we provide customisation as per your requirements. To learn more, feel free to contact us on sales@6wresearch.com
1 Executive Summary |
2 Introduction |
2.1 Key Highlights of the Report |
2.2 Report Description |
2.3 Market Scope & Segmentation |
2.4 Research Methodology |
2.5 Assumptions |
3 Lithuania Stuffed Animals And Plush Toys Market Overview |
3.1 Lithuania Country Macro Economic Indicators |
3.2 Lithuania Stuffed Animals And Plush Toys Market Revenues & Volume, 2022 & 2032F |
3.3 Lithuania Stuffed Animals And Plush Toys Market - Industry Life Cycle |
3.4 Lithuania Stuffed Animals And Plush Toys Market - Porter's Five Forces |
3.5 Lithuania Stuffed Animals And Plush Toys Market Revenues & Volume Share, By Product, 2022 & 2032F |
3.6 Lithuania Stuffed Animals And Plush Toys Market Revenues & Volume Share, By Distribution Channel, 2022 & 2032F |
4 Lithuania Stuffed Animals And Plush Toys Market Dynamics |
4.1 Impact Analysis |
4.2 Market Drivers |
4.2.1 Growing demand for unique and customized stuffed animals and plush toys |
4.2.2 Increasing popularity of licensed character merchandise among children |
4.2.3 Rise in disposable income leading to higher spending on toys |
4.3 Market Restraints |
4.3.1 Competition from online retailers and e-commerce platforms |
4.3.2 Fluctuating raw material prices affecting production costs |
4.3.3 Stringent regulations related to toy safety standards |
5 Lithuania Stuffed Animals And Plush Toys Market Trends |
6 Lithuania Stuffed Animals And Plush Toys Market, By Types |
6.1 Lithuania Stuffed Animals And Plush Toys Market, By Product |
6.1.1 Overview and Analysis |
6.1.2 Lithuania Stuffed Animals And Plush Toys Market Revenues & Volume, By Product, 2022 - 2032F |
6.1.3 Lithuania Stuffed Animals And Plush Toys Market Revenues & Volume, By Stuffed Animals, 2022 - 2032F |
6.1.4 Lithuania Stuffed Animals And Plush Toys Market Revenues & Volume, By Cartoon Toys, 2022 - 2032F |
6.1.5 Lithuania Stuffed Animals And Plush Toys Market Revenues & Volume, By Action Figures, 2022 - 2032F |
6.1.6 Lithuania Stuffed Animals And Plush Toys Market Revenues & Volume, By Others, 2022 - 2032F |
6.2 Lithuania Stuffed Animals And Plush Toys Market, By Distribution Channel |
6.2.1 Overview and Analysis |
6.2.2 Lithuania Stuffed Animals And Plush Toys Market Revenues & Volume, By Online, 2022 - 2032F |
6.2.3 Lithuania Stuffed Animals And Plush Toys Market Revenues & Volume, By Offline, 2022 - 2032F |
7 Lithuania Stuffed Animals And Plush Toys Market Import-Export Trade Statistics |
7.1 Lithuania Stuffed Animals And Plush Toys Market Export to Major Countries |
7.2 Lithuania Stuffed Animals And Plush Toys Market Imports from Major Countries |
8 Lithuania Stuffed Animals And Plush Toys Market Key Performance Indicators |
8.1 Average selling price per unit of stuffed animals and plush toys |
8.2 Percentage of revenue from licensed character merchandise |
8.3 Customer satisfaction index based on product quality and design |
8.4 Percentage of market share of key players in the industry |
8.5 Number of new product launches and innovations in the market |
9 Lithuania Stuffed Animals And Plush Toys Market - Opportunity Assessment |
9.1 Lithuania Stuffed Animals And Plush Toys Market Opportunity Assessment, By Product, 2022 & 2032F |
9.2 Lithuania Stuffed Animals And Plush Toys Market Opportunity Assessment, By Distribution Channel, 2022 & 2032F |
10 Lithuania Stuffed Animals And Plush Toys Market - Competitive Landscape |
10.1 Lithuania Stuffed Animals And Plush Toys Market Revenue Share, By Companies, 2025 |
10.2 Lithuania Stuffed Animals And Plush Toys Market Competitive Benchmarking, By Operating and Technical Parameters |
11 Company Profiles |
12 Recommendations |
13 Disclaimer |
Global Go To Market Strategy - 2030
Export potential enables firms to identify high-growth global markets with greater confidence by combining advanced trade intelligence with a structured quantitative methodology. The framework analyzes emerging demand trends and country-level import patterns while integrating macroeconomic and trade datasets such as GDP and population forecasts, bilateral import–export flows, tariff structures, elasticity differentials between developed and developing economies, geographic distance, and import demand projections. Using weighted trade values from 2020–2024 as the base period to project country-to-country export potential for 2030, these inputs are operationalized through calculated drivers such as gravity model parameters, tariff impact factors, and projected GDP per-capita growth. Through an analysis of hidden potentials, demand hotspots, and market conditions that are most favorable to success, this method enables firms to focus on target countries, maximize returns, and global expansion with data, backed by accuracy.
By factoring in the projected importer demand gap that is currently unmet and could be potential opportunity, it identifies the potential for the Exporter (Country) among 190 countries, against the general trade analysis, which identifies the biggest importer or exporter.
To discover high-growth global markets and optimize your business strategy:
Click Here
Pricing
- Single User License$ 1,995
- Department License$ 2,400
- Site License$ 3,120
- Global License$ 3,795

Leadership Perspectives from Industry Events
Search
Thought Leadership and Analyst Meet


Our Clients
6WResearch In News
- India Export Attractiveness Tracker 2026
- India Air Conditioner Market Set for Strong Rebound in 2026 After Weather-Led Correction and GST-Driven Recovery: 6Wresearch
- ADAS in India: How Automatic Emergency Braking, Blind Spot Detection & Driver Monitoring are Transforming Road Safety
- Doha a strategic location for EV manufacturing hub: IPA Qatar
- Demand for luxury TVs surging in the GCC, says Samsung
- Empowering Growth: The Thriving Journey of Bangladesh’s Cable Industry
Latest Reports
- Nicaragua RPG Gaming Market (2026-2032)
- New Zealand RPG Gaming Market (2026-2032)
- Netherlands RPG Gaming Market (2026-2032)
- Nauru RPG Gaming Market (2026-2032)
- Namibia RPG Gaming Market (2026-2032)
- Mozambique RPG Gaming Market (2026-2032)
- Montenegro RPG Gaming Market (2026-2032)
- Mongolia RPG Gaming Market (2026-2032)
- Monaco RPG Gaming Market (2026-2032)
- Micronesia RPG Gaming Market (2026-2032)
Industry Events and Analyst Meet

EV India Expo 2026

HIMTEX 2026

India Refining Summit 2026

India EV Show 2026

EV tech India Expo 2026
Whitepaper
- Middle East & Africa Commercial Security Market Click here to view more.
- Middle East & Africa Fire Safety Systems & Equipment Market Click here to view more.
- GCC Drone Market Click here to view more.
- Middle East Lighting Fixture Market Click here to view more.
- GCC Physical & Perimeter Security Market Click here to view more.