Lithuania Table linen Market (2026-2032) | Analysis, Value, Trends, Segmentation, Companies, Share, Revenue, Size, Industry, Forecast, Outlook & Growth
Market Forecast By Material (Cotton, Artificial Fibers, Linen Silk, Others), By Application (Residential, Commercial), By Distribution Channel (Hypermarket/Supermarket, Specialty Stores, Online) And Competitive Landscape
| Product Code: ETC5524195 | Publication Date: Nov 2023 | Updated Date: Apr 2026 | Product Type: Market Research Report | |
| Publisher: 6Wresearch | Author: Ravi Bhandari | No. of Pages: 60 | No. of Figures: 30 | No. of Tables: 5 |
Lithuania Table Linen Market Size (2020-2030)
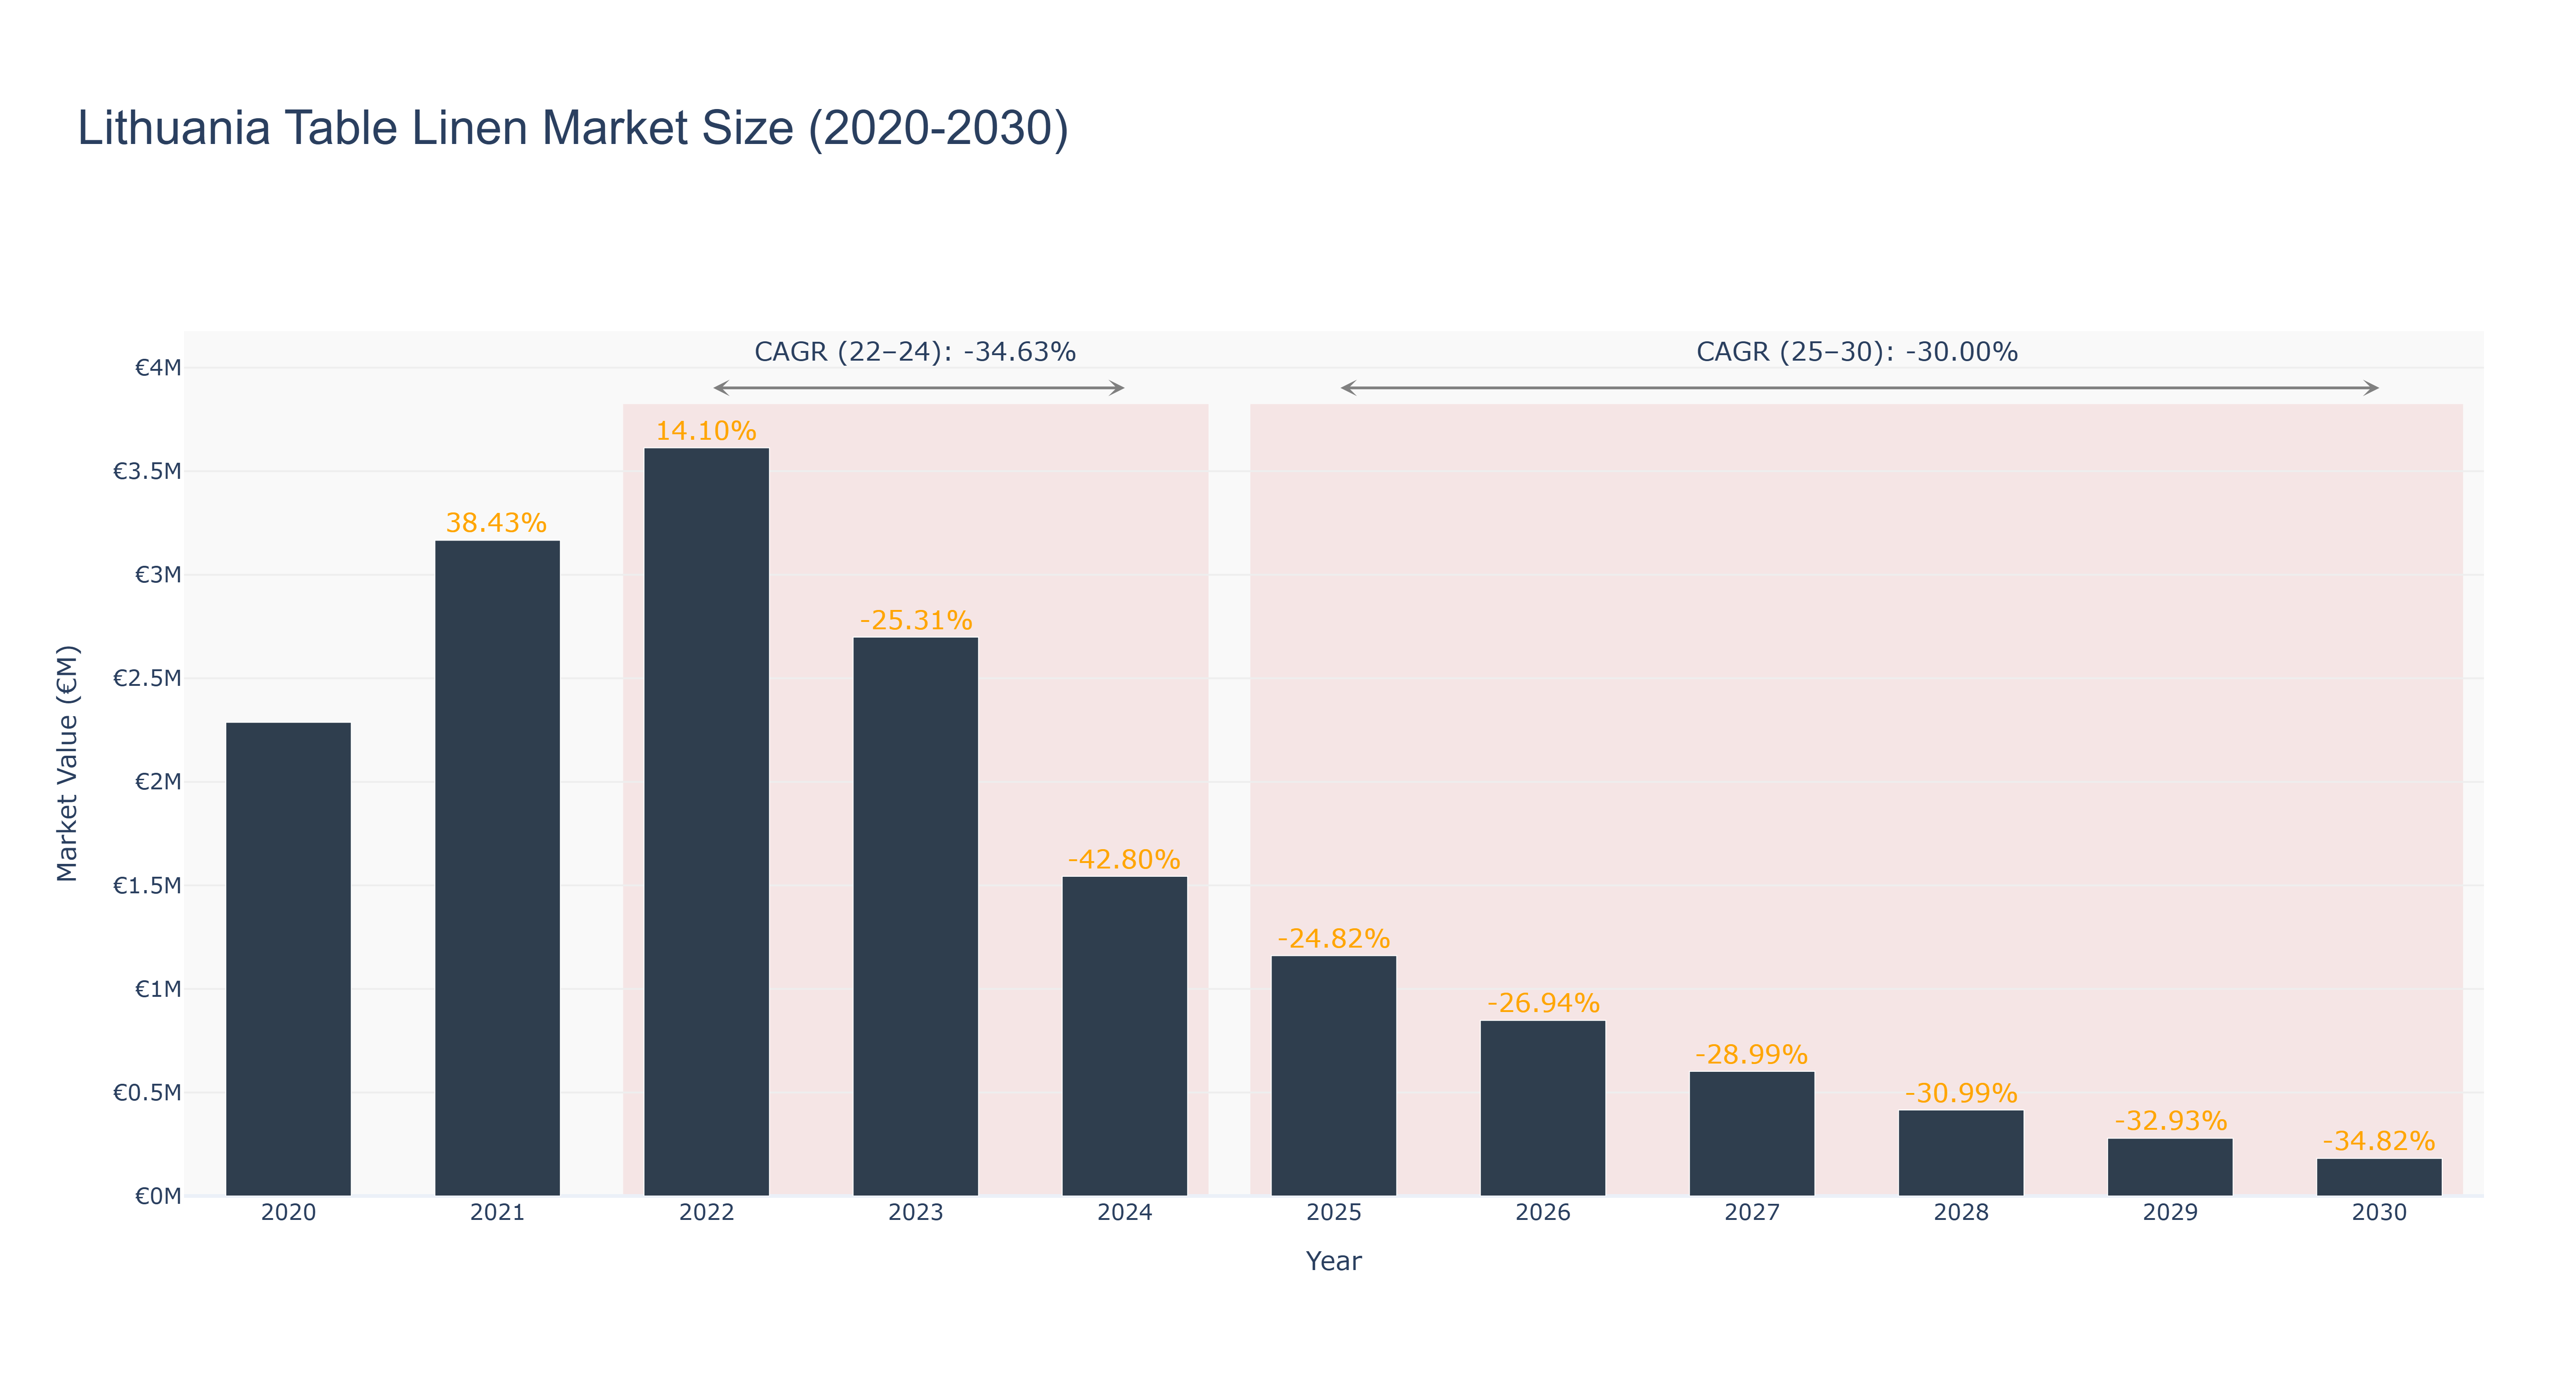
The Lithuania Table Linen Market witnessed a peak market size of €3.61 million in 2022. However, the market size declined steadily over the years, reaching €0.85 million in 2026. The market is forecasted to continue its downward trend, with an expected size of €0.18 million by 2030. The CAGR for the period 2022-24 was -34.63%, while for 2025-30, it is projected to be -30.0%. The market's decline can be attributed to changing consumer preferences, economic challenges, and possibly increased competition. Despite the current downturn, there are upcoming initiatives in Lithuania aimed at revitalizing the textile industry, which could potentially impact the table linen market positively in the future. Industry drivers such as sustainability, innovation in design, and quality standards will play a crucial role in shaping the market's trajectory moving forward.
Lithuania Table Linen Market: Production & Trade Performance (2019-2025)
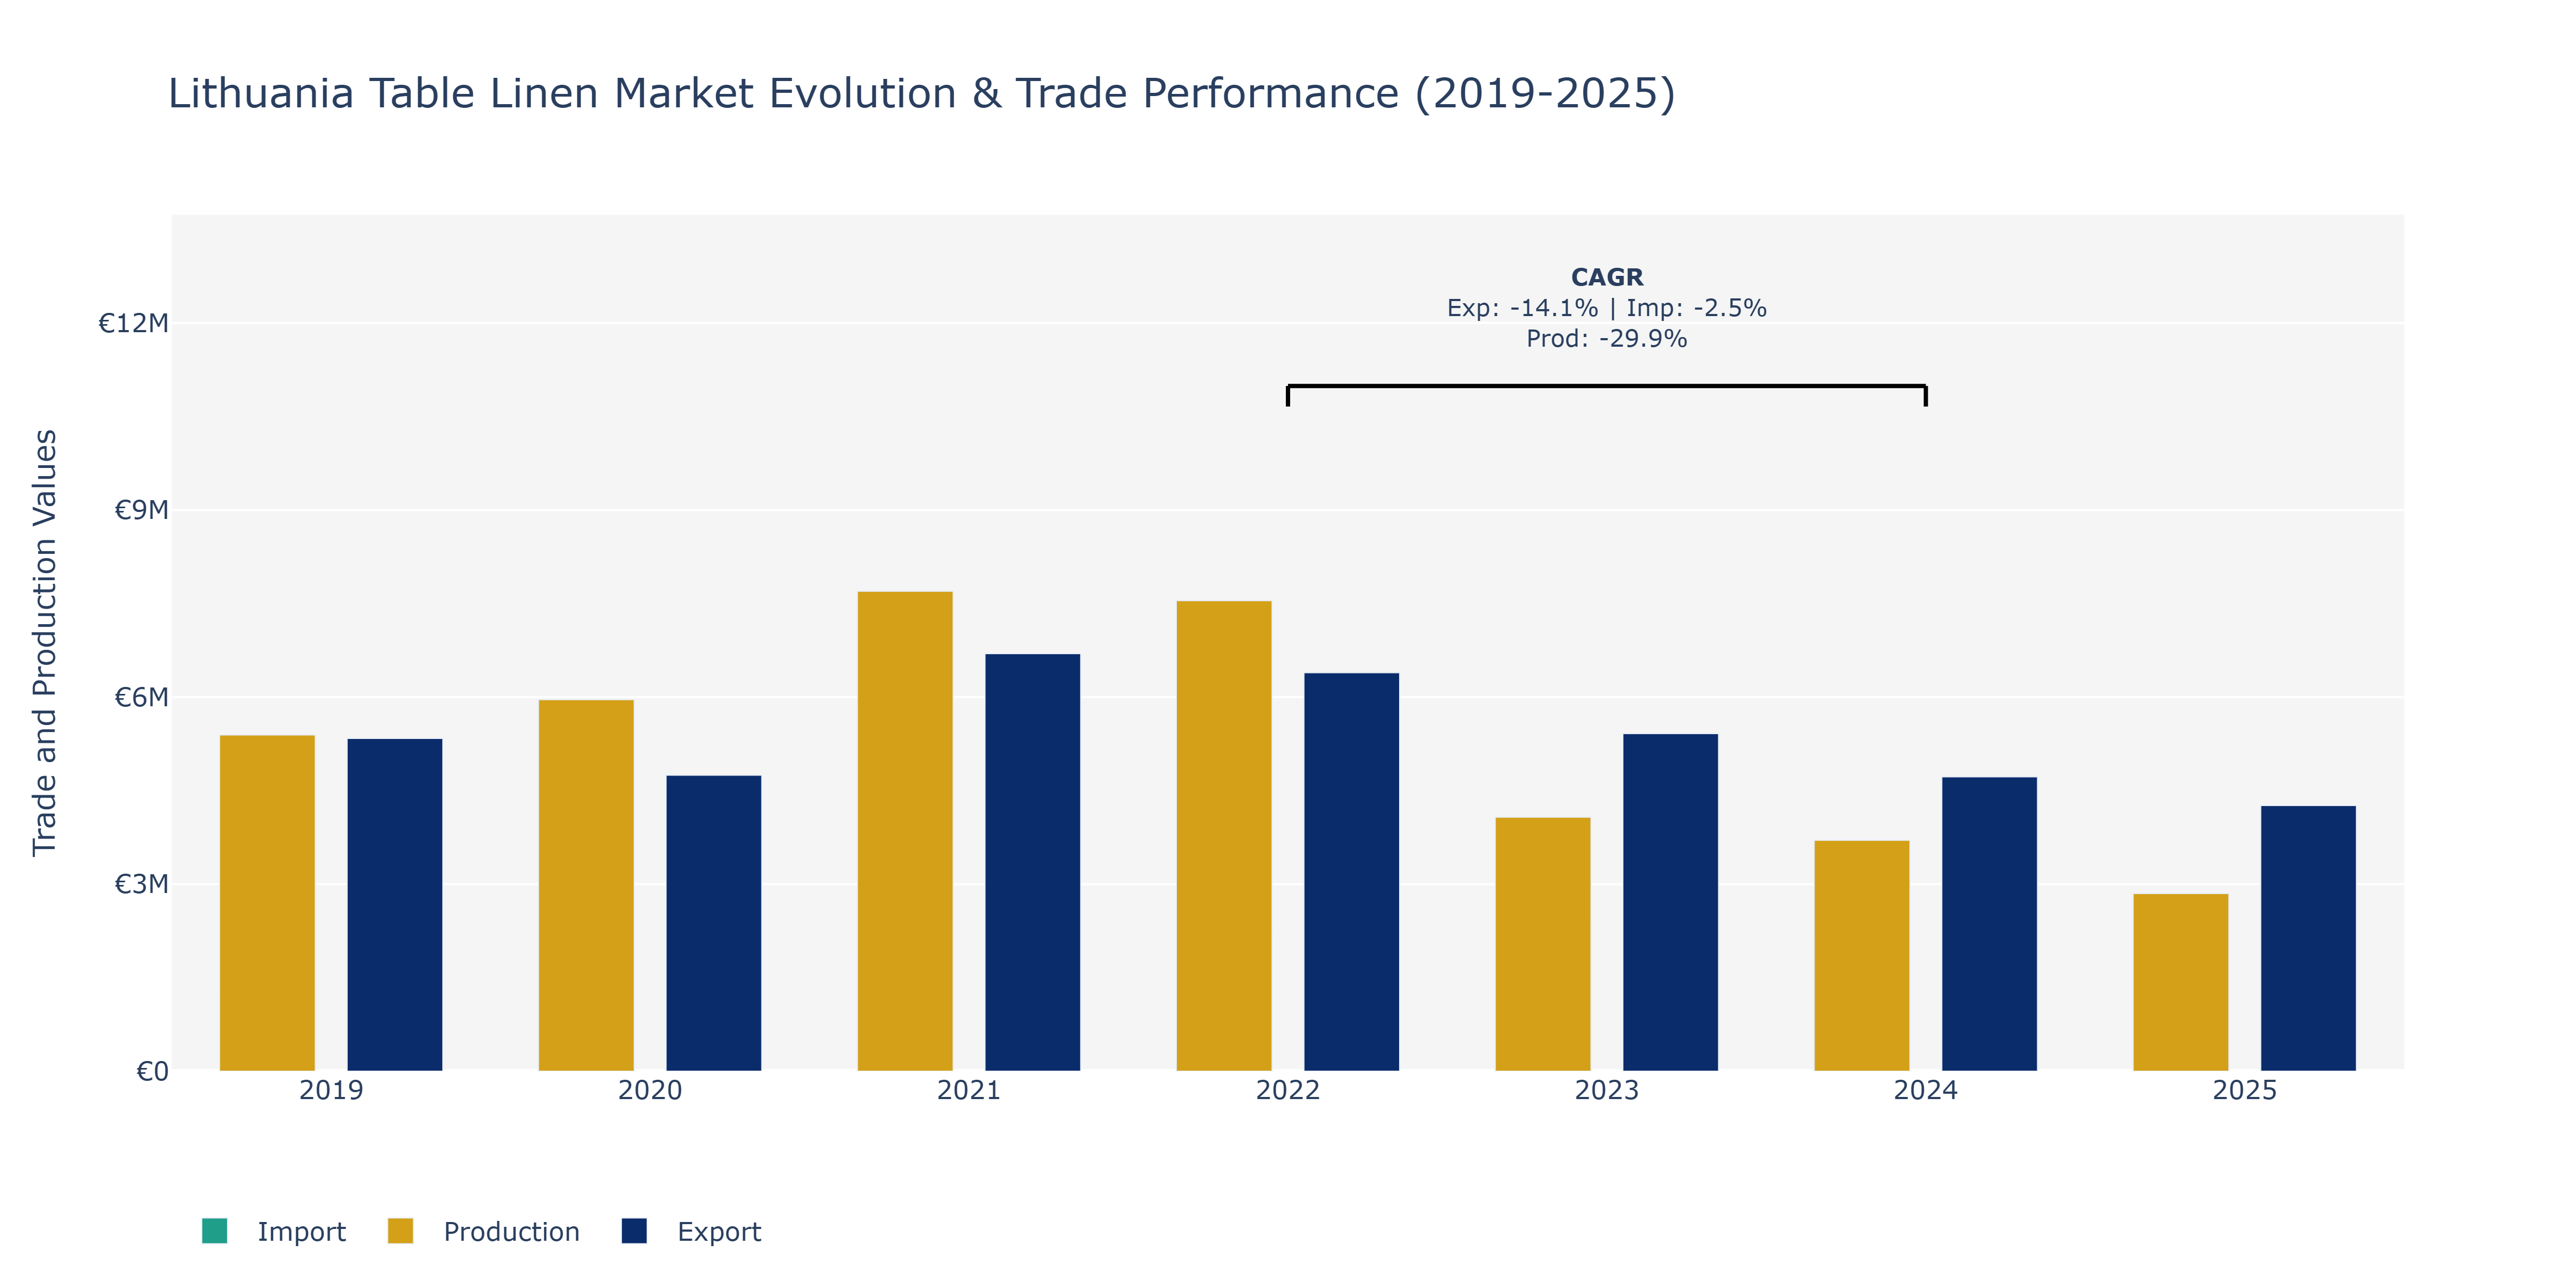
Between 2019 and 2025, Lithuania's Table Linen Market saw varied performances in Exports, Imports, and Production. Exports experienced a decline from €5.34 million in 2019 to around €4.26 million in 2025, with a notable drop post-2021. Imports, meanwhile, fluctuated, reaching a peak of €2.39 million in 2023 after a steady increase. Production value followed a different trajectory, decreasing sharply from around €7.70 million in 2021 to approximately €2.85 million in 2025. These shifts could be attributed to global demand fluctuations, changes in consumer preferences towards sustainable materials, and the impact of external factors like trade agreements or disruptions in the supply chain. The decreasing production trend may indicate a shift towards more specialized or high-end table linen products, aligning with the industry's move towards value-added offerings and customization to meet evolving market demands.
Key Highlights of the Report:
- Lithuania Table linen Market Outlook
- Market Size of Lithuania Table linen Market, 2025
- Forecast of Lithuania Table linen Market, 2032
- Historical Data and Forecast of Lithuania Table linen Revenues & Volume for the Period 2022 - 2032F
- Lithuania Table linen Market Trend Evolution
- Lithuania Table linen Market Drivers and Challenges
- Lithuania Table linen Price Trends
- Lithuania Table linen Porter`s Five Forces
- Lithuania Table linen Industry Life Cycle
- Historical Data and Forecast of Lithuania Table linen Market Revenues & Volume By Material for the Period 2022 - 2032F
- Historical Data and Forecast of Lithuania Table linen Market Revenues & Volume By Cotton for the Period 2022 - 2032F
- Historical Data and Forecast of Lithuania Table linen Market Revenues & Volume By Artificial Fibers for the Period 2022 - 2032F
- Historical Data and Forecast of Lithuania Table linen Market Revenues & Volume By Linen Silk for the Period 2022 - 2032F
- Historical Data and Forecast of Lithuania Table linen Market Revenues & Volume By Others for the Period 2022 - 2032F
- Historical Data and Forecast of Lithuania Table linen Market Revenues & Volume By Application for the Period 2022 - 2032F
- Historical Data and Forecast of Lithuania Table linen Market Revenues & Volume By Residential for the Period 2022 - 2032F
- Historical Data and Forecast of Lithuania Table linen Market Revenues & Volume By Commercial for the Period 2022 - 2032F
- Historical Data and Forecast of Lithuania Table linen Market Revenues & Volume By Distribution Channel for the Period 2022 - 2032F
- Historical Data and Forecast of Lithuania Table linen Market Revenues & Volume By Hypermarket/Supermarket for the Period 2022 - 2032F
- Historical Data and Forecast of Lithuania Table linen Market Revenues & Volume By Specialty Stores for the Period 2022 - 2032F
- Historical Data and Forecast of Lithuania Table linen Market Revenues & Volume By Online for the Period 2022 - 2032F
- Lithuania Table linen Import Export Trade Statistics
- Market Opportunity Assessment By Material
- Market Opportunity Assessment By Application
- Market Opportunity Assessment By Distribution Channel
- Lithuania Table linen Top Companies Market Share
- Lithuania Table linen Competitive Benchmarking By Technical and Operational Parameters
- Lithuania Table linen Company Profiles
- Lithuania Table linen Key Strategic Recommendations
Frequently Asked Questions About the Market Study (FAQs):
6Wresearch actively monitors the Lithuania Table linen Market and publishes its comprehensive annual report, highlighting emerging trends, growth drivers, revenue analysis, and forecast outlook. Our insights help businesses to make data-backed strategic decisions with ongoing market dynamics. Our analysts track relevent industries related to the Lithuania Table linen Market, allowing our clients with actionable intelligence and reliable forecasts tailored to emerging regional needs.
Yes, we provide customisation as per your requirements. To learn more, feel free to contact us on sales@6wresearch.com
1 Executive Summary |
2 Introduction |
2.1 Key Highlights of the Report |
2.2 Report Description |
2.3 Market Scope & Segmentation |
2.4 Research Methodology |
2.5 Assumptions |
3 Lithuania Table linen Market Overview |
3.1 Lithuania Country Macro Economic Indicators |
3.2 Lithuania Table linen Market Revenues & Volume, 2022 & 2032F |
3.3 Lithuania Table linen Market - Industry Life Cycle |
3.4 Lithuania Table linen Market - Porter's Five Forces |
3.5 Lithuania Table linen Market Revenues & Volume Share, By Material, 2022 & 2032F |
3.6 Lithuania Table linen Market Revenues & Volume Share, By Application, 2022 & 2032F |
3.7 Lithuania Table linen Market Revenues & Volume Share, By Distribution Channel, 2022 & 2032F |
4 Lithuania Table linen Market Dynamics |
4.1 Impact Analysis |
4.2 Market Drivers |
4.2.1 Growing trend towards dining out and hosting events in Lithuania |
4.2.2 Increasing demand for high-quality and aesthetically pleasing table linen products |
4.2.3 Rising disposable income leading to higher spending on home decor items |
4.3 Market Restraints |
4.3.1 Intense competition from alternative dining options and home decor products |
4.3.2 Fluctuating raw material prices impacting production costs |
4.3.3 Changing consumer preferences towards more casual dining experiences |
5 Lithuania Table linen Market Trends |
6 Lithuania Table linen Market Segmentations |
6.1 Lithuania Table linen Market, By Material |
6.1.1 Overview and Analysis |
6.1.2 Lithuania Table linen Market Revenues & Volume, By Cotton, 2022 - 2032F |
6.1.3 Lithuania Table linen Market Revenues & Volume, By Artificial Fibers, 2022 - 2032F |
6.1.4 Lithuania Table linen Market Revenues & Volume, By Linen Silk, 2022 - 2032F |
6.1.5 Lithuania Table linen Market Revenues & Volume, By Others, 2022 - 2032F |
6.2 Lithuania Table linen Market, By Application |
6.2.1 Overview and Analysis |
6.2.2 Lithuania Table linen Market Revenues & Volume, By Residential, 2022 - 2032F |
6.2.3 Lithuania Table linen Market Revenues & Volume, By Commercial, 2022 - 2032F |
6.3 Lithuania Table linen Market, By Distribution Channel |
6.3.1 Overview and Analysis |
6.3.2 Lithuania Table linen Market Revenues & Volume, By Hypermarket/Supermarket, 2022 - 2032F |
6.3.3 Lithuania Table linen Market Revenues & Volume, By Specialty Stores, 2022 - 2032F |
6.3.4 Lithuania Table linen Market Revenues & Volume, By Online, 2022 - 2032F |
7 Lithuania Table linen Market Import-Export Trade Statistics |
7.1 Lithuania Table linen Market Export to Major Countries |
7.2 Lithuania Table linen Market Imports from Major Countries |
8 Lithuania Table linen Market Key Performance Indicators |
8.1 Customer satisfaction scores related to the quality and design of table linen products |
8.2 Number of new product launches and innovations in the table linen market |
8.3 Average spending per customer on table linen products |
8.4 Percentage of repeat customers in the table linen market |
8.5 Market penetration rate of table linen products in Lithuania |
9 Lithuania Table linen Market - Opportunity Assessment |
9.1 Lithuania Table linen Market Opportunity Assessment, By Material, 2022 & 2032F |
9.2 Lithuania Table linen Market Opportunity Assessment, By Application, 2022 & 2032F |
9.3 Lithuania Table linen Market Opportunity Assessment, By Distribution Channel, 2022 & 2032F |
10 Lithuania Table linen Market - Competitive Landscape |
10.1 Lithuania Table linen Market Revenue Share, By Companies, 2025 |
10.2 Lithuania Table linen Market Competitive Benchmarking, By Operating and Technical Parameters |
11 Company Profiles |
12 Recommendations | 13 Disclaimer |
Export potential assessment - trade Analytics for 2030
Export potential enables firms to identify high-growth global markets with greater confidence by combining advanced trade intelligence with a structured quantitative methodology. The framework analyzes emerging demand trends and country-level import patterns while integrating macroeconomic and trade datasets such as GDP and population forecasts, bilateral import–export flows, tariff structures, elasticity differentials between developed and developing economies, geographic distance, and import demand projections. Using weighted trade values from 2020–2024 as the base period to project country-to-country export potential for 2030, these inputs are operationalized through calculated drivers such as gravity model parameters, tariff impact factors, and projected GDP per-capita growth. Through an analysis of hidden potentials, demand hotspots, and market conditions that are most favorable to success, this method enables firms to focus on target countries, maximize returns, and global expansion with data, backed by accuracy.
By factoring in the projected importer demand gap that is currently unmet and could be potential opportunity, it identifies the potential for the Exporter (Country) among 190 countries, against the general trade analysis, which identifies the biggest importer or exporter.
To discover high-growth global markets and optimize your business strategy:
Click Here
Pricing
- Single User License$ 1,995
- Department License$ 2,400
- Site License$ 3,120
- Global License$ 3,795

Search
Thought Leadership and Analyst Meet


Our Clients
Latest Reports
- Philippines Polyhydroxybutyrate-co-Hydroxyvalerate Market (2026-2032) | Trends, Insights, Challenges, Restraints, Competition, Size, Value, Forecast, Pricing, Share, Outlook, Revenue, Investment Opportunities, Strategy, Drivers, Demand, Growth, segmentation, Analysis, Companies
- Peru Polyhydroxybutyrate-co-Hydroxyvalerate Market (2026-2032) | Growth, Demand, Challenges, Share, Trends, Analysis, Pricing, Investment Opportunities, Drivers, Value, Forecast, Competition, Size, Companies, Insights, Outlook, Restraints, segmentation, Revenue, Strategy
- Pakistan Polyhydroxybutyrate-co-Hydroxyvalerate Market (2026-2032) | Restraints, segmentation, Pricing, Forecast, Share, Strategy, Competition, Trends, Insights, Drivers, Challenges, Growth, Revenue, Outlook, Value, Investment Opportunities, Companies, Size, Analysis, Demand
- Oman Polyhydroxybutyrate-co-Hydroxyvalerate Market (2026-2032) | Drivers, segmentation, Insights, Competition, Pricing, Outlook, Size, Revenue, Challenges, Forecast, Analysis, Growth, Value, Share, Trends, Investment Opportunities, Strategy, Restraints, Companies, Demand
- Nigeria Polyhydroxybutyrate-co-Hydroxyvalerate Market (2026-2032) | Value, Investment Opportunities, Analysis, Revenue, Restraints, Pricing, Outlook, Competition, Demand, Growth, Forecast, Companies, Trends, Challenges, segmentation, Drivers, Insights, Share, Size, Strategy
- Nepal Polyhydroxybutyrate-co-Hydroxyvalerate Market (2026-2032) | Insights, Analysis, Drivers, Share, Revenue, Demand, segmentation, Investment Opportunities, Competition, Forecast, Growth, Pricing, Companies, Strategy, Trends, Restraints, Challenges, Outlook, Size, Value
- Myanmar Polyhydroxybutyrate-co-Hydroxyvalerate Market (2026-2032) | Outlook, Revenue, Strategy, Restraints, Drivers, segmentation, Share, Forecast, Competition, Insights, Growth, Pricing, Size, Demand, Value, Companies, Trends, Challenges, Investment Opportunities, Analysis
- Morocco Polyhydroxybutyrate-co-Hydroxyvalerate Market (2026-2032) | Outlook, Investment Opportunities, Restraints, Strategy, Forecast, Challenges, Drivers, Growth, Companies, segmentation, Trends, Size, Competition, Revenue, Demand, Insights, Share, Analysis, Value, Pricing
- Mexico Polyhydroxybutyrate-co-Hydroxyvalerate Market (2026-2032) | Size, Drivers, Outlook, Share, Strategy, Growth, Pricing, Challenges, Companies, Demand, Value, Investment Opportunities, Restraints, Trends, Forecast, segmentation, Analysis, Insights, Competition, Revenue
- Malaysia Polyhydroxybutyrate-co-Hydroxyvalerate Market (2026-2032) | Share, segmentation, Size, Companies, Analysis, Insights, Forecast, Value, Revenue, Drivers, Restraints, Challenges, Investment Opportunities, Trends, Competition, Strategy, Demand, Growth, Outlook, Pricing
Industry Events and Analyst Meet

HIMTEX 2026

India Refining Summit 2026

India EV Show 2026

EV tech India Expo 2026

Auto Tech Asia 2026
Whitepaper
- Middle East & Africa Commercial Security Market Click here to view more.
- Middle East & Africa Fire Safety Systems & Equipment Market Click here to view more.
- GCC Drone Market Click here to view more.
- Middle East Lighting Fixture Market Click here to view more.
- GCC Physical & Perimeter Security Market Click here to view more.
6WResearch In News
- Doha a strategic location for EV manufacturing hub: IPA Qatar
- Demand for luxury TVs surging in the GCC, says Samsung
- Empowering Growth: The Thriving Journey of Bangladesh’s Cable Industry
- Demand for luxury TVs surging in the GCC, says Samsung
- Video call with a traditional healer? Once unthinkable, it’s now common in South Africa
- Intelligent Buildings To Smooth GCC’s Path To Net Zero