Lithuania Talcum Powder Market (2024-2030) | Size, Industry, Segmentation, Value, Growth, Analysis, Outlook, Trends, Companies, Share, Revenue & Forecast
Market Forecast By Type (Cosmetics Grade, Paper Grade, Waterproofing Grade, Coatings Grade, Plastic Grade, Others), By Application (Paints & Coatings, Plastic & Rubber, Personal Care, Others) And Competitive Landscape
| Product Code: ETC5324448 | Publication Date: Nov 2023 | Updated Date: Apr 2026 | Product Type: Market Research Report | |
| Publisher: 6Wresearch | Author: Ravi Bhandari | No. of Pages: 60 | No. of Figures: 30 | No. of Tables: 5 |
Lithuania Talcum Powder Market Size (2020-2030)
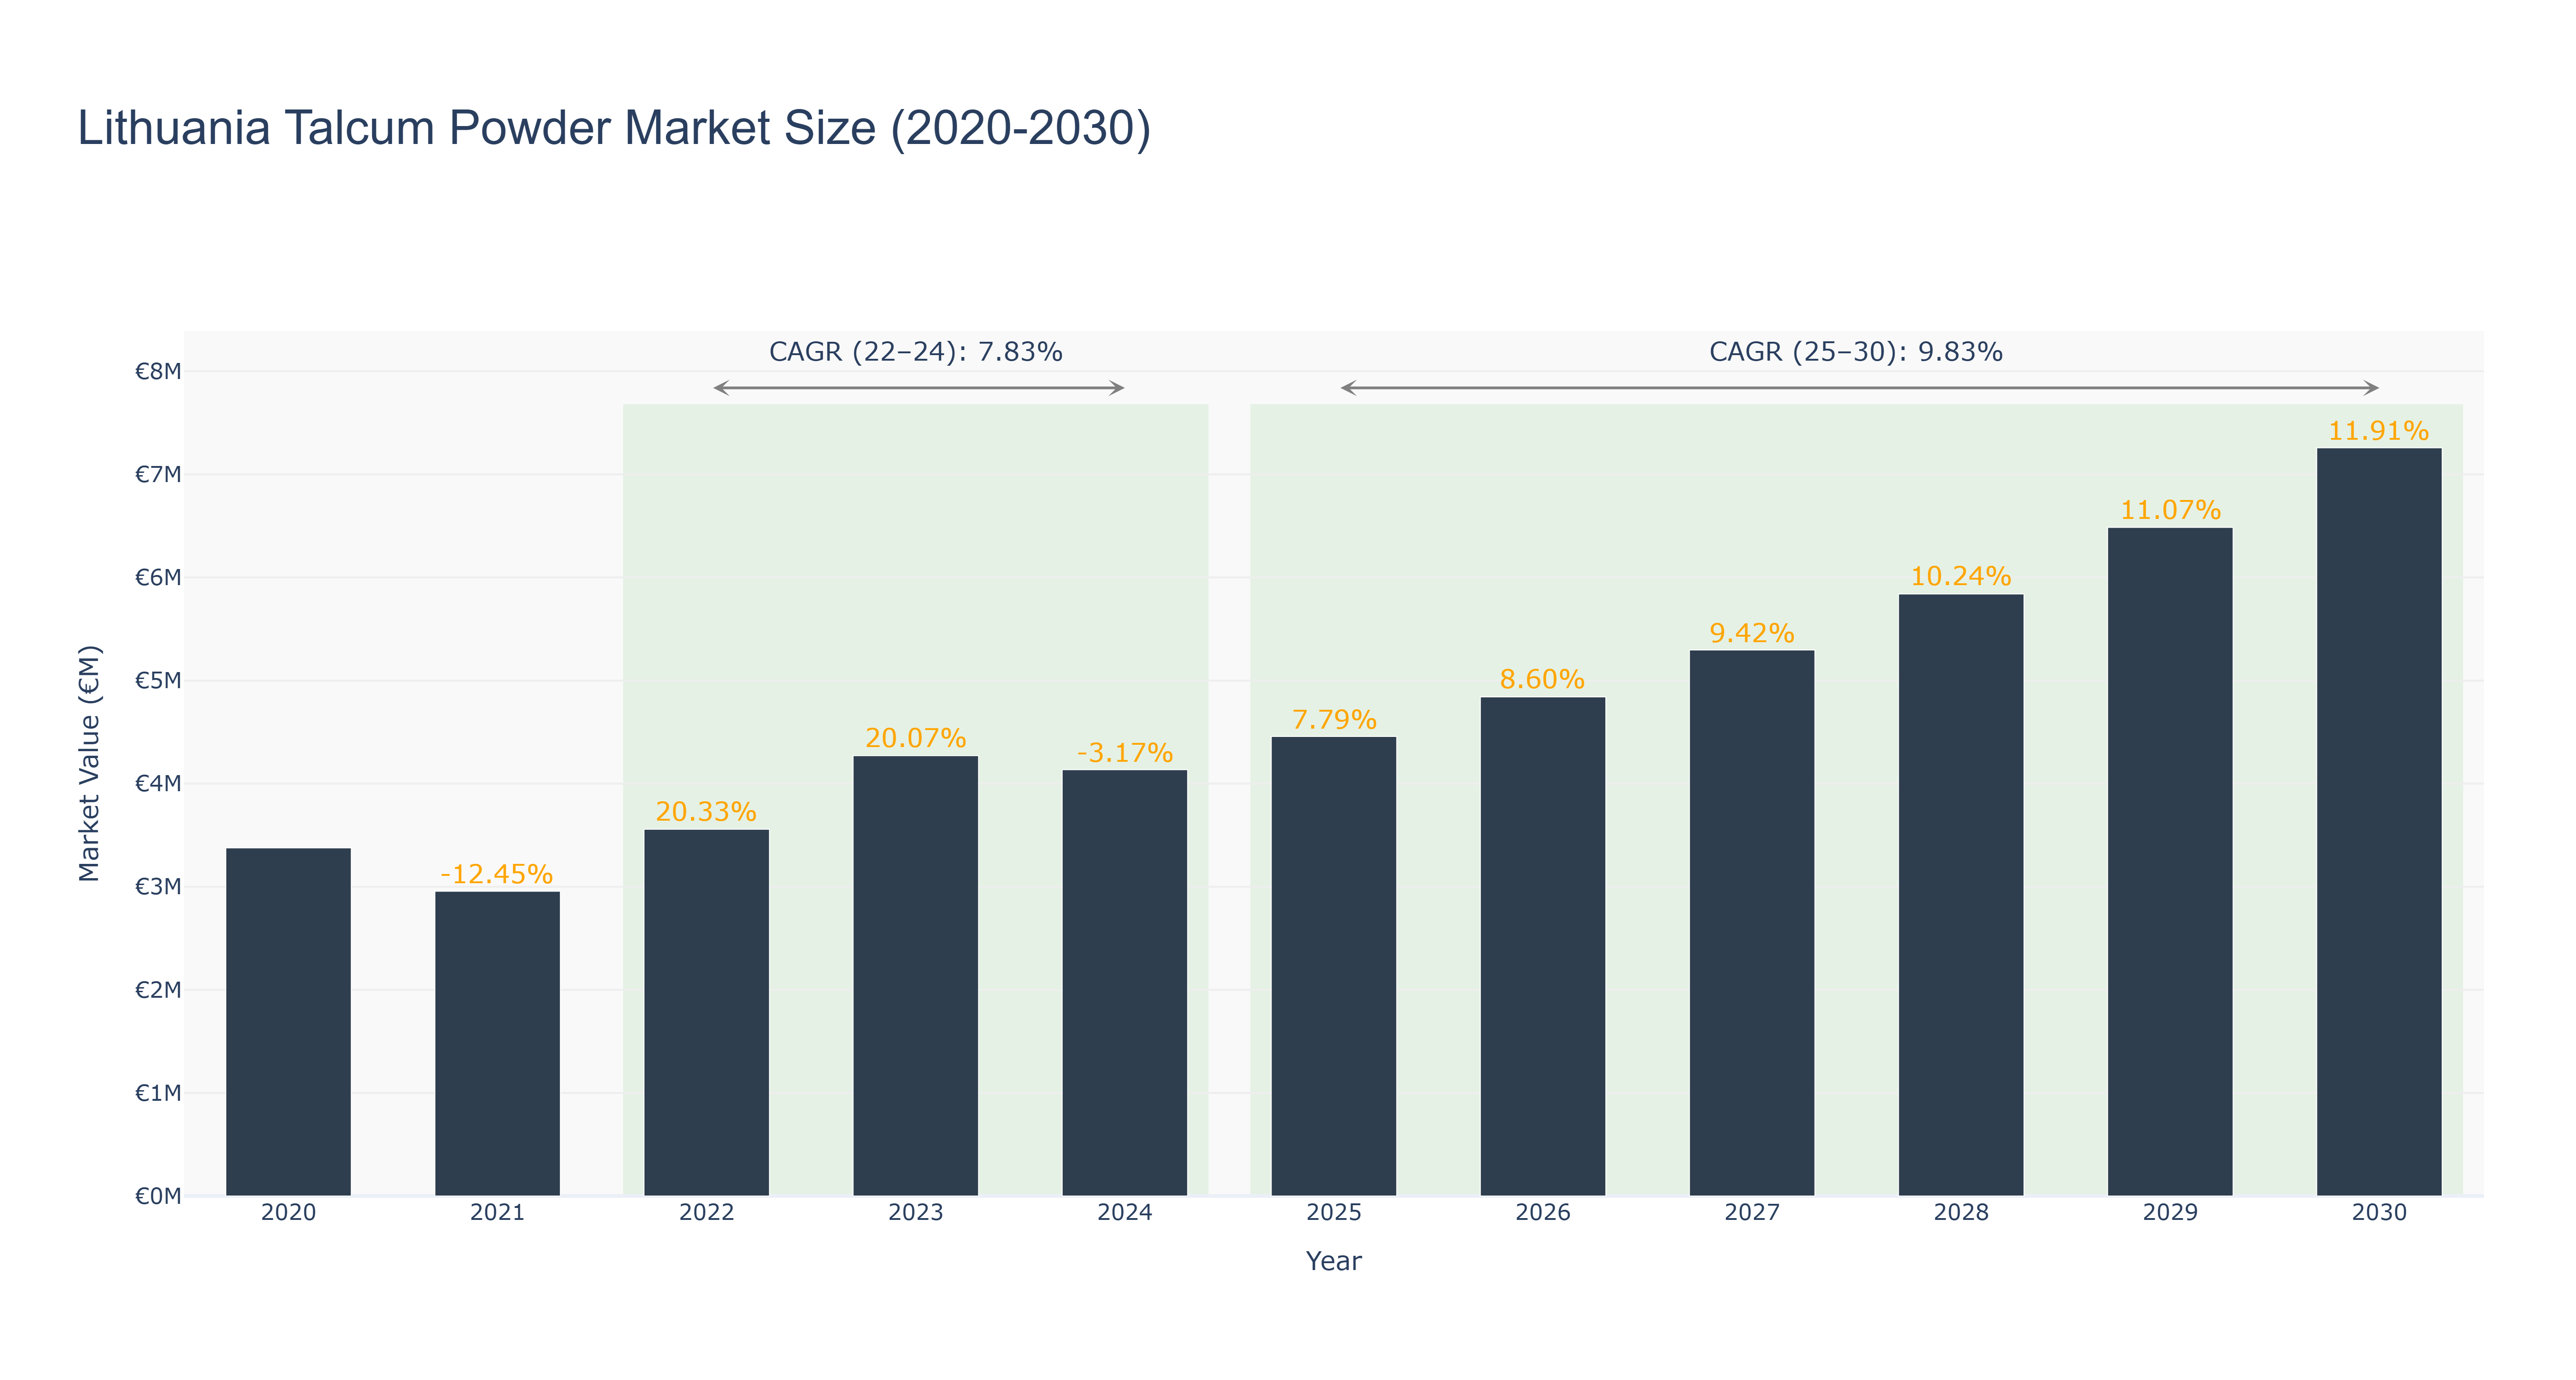
The Lithuania Talcum Powder Market has shown a fluctuating trend over the years. The market peaked at €7.26 million in 2030, with a steady growth rate. From 2020 to 2024, the market experienced a slight decline from €3.38 million to €4.14 million, attributed to changing consumer preferences and economic conditions. However, a significant rebound occurred from 2025 to 2030, with a forecasted market size of €7.26 million, driven by increased product innovation and expanding distribution channels. The CAGR for the period 2022-24 stands at 7.83%, while for 2025-30, it is projected at 9.83%. Recent developments in the market include partnerships with local retailers to enhance product visibility and the launch of eco-friendly packaging options to cater to the growing sustainability trend. Looking ahead, the market is poised for further growth with upcoming investments in digital marketing strategies to reach a wider consumer base.
Lithuania Talcum Powder Market: Production & Trade Performance (2019-2025)
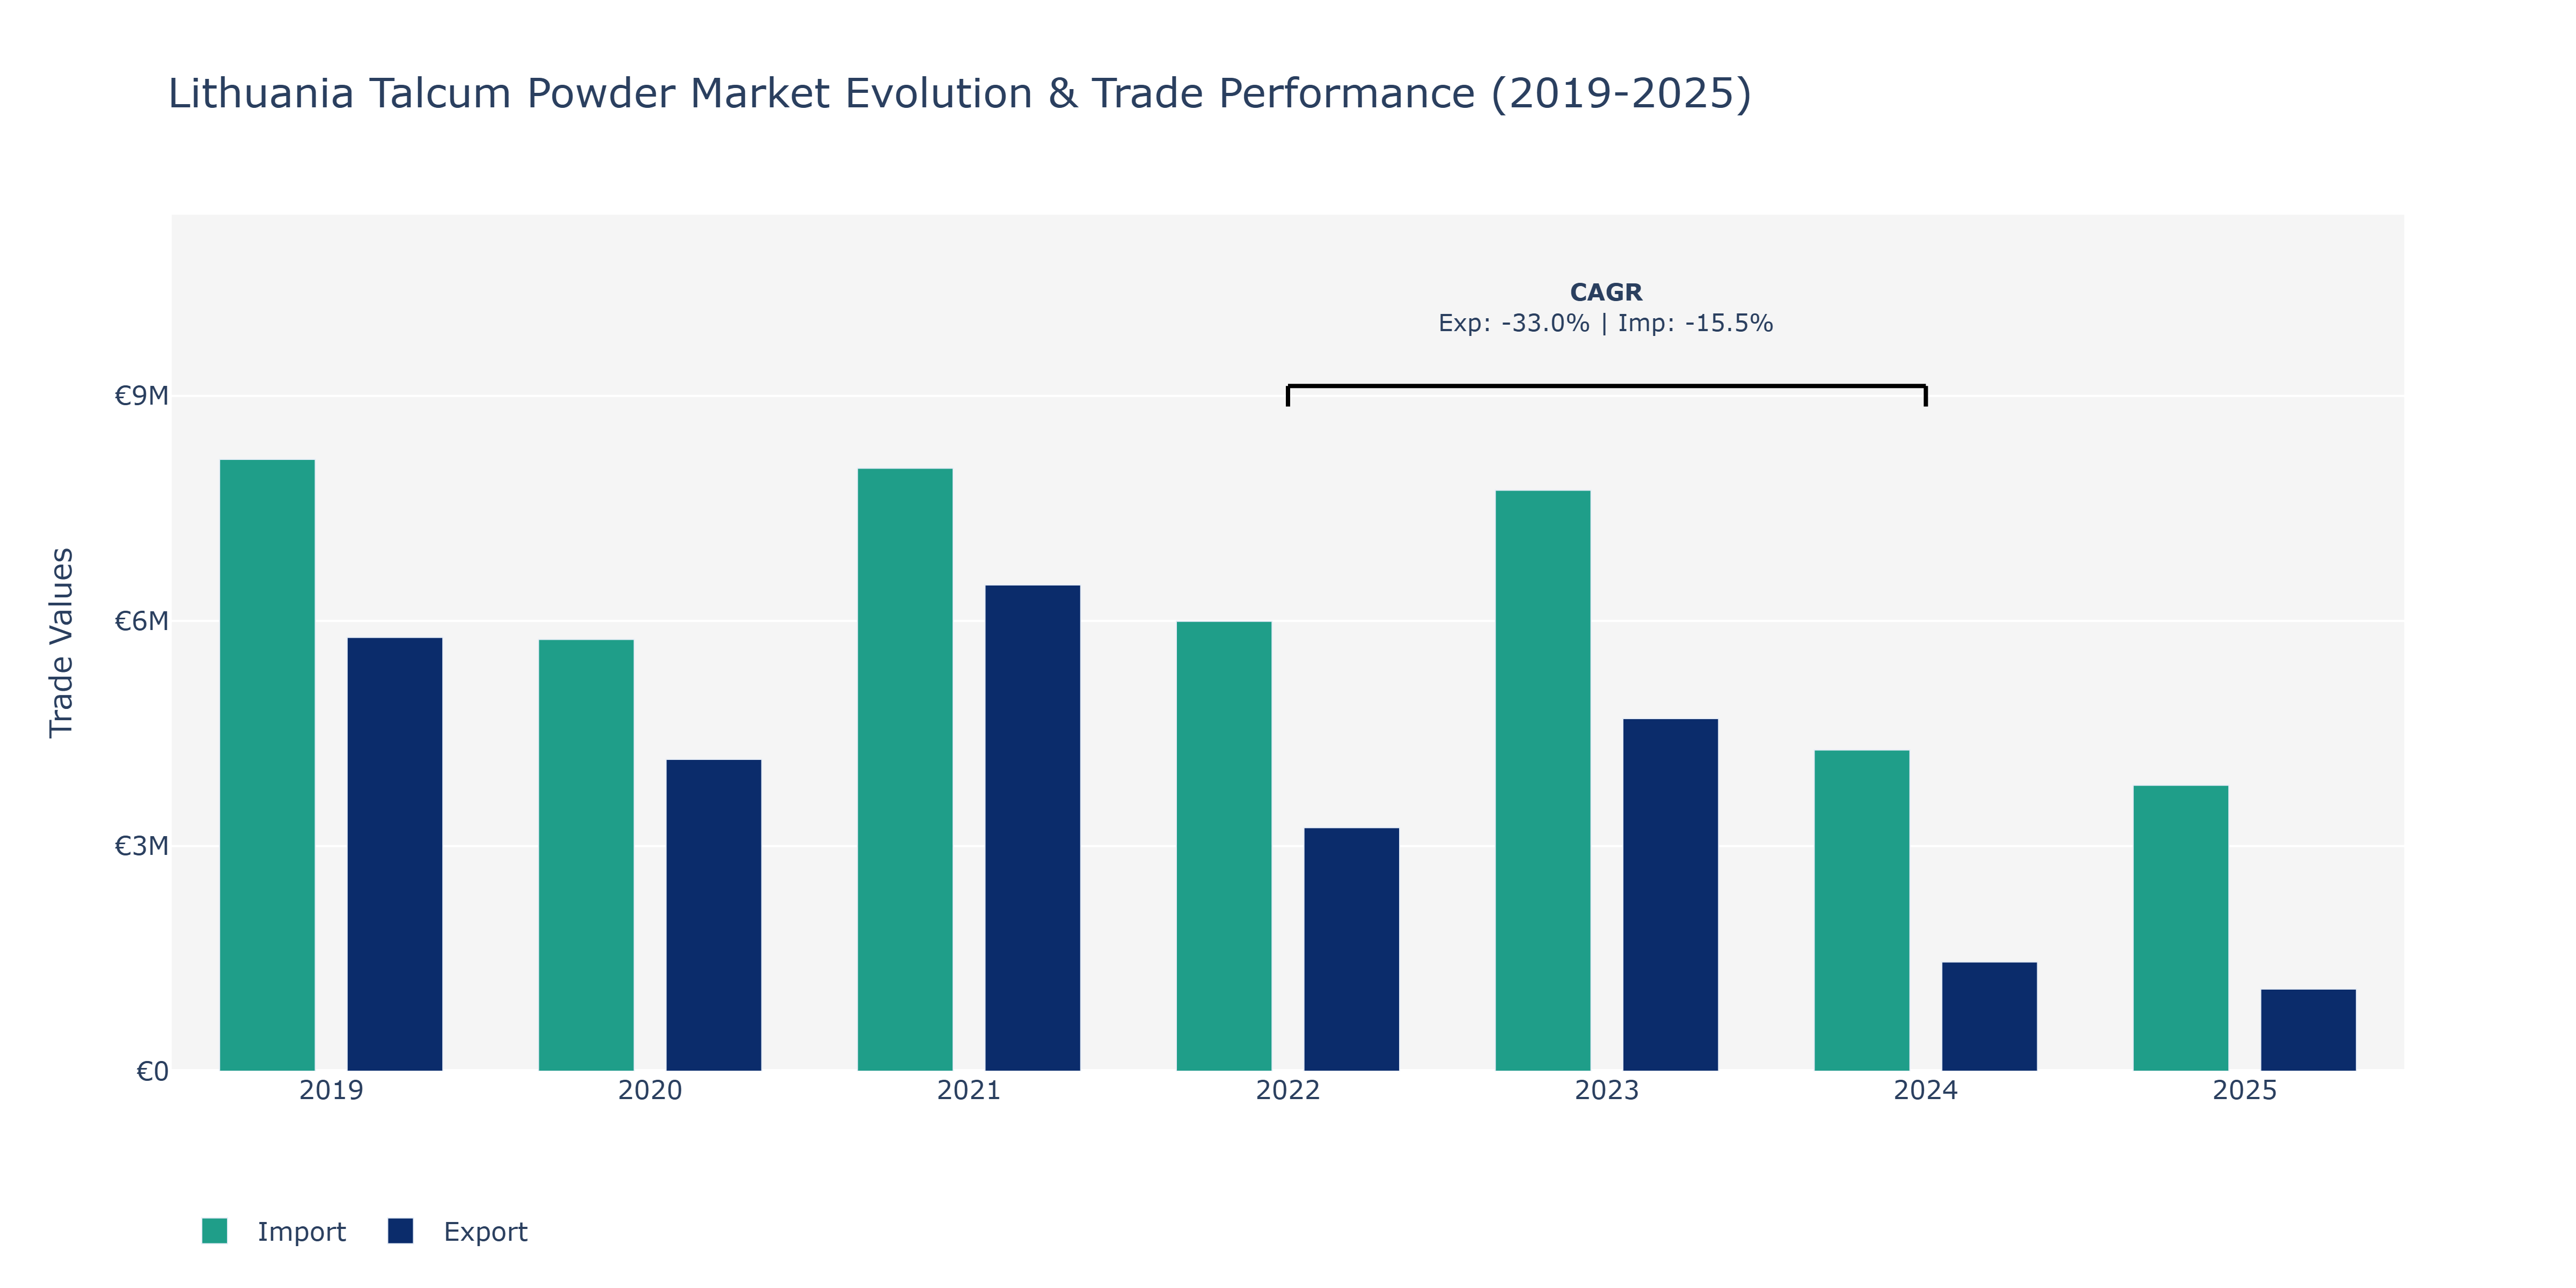
Between 2019 and 2025, Lithuania's Talcum Powder Market showed varying trends in both exports and imports. In 2019, exports were at €5.78 million, declining to €1.46 million in 2024 before slightly recovering to €1.09 million in 2025. Conversely, imports started at €8.15 million in 2019, decreased to €4.28 million in 2024, and further dropped to €3.81 million in 2025. The market experienced a significant decline in exports from 2019 to 2024, potentially influenced by changes in consumer preferences, production issues, or global market conditions. Import decreases could reflect shifts in supplier relationships, cost considerations, or fluctuations in demand. These fluctuations may necessitate market players to reassess their strategies to adapt to changing market dynamics, potentially focusing on product innovation or exploring new markets to drive growth in the coming years.
Lithuania Talcum Powder Market Competition 2023
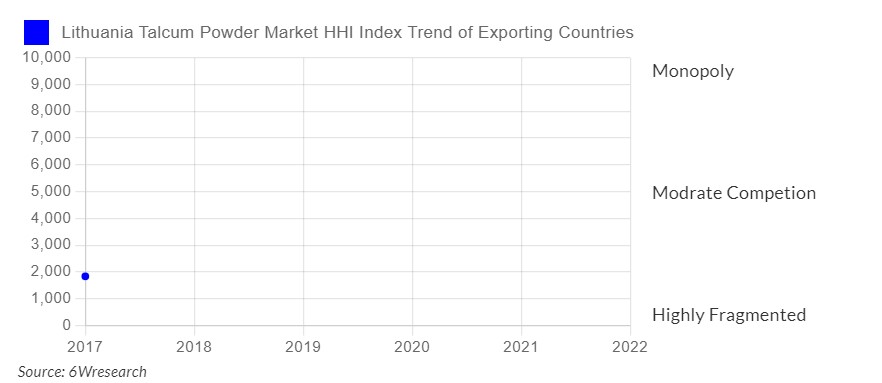
Note: The HHI Index which is also known as the Herfindahl–Hirschman index measures the competition in the country. HHI which is lower than 1500 signifies high competitiveness, 1500-2500 shows moderate competition and 2500-6000 means concentrated and more than 6000 means highly concentrated.
In 2023, Lithuania Talcum Powder Market witnessed an HHI of 1836, and it has risen at a moderate growth as compared to the HHI of 0 in 2017. The herfindahl index measures the competitiveness of exporting countries and the range lies from 0 to 10000, where a lower index number represents a larger number of players or exporting countries in the market while a large index number means fewer numbers of players or countries exporting in the market.
Lithuania Export Potential Assessment For Talcum Powder Market (USD Values in Thousand)
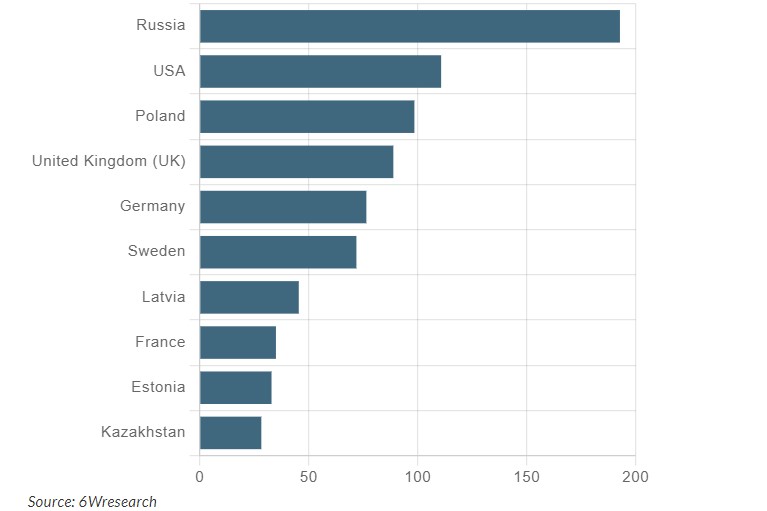
Note: Export capabilities is calculated by considering trade relations, duties, distance, tariffs, total import demand, and GDP growth projection from IMF World Economic Outlook.
Russia is likely to be the perfect market for Lithuania Exporters of Talcum Powder (in 2028) based on export potential followed by USA, Poland, United Kingdom (UK) and Germany. On the basis of total import demand across all countries, the USA inhabits the top position. Hence considering overall import demand, the USA dominates the importing demand but considering Lithuania as a partner, Russia delivers high unmet demand potential as Compared to others for 2028.
Key Highlights of the Report:
- Lithuania Talcum Powder Market Outlook
- Market Size of Lithuania Talcum Powder Market, 2023
- Forecast of Lithuania Talcum Powder Market, 2030
- Historical Data and Forecast of Lithuania Talcum Powder Revenues & Volume for the Period 2020-2030
- Lithuania Talcum Powder Market Trend Evolution
- Lithuania Talcum Powder Market Drivers and Challenges
- Lithuania Talcum Powder Price Trends
- Lithuania Talcum Powder Porter`s Five Forces
- Lithuania Talcum Powder Industry Life Cycle
- Historical Data and Forecast of Lithuania Talcum Powder Market Revenues & Volume By Type for the Period 2020-2030
- Historical Data and Forecast of Lithuania Talcum Powder Market Revenues & Volume By Cosmetics Grade for the Period 2020-2030
- Historical Data and Forecast of Lithuania Talcum Powder Market Revenues & Volume By Paper Grade for the Period 2020-2030
- Historical Data and Forecast of Lithuania Talcum Powder Market Revenues & Volume By Waterproofing Grade for the Period 2020-2030
- Historical Data and Forecast of Lithuania Talcum Powder Market Revenues & Volume By Coatings Grade for the Period 2020-2030
- Historical Data and Forecast of Lithuania Talcum Powder Market Revenues & Volume By Plastic Grade for the Period 2020-2030
- Historical Data and Forecast of Lithuania Talcum Powder Market Revenues & Volume By Others for the Period 2020-2030
- Historical Data and Forecast of Lithuania Talcum Powder Market Revenues & Volume By Application for the Period 2020-2030
- Historical Data and Forecast of Lithuania Talcum Powder Market Revenues & Volume By Paints & Coatings for the Period 2020-2030
- Historical Data and Forecast of Lithuania Talcum Powder Market Revenues & Volume By Plastic & Rubber for the Period 2020-2030
- Historical Data and Forecast of Lithuania Talcum Powder Market Revenues & Volume By Personal Care for the Period 2020-2030
- Historical Data and Forecast of Lithuania Talcum Powder Market Revenues & Volume By Others for the Period 2020-2030
- Lithuania Talcum Powder Import Export Trade Statistics
- Market Opportunity Assessment By Type
- Market Opportunity Assessment By Application
- Lithuania Talcum Powder Top Companies Market Share
- Lithuania Talcum Powder Competitive Benchmarking By Technical and Operational Parameters
- Lithuania Talcum Powder Company Profiles
- Lithuania Talcum Powder Key Strategic Recommendations
Frequently Asked Questions About the Market Study (FAQs):
6Wresearch actively monitors the Lithuania Talcum Powder Market and publishes its comprehensive annual report, highlighting emerging trends, growth drivers, revenue analysis, and forecast outlook. Our insights help businesses to make data-backed strategic decisions with ongoing market dynamics. Our analysts track relevent industries related to the Lithuania Talcum Powder Market, allowing our clients with actionable intelligence and reliable forecasts tailored to emerging regional needs.
Yes, we provide customisation as per your requirements. To learn more, feel free to contact us on sales@6wresearch.com
13 Disclaimer
|
1 Executive Summary |
|
2 Introduction |
|
2.1 Key Highlights of the Report |
|
2.2 Report Description |
|
2.3 Market Scope & Segmentation |
|
2.4 Research Methodology |
|
2.5 Assumptions |
|
3 Lithuania Talcum Powder Market Overview |
|
3.1 Lithuania Country Macro Economic Indicators |
|
3.2 Lithuania Talcum Powder Market Revenues & Volume, 2020 & 2030F |
|
3.3 Lithuania Talcum Powder Market - Industry Life Cycle |
|
3.4 Lithuania Talcum Powder Market - Porter's Five Forces |
|
3.5 Lithuania Talcum Powder Market Revenues & Volume Share, By Type, 2020 & 2030F |
|
3.6 Lithuania Talcum Powder Market Revenues & Volume Share, By Application, 2020 & 2030F |
|
4 Lithuania Talcum Powder Market Dynamics |
|
4.1 Impact Analysis |
|
4.2 Market Drivers |
|
4.2.1 Increasing awareness about personal hygiene and grooming practices |
|
4.2.2 Growing demand for talcum powder in cosmetic and personal care products |
|
4.2.3 Rising disposable income leading to higher spending on personal care products |
|
4.3 Market Restraints |
|
4.3.1 Health concerns associated with the use of talcum powder, such as potential links to cancer |
|
4.3.2 Regulatory restrictions and bans on certain talcum powder ingredients |
|
4.3.3 Competition from alternative products like cornstarch-based powders |
|
5 Lithuania Talcum Powder Market Trends |
|
6 Lithuania Talcum Powder Market Segmentations |
|
6.1 Lithuania Talcum Powder Market, By Type |
|
6.1.1 Overview and Analysis |
|
6.1.2 Lithuania Talcum Powder Market Revenues & Volume, By Cosmetics Grade, 2020-2030F |
|
6.1.3 Lithuania Talcum Powder Market Revenues & Volume, By Paper Grade, 2020-2030F |
|
6.1.4 Lithuania Talcum Powder Market Revenues & Volume, By Waterproofing Grade, 2020-2030F |
|
6.1.5 Lithuania Talcum Powder Market Revenues & Volume, By Coatings Grade, 2020-2030F |
|
6.1.6 Lithuania Talcum Powder Market Revenues & Volume, By Plastic Grade, 2020-2030F |
|
6.1.7 Lithuania Talcum Powder Market Revenues & Volume, By Others, 2020-2030F |
|
6.2 Lithuania Talcum Powder Market, By Application |
|
6.2.1 Overview and Analysis |
|
6.2.2 Lithuania Talcum Powder Market Revenues & Volume, By Paints & Coatings, 2020-2030F |
|
6.2.3 Lithuania Talcum Powder Market Revenues & Volume, By Plastic & Rubber, 2020-2030F |
|
6.2.4 Lithuania Talcum Powder Market Revenues & Volume, By Personal Care, 2020-2030F |
|
6.2.5 Lithuania Talcum Powder Market Revenues & Volume, By Others, 2020-2030F |
|
7 Lithuania Talcum Powder Market Import-Export Trade Statistics |
|
7.1 Lithuania Talcum Powder Market Export to Major Countries |
|
7.2 Lithuania Talcum Powder Market Imports from Major Countries |
|
8 Lithuania Talcum Powder Market Key Performance Indicators |
8.1 Consumer satisfaction and loyalty metrics |
8.2 Market penetration rate in the target demographic |
8.3 Product innovation and development rate |
8.4 Brand reputation and awareness metrics |
8.5 Environmental sustainability practices and compliance metrics |
|
9 Lithuania Talcum Powder Market - Opportunity Assessment |
|
9.1 Lithuania Talcum Powder Market Opportunity Assessment, By Type, 2020 & 2030F |
|
9.2 Lithuania Talcum Powder Market Opportunity Assessment, By Application, 2020 & 2030F |
|
10 Lithuania Talcum Powder Market - Competitive Landscape |
|
10.1 Lithuania Talcum Powder Market Revenue Share, By Companies, 2023 |
|
10.2 Lithuania Talcum Powder Market Competitive Benchmarking, By Operating and Technical Parameters |
|
11 Company Profiles |
|
12 Recommendations |
Global Go To Market Strategy - 2030
Export potential enables firms to identify high-growth global markets with greater confidence by combining advanced trade intelligence with a structured quantitative methodology. The framework analyzes emerging demand trends and country-level import patterns while integrating macroeconomic and trade datasets such as GDP and population forecasts, bilateral import–export flows, tariff structures, elasticity differentials between developed and developing economies, geographic distance, and import demand projections. Using weighted trade values from 2020–2024 as the base period to project country-to-country export potential for 2030, these inputs are operationalized through calculated drivers such as gravity model parameters, tariff impact factors, and projected GDP per-capita growth. Through an analysis of hidden potentials, demand hotspots, and market conditions that are most favorable to success, this method enables firms to focus on target countries, maximize returns, and global expansion with data, backed by accuracy.
By factoring in the projected importer demand gap that is currently unmet and could be potential opportunity, it identifies the potential for the Exporter (Country) among 190 countries, against the general trade analysis, which identifies the biggest importer or exporter.
To discover high-growth global markets and optimize your business strategy:
Click Here
Pricing
- Single User License$ 1,995
- Department License$ 2,400
- Site License$ 3,120
- Global License$ 3,795

Leadership Perspectives from Industry Events
Search
Thought Leadership and Analyst Meet


Our Clients
6WResearch In News
- India Export Attractiveness Tracker 2026
- India Air Conditioner Market Set for Strong Rebound in 2026 After Weather-Led Correction and GST-Driven Recovery: 6Wresearch
- ADAS in India: How Automatic Emergency Braking, Blind Spot Detection & Driver Monitoring are Transforming Road Safety
- Doha a strategic location for EV manufacturing hub: IPA Qatar
- Demand for luxury TVs surging in the GCC, says Samsung
- Empowering Growth: The Thriving Journey of Bangladesh’s Cable Industry
Latest Reports
- Nicaragua RPG Gaming Market (2026-2032)
- New Zealand RPG Gaming Market (2026-2032)
- Netherlands RPG Gaming Market (2026-2032)
- Nauru RPG Gaming Market (2026-2032)
- Namibia RPG Gaming Market (2026-2032)
- Mozambique RPG Gaming Market (2026-2032)
- Montenegro RPG Gaming Market (2026-2032)
- Mongolia RPG Gaming Market (2026-2032)
- Monaco RPG Gaming Market (2026-2032)
- Micronesia RPG Gaming Market (2026-2032)
Industry Events and Analyst Meet

EV India Expo 2026

HIMTEX 2026

India Refining Summit 2026

India EV Show 2026

EV tech India Expo 2026
Whitepaper
- Middle East & Africa Commercial Security Market Click here to view more.
- Middle East & Africa Fire Safety Systems & Equipment Market Click here to view more.
- GCC Drone Market Click here to view more.
- Middle East Lighting Fixture Market Click here to view more.
- GCC Physical & Perimeter Security Market Click here to view more.