Lithuania Tinned Copper Bar Market (2025-2031) | Value, Analysis, Trends, Growth, Industry, Outlook, Companies, Segmentation, Share, Size, Revenue & Forecast
Market Forecast By Type (Full Round, Slightly Round Edge, Square), By Application (Electrical Conductor, Induction Motors, Earthing, Lightning Protection, General Engineering, Switch Gears, Others) And Competitive Landscape
| Product Code: ETC5148888 | Publication Date: Nov 2023 | Updated Date: Apr 2026 | Product Type: Market Research Report | |
| Publisher: 6Wresearch | Author: Shubham Padhi | No. of Pages: 60 | No. of Figures: 30 | No. of Tables: 5 |
Lithuania Tinned Copper Bar Market Size (2020-2030)
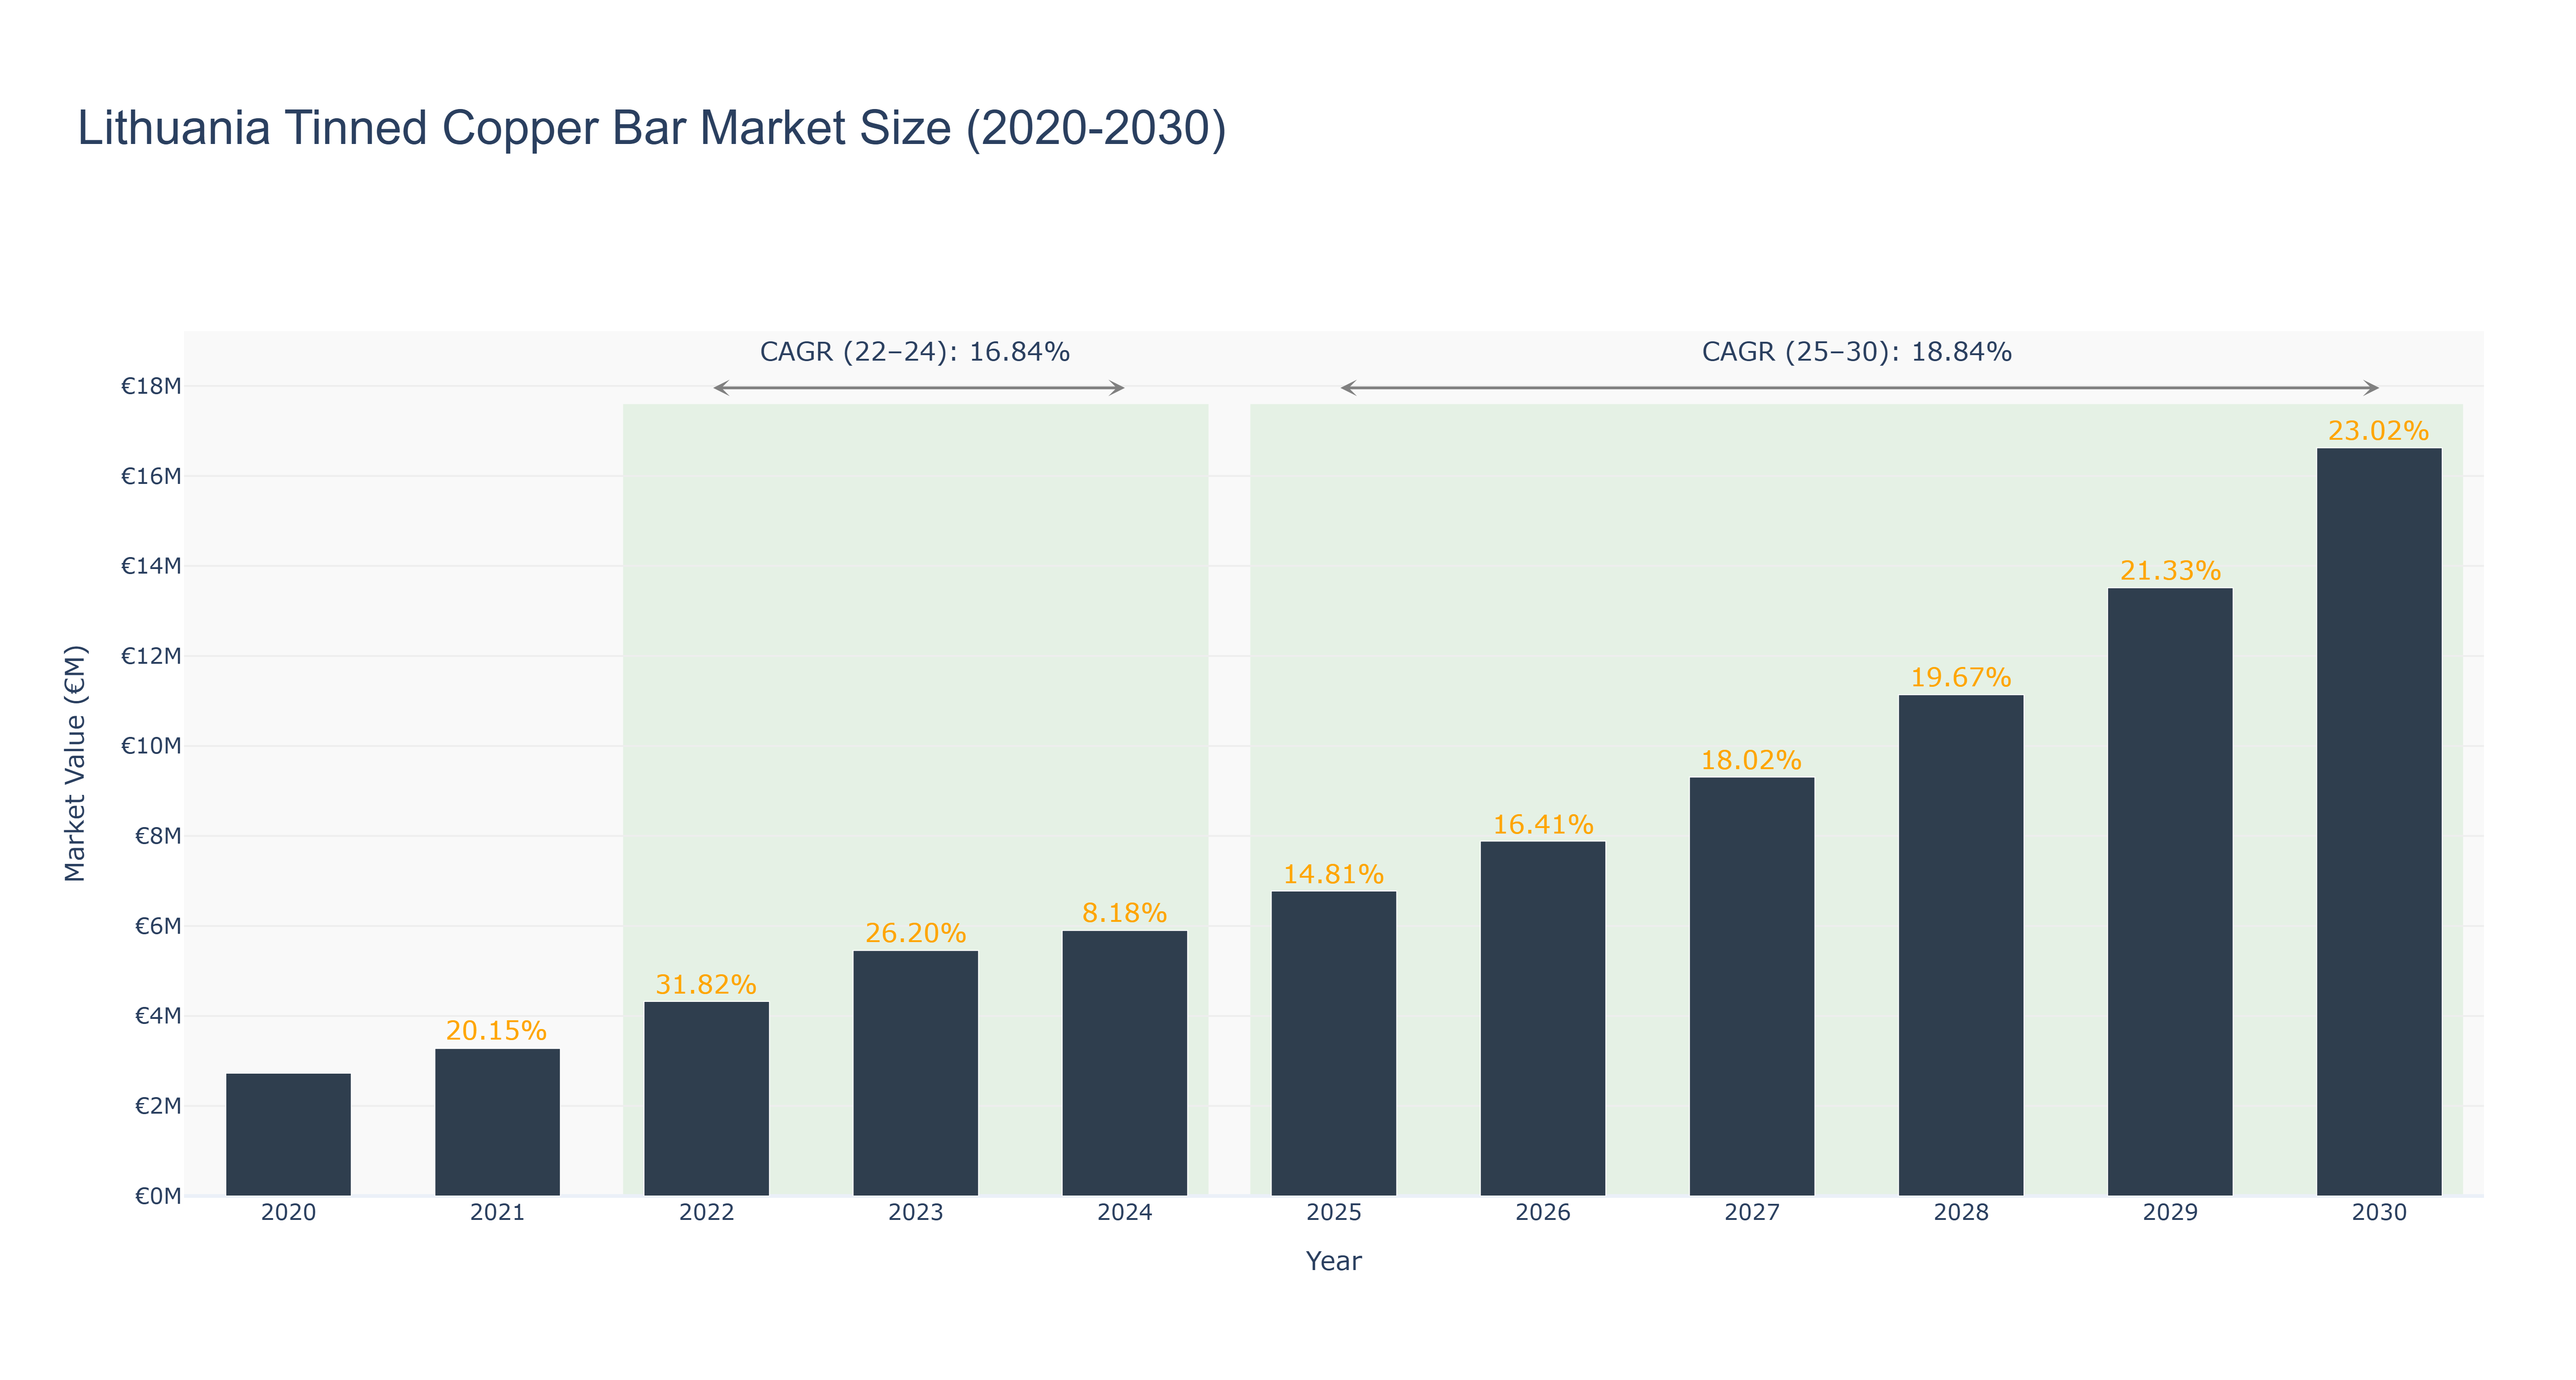
The Lithuania Tinned Copper Bar Market has demonstrated significant growth, peaking at a market size of €5.90 million in 2024, with actual values ranging from €2.73 million in 2020 to €5.46 million in 2023, reflecting a robust CAGR of 16.84% from 2022 to 2024. This growth can be attributed to increasing industrial applications of copper, heightened demand for electrical components, and a shift toward sustainable materials. Looking forward, the forecast from 2025 to 2030 projects a continued upward trajectory, with market size anticipated to reach €16.63 million by 2030, driven by a CAGR of 18.84%. Factors such as advancements in technology, infrastructure projects, and a growing focus on renewable energy are expected to bolster this market further. As Lithuania continues to invest in its industrial capabilities, the tinned copper bar market is poised for substantial expansion in the coming years.
Lithuania Tinned Copper Bar Market: Production & Trade Performance (2019-2025)
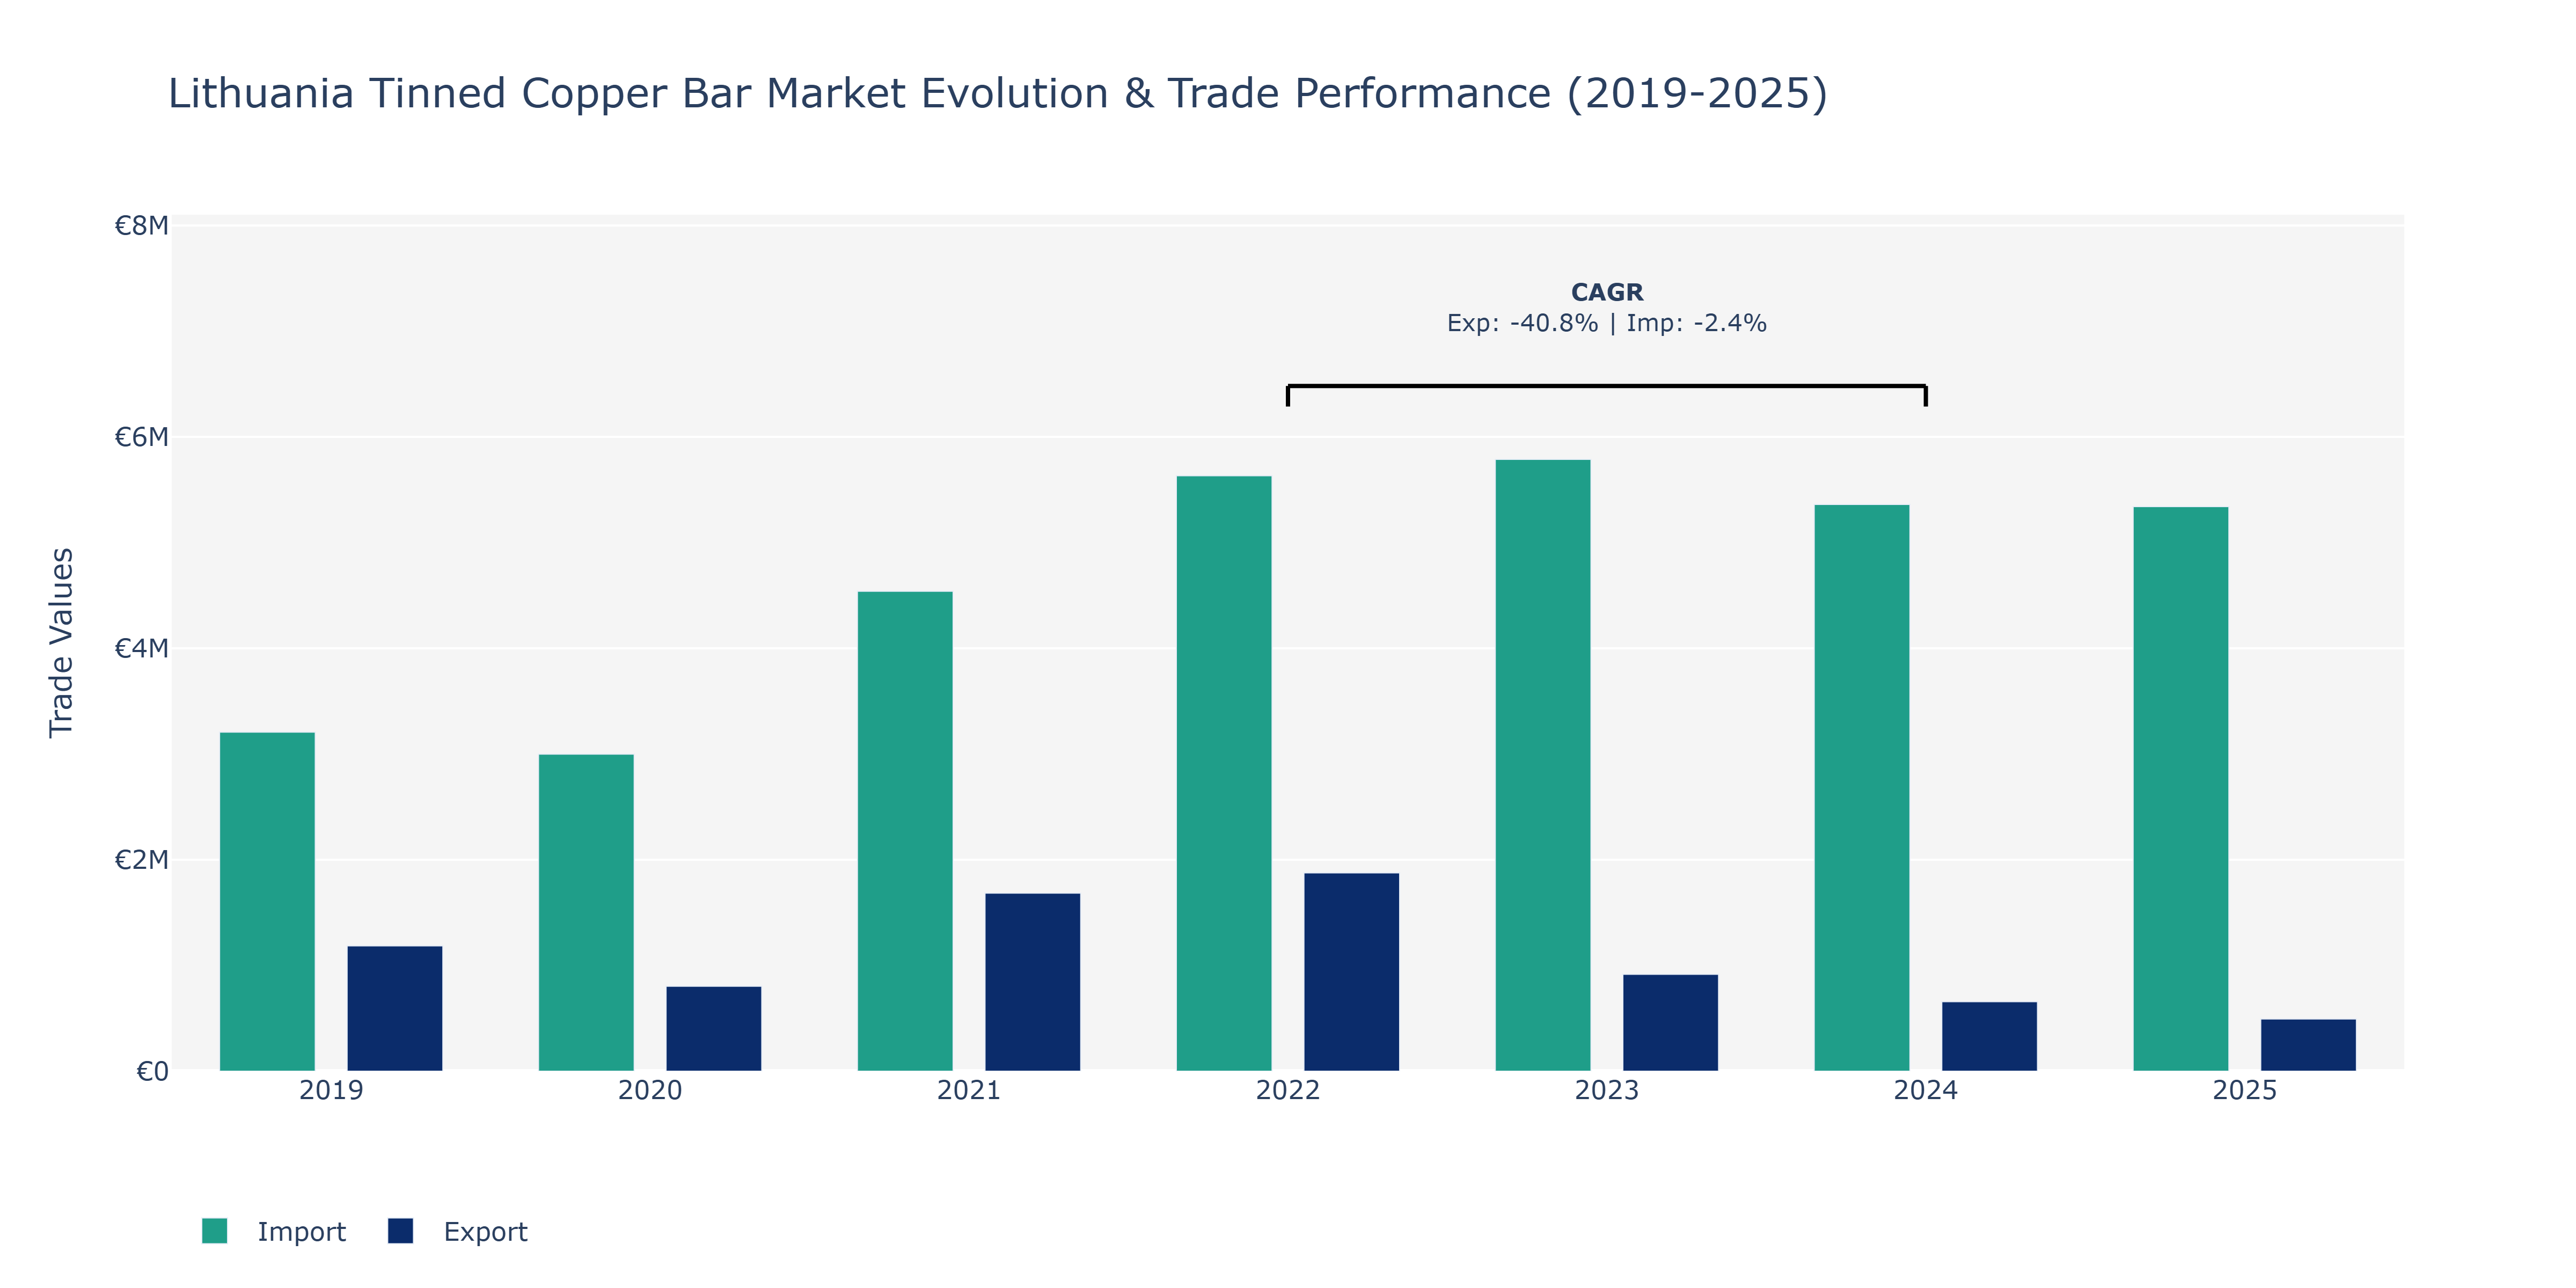
Lithuania's Tinned Copper Bar Market experienced varying trends in exports and imports from 2019 to 2025. Exports saw a decline from €1.18 million in 2019 to €493.96 thousand in 2025, attributing to the market's reduced global competitiveness or shifting demands. In contrast, imports surged from €3.21 million in 2019 to €5.78 million in 2023, possibly driven by increased domestic consumption or booming industrial activities. The peak in imports coincided with the peak in exports in 2023, hinting at a period of heightened trade activity. The market's erratic performance may have been influenced by fluctuating metal prices, global trade policies impacting supply chains, or technological advancements altering market dynamics. Lithuania's market players should closely monitor these trends to adapt strategies in response to evolving market conditions and maintain a competitive edge.
Key Highlights of the Report:
- Lithuania Tinned Copper Bar Market Outlook
- Market Size of Lithuania Tinned Copper Bar Market, 2024
- Forecast of Lithuania Tinned Copper Bar Market, 2031
- Historical Data and Forecast of Lithuania Tinned Copper Bar Revenues & Volume for the Period 2021-2031
- Lithuania Tinned Copper Bar Market Trend Evolution
- Lithuania Tinned Copper Bar Market Drivers and Challenges
- Lithuania Tinned Copper Bar Price Trends
- Lithuania Tinned Copper Bar Porter`s Five Forces
- Lithuania Tinned Copper Bar Industry Life Cycle
- Historical Data and Forecast of Lithuania Tinned Copper Bar Market Revenues & Volume By Type for the Period 2021-2031
- Historical Data and Forecast of Lithuania Tinned Copper Bar Market Revenues & Volume By Full Round for the Period 2021-2031
- Historical Data and Forecast of Lithuania Tinned Copper Bar Market Revenues & Volume By Slightly Round Edge for the Period 2021-2031
- Historical Data and Forecast of Lithuania Tinned Copper Bar Market Revenues & Volume By Square for the Period 2021-2031
- Historical Data and Forecast of Lithuania Tinned Copper Bar Market Revenues & Volume By Application for the Period 2021-2031
- Historical Data and Forecast of Lithuania Tinned Copper Bar Market Revenues & Volume By Electrical Conductor for the Period 2021-2031
- Historical Data and Forecast of Lithuania Tinned Copper Bar Market Revenues & Volume By Induction Motors for the Period 2021-2031
- Historical Data and Forecast of Lithuania Tinned Copper Bar Market Revenues & Volume By Earthing for the Period 2021-2031
- Historical Data and Forecast of Lithuania Tinned Copper Bar Market Revenues & Volume By Lightning Protection for the Period 2021-2031
- Historical Data and Forecast of Lithuania Tinned Copper Bar Market Revenues & Volume By General Engineering for the Period 2021-2031
- Historical Data and Forecast of Lithuania Tinned Copper Bar Market Revenues & Volume By Switch Gears for the Period 2021-2031
- Historical Data and Forecast of Lithuania Tinned Copper Bar Market Revenues & Volume By Others for the Period 2021-2031
- Lithuania Tinned Copper Bar Import Export Trade Statistics
- Market Opportunity Assessment By Type
- Market Opportunity Assessment By Application
- Lithuania Tinned Copper Bar Top Companies Market Share
- Lithuania Tinned Copper Bar Competitive Benchmarking By Technical and Operational Parameters
- Lithuania Tinned Copper Bar Company Profiles
- Lithuania Tinned Copper Bar Key Strategic Recommendations
Frequently Asked Questions About the Market Study (FAQs):
6Wresearch actively monitors the Lithuania Tinned Copper Bar Market and publishes its comprehensive annual report, highlighting emerging trends, growth drivers, revenue analysis, and forecast outlook. Our insights help businesses to make data-backed strategic decisions with ongoing market dynamics. Our analysts track relevent industries related to the Lithuania Tinned Copper Bar Market, allowing our clients with actionable intelligence and reliable forecasts tailored to emerging regional needs.
Yes, we provide customisation as per your requirements. To learn more, feel free to contact us on sales@6wresearch.com
1 Executive Summary |
2 Introduction |
2.1 Key Highlights of the Report |
2.2 Report Description |
2.3 Market Scope & Segmentation |
2.4 Research Methodology |
2.5 Assumptions |
3 Lithuania Tinned Copper Bar Market Overview |
3.1 Lithuania Country Macro Economic Indicators |
3.2 Lithuania Tinned Copper Bar Market Revenues & Volume, 2021 & 2031F |
3.3 Lithuania Tinned Copper Bar Market - Industry Life Cycle |
3.4 Lithuania Tinned Copper Bar Market - Porter's Five Forces |
3.5 Lithuania Tinned Copper Bar Market Revenues & Volume Share, By Type, 2021 & 2031F |
3.6 Lithuania Tinned Copper Bar Market Revenues & Volume Share, By Application, 2021 & 2031F |
4 Lithuania Tinned Copper Bar Market Dynamics |
4.1 Impact Analysis |
4.2 Market Drivers |
4.2.1 Increasing demand for tinned copper bars in the electronics industry due to their superior conductivity and corrosion resistance. |
4.2.2 Growth in the construction sector, driving the need for tinned copper bars in wiring and electrical applications. |
4.2.3 Technological advancements leading to the development of innovative tinned copper bar products with enhanced properties. |
4.3 Market Restraints |
4.3.1 Fluctuating prices of raw materials impacting the production costs of tinned copper bars. |
4.3.2 Economic uncertainty affecting investments in infrastructure projects and consequently the demand for tinned copper bars. |
4.3.3 Environmental regulations and sustainability concerns leading to challenges in the manufacturing process of tinned copper bars. |
5 Lithuania Tinned Copper Bar Market Trends |
6 Lithuania Tinned Copper Bar Market Segmentations |
6.1 Lithuania Tinned Copper Bar Market, By Type |
6.1.1 Overview and Analysis |
6.1.2 Lithuania Tinned Copper Bar Market Revenues & Volume, By Full Round, 2021-2031F |
6.1.3 Lithuania Tinned Copper Bar Market Revenues & Volume, By Slightly Round Edge, 2021-2031F |
6.1.4 Lithuania Tinned Copper Bar Market Revenues & Volume, By Square, 2021-2031F |
6.2 Lithuania Tinned Copper Bar Market, By Application |
6.2.1 Overview and Analysis |
6.2.2 Lithuania Tinned Copper Bar Market Revenues & Volume, By Electrical Conductor, 2021-2031F |
6.2.3 Lithuania Tinned Copper Bar Market Revenues & Volume, By Induction Motors, 2021-2031F |
6.2.4 Lithuania Tinned Copper Bar Market Revenues & Volume, By Earthing, 2021-2031F |
6.2.5 Lithuania Tinned Copper Bar Market Revenues & Volume, By Lightning Protection, 2021-2031F |
6.2.6 Lithuania Tinned Copper Bar Market Revenues & Volume, By General Engineering, 2021-2031F |
6.2.7 Lithuania Tinned Copper Bar Market Revenues & Volume, By Switch Gears, 2021-2031F |
7 Lithuania Tinned Copper Bar Market Import-Export Trade Statistics |
7.1 Lithuania Tinned Copper Bar Market Export to Major Countries |
7.2 Lithuania Tinned Copper Bar Market Imports from Major Countries |
8 Lithuania Tinned Copper Bar Market Key Performance Indicators |
8.1 Percentage of tinned copper bar products meeting industry standards for conductivity and quality. |
8.2 Rate of adoption of new tinned copper bar technologies in the market. |
8.3 Environmental impact metrics such as energy consumption and waste generation in tinned copper bar production. |
9 Lithuania Tinned Copper Bar Market - Opportunity Assessment |
9.1 Lithuania Tinned Copper Bar Market Opportunity Assessment, By Type, 2021 & 2031F |
9.2 Lithuania Tinned Copper Bar Market Opportunity Assessment, By Application, 2021 & 2031F |
10 Lithuania Tinned Copper Bar Market - Competitive Landscape |
10.1 Lithuania Tinned Copper Bar Market Revenue Share, By Companies, 2024 |
10.2 Lithuania Tinned Copper Bar Market Competitive Benchmarking, By Operating and Technical Parameters |
11 Company Profiles |
12 Recommendations | 13 Disclaimer |
Export potential assessment - trade Analytics for 2030
Export potential enables firms to identify high-growth global markets with greater confidence by combining advanced trade intelligence with a structured quantitative methodology. The framework analyzes emerging demand trends and country-level import patterns while integrating macroeconomic and trade datasets such as GDP and population forecasts, bilateral import–export flows, tariff structures, elasticity differentials between developed and developing economies, geographic distance, and import demand projections. Using weighted trade values from 2020–2024 as the base period to project country-to-country export potential for 2030, these inputs are operationalized through calculated drivers such as gravity model parameters, tariff impact factors, and projected GDP per-capita growth. Through an analysis of hidden potentials, demand hotspots, and market conditions that are most favorable to success, this method enables firms to focus on target countries, maximize returns, and global expansion with data, backed by accuracy.
By factoring in the projected importer demand gap that is currently unmet and could be potential opportunity, it identifies the potential for the Exporter (Country) among 190 countries, against the general trade analysis, which identifies the biggest importer or exporter.
To discover high-growth global markets and optimize your business strategy:
Click Here
Pricing
- Single User License$ 1,995
- Department License$ 2,400
- Site License$ 3,120
- Global License$ 3,795

Search
Thought Leadership and Analyst Meet


Our Clients
Latest Reports
- Canada Cloud CFD Market (2026-2032) | Size & Revenue, Industry, Growth, Competitive Landscape, Forecast, Segmentation, Value, Outlook, Trends, Share, Analysis, Companies
- Taiwan Food Delivery Platform Market (2026-2032) | Companies, Outlook, Analysis, Trends, Value, Revenue, Segmentation, Share, Forecast, Competitive Landscape, Growth, Size & Forecast
- United Kingdom (UK) Long-term Care Insurance Market (2026-2032) | Growth, Share, Consumer Insights, Drivers, Opportunities, Competition, Pricing Analysis, Segments, Restraints, Companies, Competitive, Value, Outlook, Size, Demand, Analysis, Challenges, Strategic Insights, Investment Trends, Revenue, Trends, Supply, Forecast
- United Kingdom (UK) Long Term Care Market (2026-2032) | Companies, Outlook, Analysis, Trends, Value, Revenue, Segmentation, Share, Forecast, Competitive Landscape, Growth, Size & Forecast
- Iraq Insulation and Waterproofing Market (2026-2032) | Outlook, Drivers, Growth, Size, Share, Industry, Revenue, Trends, Demand, Competitive, Strategic Insights, Opportunities, Segments, Companies, Challenges, Strategy, Consumer Insights, Analysis, Investment Trends, Value, Segmentation, Forecast, Restraints
- India Switchgear Market Outlook (2026-2032) | Size, Share, Trends, Growth, Revenue, Forecast, Analysis, Value, Outlook
- Pakistan Contraceptive Implants Market (2025-2031) | Demand, Growth, Size, Share, Industry, Pricing Analysis, Competitive, Strategic Insights, Strategy, Consumer Insights, Analysis, Investment Trends, Opportunities, Revenue, Segments, Value, Segmentation, Supply, Forecast, Restraints, Outlook, Competition, Drivers, Trends, Companies, Challenges
- Sri Lanka Packaging Market (2026-2032) | Outlook, Competition, Drivers, Trends, Demand, Pricing Analysis, Competitive, Strategic Insights, Companies, Challenges, Strategy, Consumer Insights, Analysis, Investment Trends, Opportunities, Growth, Size, Share, Industry, Revenue, Segments, Value, Segmentation, Supply, Forecast, Restraints
- India Kids Watches Market (2026-2032) | Strategy, Consumer Insights, Analysis, Investment Trends, Opportunities, Growth, Size, Share, Industry, Revenue, Segments, Value, Segmentation, Supply, Forecast, Restraints, Outlook, Competition, Drivers, Trends, Demand, Pricing Analysis, Competitive, Strategic Insights, Companies, Challenges
- Saudi Arabia Core Assurance Service Market (2025-2031) | Strategy, Consumer Insights, Analysis, Investment Trends, Opportunities, Growth, Size, Share, Industry, Revenue, Segments, Value, Segmentation, Supply, Forecast, Restraints, Outlook, Competition, Drivers, Trends, Demand, Pricing Analysis, Competitive, Strategic Insights, Companies, Challenges
Industry Events and Analyst Meet

India EV Show 2026

EV tech India Expo 2026

Auto Tech Asia 2026

Battery Tech India 2026

Smart Production Solutions Guangzhou 2026
Whitepaper
- Middle East & Africa Commercial Security Market Click here to view more.
- Middle East & Africa Fire Safety Systems & Equipment Market Click here to view more.
- GCC Drone Market Click here to view more.
- Middle East Lighting Fixture Market Click here to view more.
- GCC Physical & Perimeter Security Market Click here to view more.
6WResearch In News
- Doha a strategic location for EV manufacturing hub: IPA Qatar
- Demand for luxury TVs surging in the GCC, says Samsung
- Empowering Growth: The Thriving Journey of Bangladesh’s Cable Industry
- Demand for luxury TVs surging in the GCC, says Samsung
- Video call with a traditional healer? Once unthinkable, it’s now common in South Africa
- Intelligent Buildings To Smooth GCC’s Path To Net Zero