Lithuania Triacetin Market (2026-2032) | Segmentation, Outlook, Forecast, Growth, Companies, Size, Analysis, Share, Industry, Trends, Value & Revenue
Market Forecast By Grade (Tobacco, Food, Industrial), By Product Type (Plasticizer, Solvent, Humectant), By End Use Industry (Tobacco, Food & Beverage, Pharmaceutical, Cosmetic, Chemical) And Competitive Landscape
| Product Code: ETC5651875 | Publication Date: Nov 2023 | Updated Date: Apr 2026 | Product Type: Market Research Report | |
| Publisher: 6Wresearch | Author: Ravi Bhandari | No. of Pages: 60 | No. of Figures: 30 | No. of Tables: 5 |
Lithuania Triacetin Market Size (2020-2030)
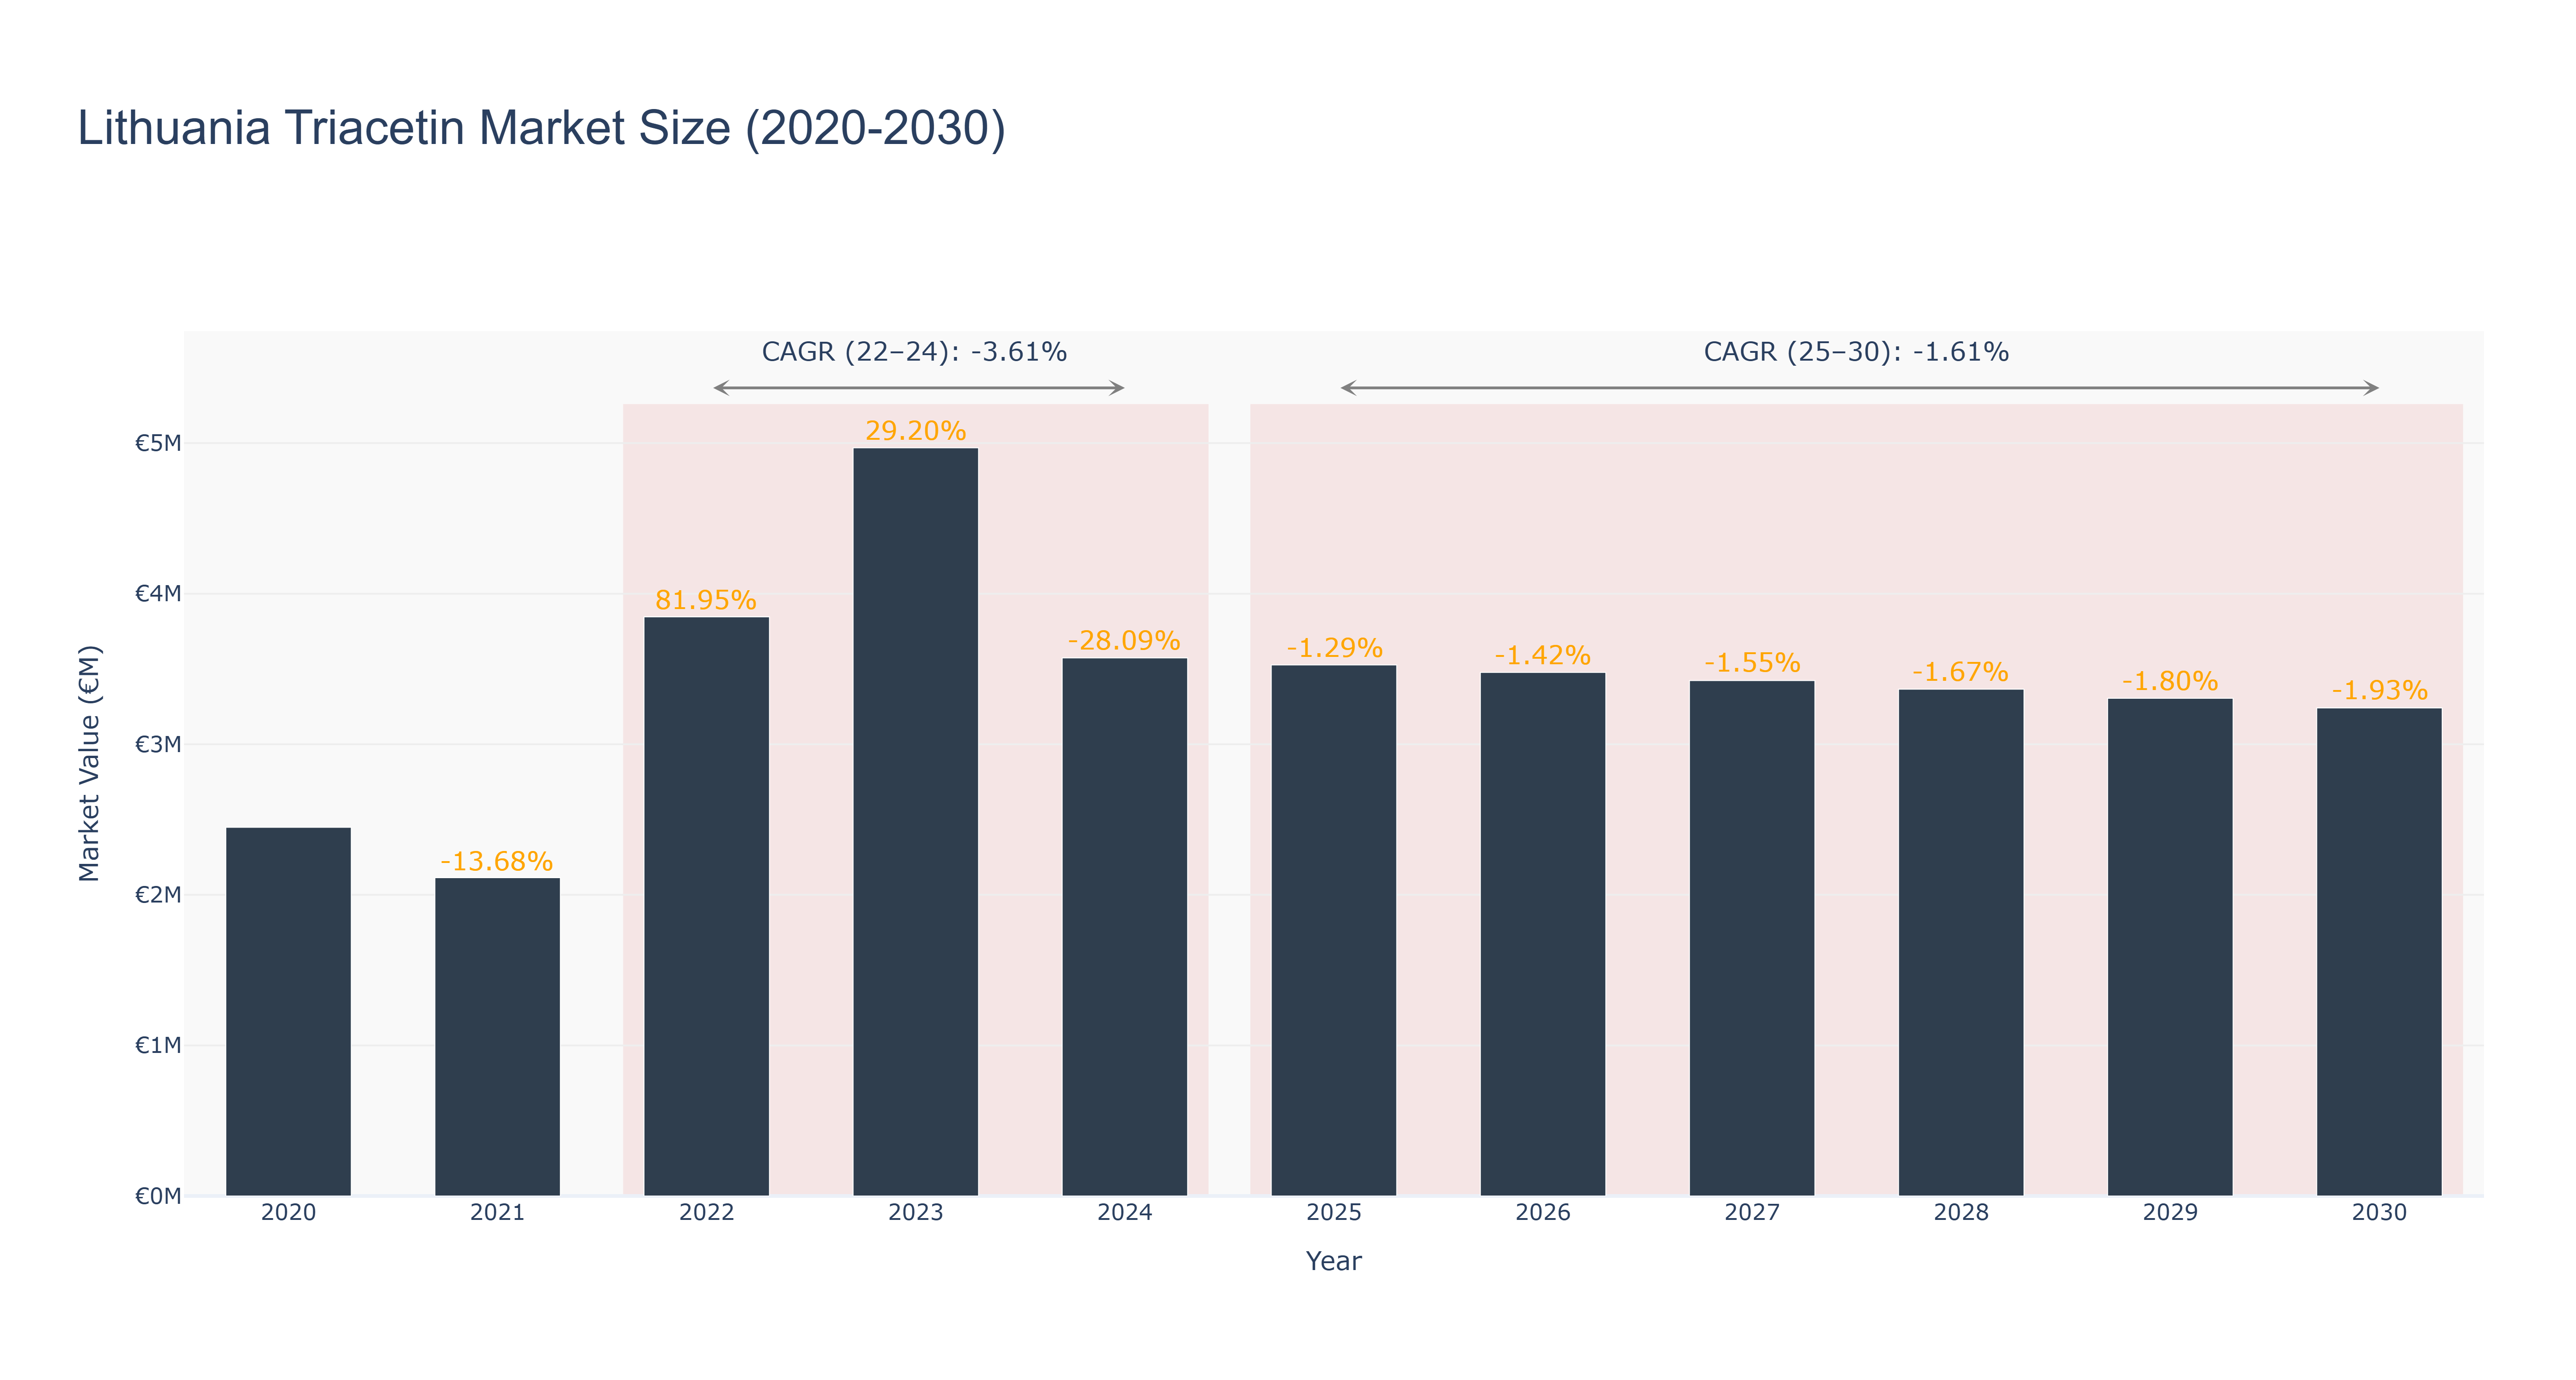
The Lithuania Triacetin Market experienced a peak size of €4.97 million in 2023, with a downward trend observed from 2024 to 2026, reaching €3.48 million. The market is forecasted to continue declining to €3.24 million by 2030, with a CAGR of -1.61% from 2025 to 2030. The market's recent contraction can be attributed to factors such as changing consumer preferences and economic uncertainties. However, industry drivers such as increasing demand for environmentally friendly products and technological advancements in production processes could potentially drive market growth in the future. Looking ahead, upcoming projects in sustainable manufacturing practices and collaborations with key players in the chemical industry are anticipated to revitalize the Lithuania Triacetin Market in the coming years.
Lithuania Triacetin Market: Production & Trade Performance (2019-2025)
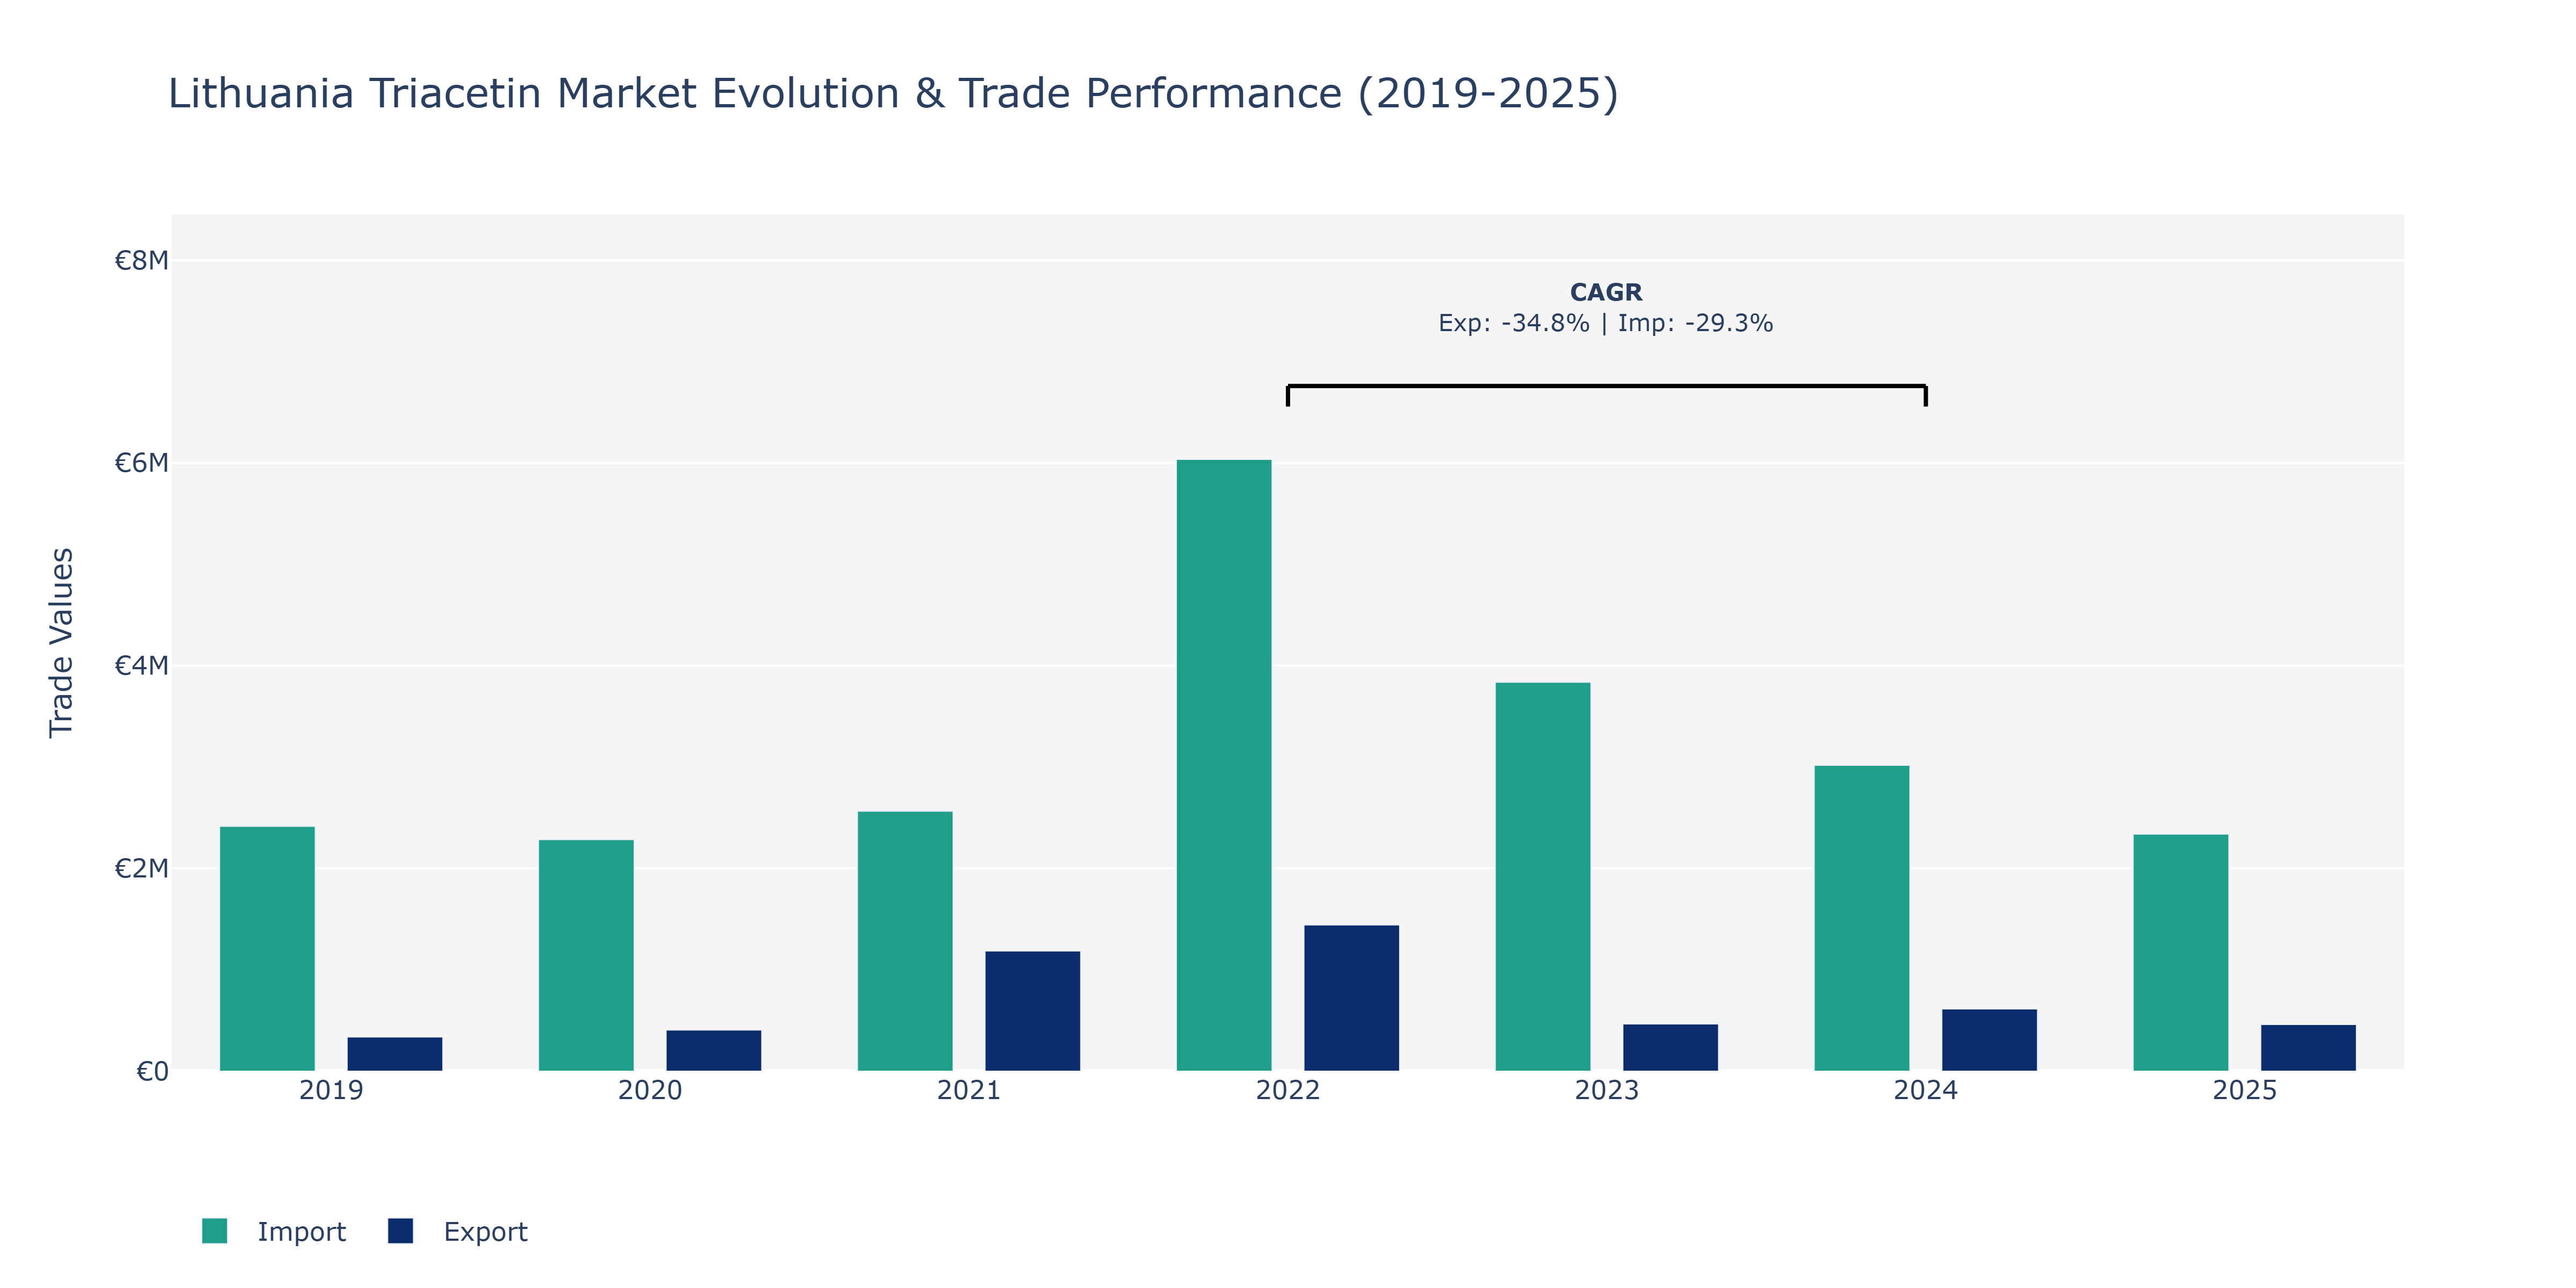
The Lithuania Triacetin market experienced notable fluctuations in both exports and imports from 2019 to 2025. In 2019, exports stood at €336.92 thousand, while imports were significantly higher at €2.42 million. The following year, exports increased to €406.19 thousand, but imports decreased to €2.28 million. A substantial surge was observed in 2021, with exports reaching €1.19 million and imports at €2.56 million. 2022 marked a peak for exports at €1.44 million and a significant peak for imports at €6.04 million. However, a sharp decline was noted in 2023 for both exports (€465.8 thousand) and imports (€3.84 million). By 2024, exports rebounded to €613.61 thousand, while imports decreased to €3.02 million. The year 2025 saw a decrease in exports to €461.29 thousand and imports to €2.34 million. These fluctuations can be attributed to various factors such as changes in global demand, shifts in production capacities, and evolving trade policies affecting the Triacetin industry. Further analysis incorporating geopolitical events and market dynamics would provide a comprehensive understanding of the market trends observed in Lithuania.
Key Highlights of the Report:
- Lithuania Triacetin Market Outlook
- Market Size of Lithuania Triacetin Market, 2025
- Forecast of Lithuania Triacetin Market, 2032
- Historical Data and Forecast of Lithuania Triacetin Revenues & Volume for the Period 2022 - 2032F
- Lithuania Triacetin Market Trend Evolution
- Lithuania Triacetin Market Drivers and Challenges
- Lithuania Triacetin Price Trends
- Lithuania Triacetin Porter`s Five Forces
- Lithuania Triacetin Industry Life Cycle
- Historical Data and Forecast of Lithuania Triacetin Market Revenues & Volume By Grade for the Period 2022 - 2032F
- Historical Data and Forecast of Lithuania Triacetin Market Revenues & Volume By Tobacco for the Period 2022 - 2032F
- Historical Data and Forecast of Lithuania Triacetin Market Revenues & Volume By Food for the Period 2022 - 2032F
- Historical Data and Forecast of Lithuania Triacetin Market Revenues & Volume By Industrial for the Period 2022 - 2032F
- Historical Data and Forecast of Lithuania Triacetin Market Revenues & Volume By Product Type for the Period 2022 - 2032F
- Historical Data and Forecast of Lithuania Triacetin Market Revenues & Volume By Plasticizer for the Period 2022 - 2032F
- Historical Data and Forecast of Lithuania Triacetin Market Revenues & Volume By Solvent for the Period 2022 - 2032F
- Historical Data and Forecast of Lithuania Triacetin Market Revenues & Volume By Humectant for the Period 2022 - 2032F
- Historical Data and Forecast of Lithuania Triacetin Market Revenues & Volume By End Use Industry for the Period 2022 - 2032F
- Historical Data and Forecast of Lithuania Triacetin Market Revenues & Volume By Tobacco for the Period 2022 - 2032F
- Historical Data and Forecast of Lithuania Triacetin Market Revenues & Volume By Food & Beverage for the Period 2022 - 2032F
- Historical Data and Forecast of Lithuania Triacetin Market Revenues & Volume By Pharmaceutical for the Period 2022 - 2032F
- Historical Data and Forecast of Lithuania Triacetin Market Revenues & Volume By Cosmetic for the Period 2022 - 2032F
- Historical Data and Forecast of Lithuania Triacetin Market Revenues & Volume By Chemical for the Period 2022 - 2032F
- Lithuania Triacetin Import Export Trade Statistics
- Market Opportunity Assessment By Grade
- Market Opportunity Assessment By Product Type
- Market Opportunity Assessment By End Use Industry
- Lithuania Triacetin Top Companies Market Share
- Lithuania Triacetin Competitive Benchmarking By Technical and Operational Parameters
- Lithuania Triacetin Company Profiles
- Lithuania Triacetin Key Strategic Recommendations
Frequently Asked Questions About the Market Study (FAQs):
6Wresearch actively monitors the Lithuania Triacetin Market and publishes its comprehensive annual report, highlighting emerging trends, growth drivers, revenue analysis, and forecast outlook. Our insights help businesses to make data-backed strategic decisions with ongoing market dynamics. Our analysts track relevent industries related to the Lithuania Triacetin Market, allowing our clients with actionable intelligence and reliable forecasts tailored to emerging regional needs.
Yes, we provide customisation as per your requirements. To learn more, feel free to contact us on sales@6wresearch.com
1 Executive Summary |
2 Introduction |
2.1 Key Highlights of the Report |
2.2 Report Description |
2.3 Market Scope & Segmentation |
2.4 Research Methodology |
2.5 Assumptions |
3 Lithuania Triacetin Market Overview |
3.1 Lithuania Country Macro Economic Indicators |
3.2 Lithuania Triacetin Market Revenues & Volume, 2022 & 2032F |
3.3 Lithuania Triacetin Market - Industry Life Cycle |
3.4 Lithuania Triacetin Market - Porter's Five Forces |
3.5 Lithuania Triacetin Market Revenues & Volume Share, By Grade, 2022 & 2032F |
3.6 Lithuania Triacetin Market Revenues & Volume Share, By Product Type, 2022 & 2032F |
3.7 Lithuania Triacetin Market Revenues & Volume Share, By End Use Industry, 2022 & 2032F |
4 Lithuania Triacetin Market Dynamics |
4.1 Impact Analysis |
4.2 Market Drivers |
4.2.1 Growing demand for food additives and flavor enhancers |
4.2.2 Increasing adoption in pharmaceutical industry for drug formulation |
4.2.3 Rising awareness about the benefits of using triacetin as a plasticizer in various industries |
4.3 Market Restraints |
4.3.1 Fluctuating raw material prices affecting production costs |
4.3.2 Stringent regulations regarding the use of additives in food and pharmaceutical products |
4.3.3 Competition from alternative products and substitutes affecting market share |
5 Lithuania Triacetin Market Trends |
6 Lithuania Triacetin Market Segmentations |
6.1 Lithuania Triacetin Market, By Grade |
6.1.1 Overview and Analysis |
6.1.2 Lithuania Triacetin Market Revenues & Volume, By Tobacco, 2022 - 2032F |
6.1.3 Lithuania Triacetin Market Revenues & Volume, By Food, 2022 - 2032F |
6.1.4 Lithuania Triacetin Market Revenues & Volume, By Industrial, 2022 - 2032F |
6.2 Lithuania Triacetin Market, By Product Type |
6.2.1 Overview and Analysis |
6.2.2 Lithuania Triacetin Market Revenues & Volume, By Plasticizer, 2022 - 2032F |
6.2.3 Lithuania Triacetin Market Revenues & Volume, By Solvent, 2022 - 2032F |
6.2.4 Lithuania Triacetin Market Revenues & Volume, By Humectant, 2022 - 2032F |
6.3 Lithuania Triacetin Market, By End Use Industry |
6.3.1 Overview and Analysis |
6.3.2 Lithuania Triacetin Market Revenues & Volume, By Tobacco, 2022 - 2032F |
6.3.3 Lithuania Triacetin Market Revenues & Volume, By Food & Beverage, 2022 - 2032F |
6.3.4 Lithuania Triacetin Market Revenues & Volume, By Pharmaceutical, 2022 - 2032F |
6.3.5 Lithuania Triacetin Market Revenues & Volume, By Cosmetic, 2022 - 2032F |
6.3.6 Lithuania Triacetin Market Revenues & Volume, By Chemical, 2022 - 2032F |
7 Lithuania Triacetin Market Import-Export Trade Statistics |
7.1 Lithuania Triacetin Market Export to Major Countries |
7.2 Lithuania Triacetin Market Imports from Major Countries |
8 Lithuania Triacetin Market Key Performance Indicators |
8.1 Number of new product launches containing triacetin |
8.2 Adoption rate of triacetin in different industries |
8.3 Research and development investment in triacetin technology and applications |
8.4 Regulatory compliance and certifications obtained for triacetin products |
8.5 Customer satisfaction and feedback on the performance of triacetin products |
9 Lithuania Triacetin Market - Opportunity Assessment |
9.1 Lithuania Triacetin Market Opportunity Assessment, By Grade, 2022 & 2032F |
9.2 Lithuania Triacetin Market Opportunity Assessment, By Product Type, 2022 & 2032F |
9.3 Lithuania Triacetin Market Opportunity Assessment, By End Use Industry, 2022 & 2032F |
10 Lithuania Triacetin Market - Competitive Landscape |
10.1 Lithuania Triacetin Market Revenue Share, By Companies, 2025 |
10.2 Lithuania Triacetin Market Competitive Benchmarking, By Operating and Technical Parameters |
11 Company Profiles |
12 Recommendations | 13 Disclaimer |
Export potential assessment - trade Analytics for 2030
Export potential enables firms to identify high-growth global markets with greater confidence by combining advanced trade intelligence with a structured quantitative methodology. The framework analyzes emerging demand trends and country-level import patterns while integrating macroeconomic and trade datasets such as GDP and population forecasts, bilateral import–export flows, tariff structures, elasticity differentials between developed and developing economies, geographic distance, and import demand projections. Using weighted trade values from 2020–2024 as the base period to project country-to-country export potential for 2030, these inputs are operationalized through calculated drivers such as gravity model parameters, tariff impact factors, and projected GDP per-capita growth. Through an analysis of hidden potentials, demand hotspots, and market conditions that are most favorable to success, this method enables firms to focus on target countries, maximize returns, and global expansion with data, backed by accuracy.
By factoring in the projected importer demand gap that is currently unmet and could be potential opportunity, it identifies the potential for the Exporter (Country) among 190 countries, against the general trade analysis, which identifies the biggest importer or exporter.
To discover high-growth global markets and optimize your business strategy:
Click Here
Pricing
- Single User License$ 1,995
- Department License$ 2,400
- Site License$ 3,120
- Global License$ 3,795

Search
Thought Leadership and Analyst Meet


Our Clients
Latest Reports
- Canada Cloud CFD Market (2026-2032) | Size & Revenue, Industry, Growth, Competitive Landscape, Forecast, Segmentation, Value, Outlook, Trends, Share, Analysis, Companies
- Taiwan Food Delivery Platform Market (2026-2032) | Companies, Outlook, Analysis, Trends, Value, Revenue, Segmentation, Share, Forecast, Competitive Landscape, Growth, Size & Forecast
- United Kingdom (UK) Long-term Care Insurance Market (2026-2032) | Growth, Share, Consumer Insights, Drivers, Opportunities, Competition, Pricing Analysis, Segments, Restraints, Companies, Competitive, Value, Outlook, Size, Demand, Analysis, Challenges, Strategic Insights, Investment Trends, Revenue, Trends, Supply, Forecast
- United Kingdom (UK) Long Term Care Market (2026-2032) | Companies, Outlook, Analysis, Trends, Value, Revenue, Segmentation, Share, Forecast, Competitive Landscape, Growth, Size & Forecast
- Iraq Insulation and Waterproofing Market (2026-2032) | Outlook, Drivers, Growth, Size, Share, Industry, Revenue, Trends, Demand, Competitive, Strategic Insights, Opportunities, Segments, Companies, Challenges, Strategy, Consumer Insights, Analysis, Investment Trends, Value, Segmentation, Forecast, Restraints
- India Switchgear Market Outlook (2026-2032) | Size, Share, Trends, Growth, Revenue, Forecast, Analysis, Value, Outlook
- Pakistan Contraceptive Implants Market (2025-2031) | Demand, Growth, Size, Share, Industry, Pricing Analysis, Competitive, Strategic Insights, Strategy, Consumer Insights, Analysis, Investment Trends, Opportunities, Revenue, Segments, Value, Segmentation, Supply, Forecast, Restraints, Outlook, Competition, Drivers, Trends, Companies, Challenges
- Sri Lanka Packaging Market (2026-2032) | Outlook, Competition, Drivers, Trends, Demand, Pricing Analysis, Competitive, Strategic Insights, Companies, Challenges, Strategy, Consumer Insights, Analysis, Investment Trends, Opportunities, Growth, Size, Share, Industry, Revenue, Segments, Value, Segmentation, Supply, Forecast, Restraints
- India Kids Watches Market (2026-2032) | Strategy, Consumer Insights, Analysis, Investment Trends, Opportunities, Growth, Size, Share, Industry, Revenue, Segments, Value, Segmentation, Supply, Forecast, Restraints, Outlook, Competition, Drivers, Trends, Demand, Pricing Analysis, Competitive, Strategic Insights, Companies, Challenges
- Saudi Arabia Core Assurance Service Market (2025-2031) | Strategy, Consumer Insights, Analysis, Investment Trends, Opportunities, Growth, Size, Share, Industry, Revenue, Segments, Value, Segmentation, Supply, Forecast, Restraints, Outlook, Competition, Drivers, Trends, Demand, Pricing Analysis, Competitive, Strategic Insights, Companies, Challenges
Industry Events and Analyst Meet

India EV Show 2026

EV tech India Expo 2026

Auto Tech Asia 2026

Battery Tech India 2026

Smart Production Solutions Guangzhou 2026
Whitepaper
- Middle East & Africa Commercial Security Market Click here to view more.
- Middle East & Africa Fire Safety Systems & Equipment Market Click here to view more.
- GCC Drone Market Click here to view more.
- Middle East Lighting Fixture Market Click here to view more.
- GCC Physical & Perimeter Security Market Click here to view more.
6WResearch In News
- Doha a strategic location for EV manufacturing hub: IPA Qatar
- Demand for luxury TVs surging in the GCC, says Samsung
- Empowering Growth: The Thriving Journey of Bangladesh’s Cable Industry
- Demand for luxury TVs surging in the GCC, says Samsung
- Video call with a traditional healer? Once unthinkable, it’s now common in South Africa
- Intelligent Buildings To Smooth GCC’s Path To Net Zero