Lithuania UV Stabilized Thermoplastic Elastomer Market (2026-2032) | Outlook, Analysis, Growth, Competitive Landscape, Industry, Trends, Segmentation, Share, Forecast, Companies, Size & Revenue, Value
Market Forecast By Type (Styrene block polymer (DBS), Thermoplastic Polyurethane (TPU), Thermoplastic Polyolefin (TPO), Thermoplastic vulcanizate (TPV), Polyester ether elastomer (COPE), Polyether block amide (PEBA)), By Application (Electrical & Electronics, Industrial, Medical, Consumer Goods, Automotive) And Competitive Landscape
| Product Code: ETC8053431 | Publication Date: Sep 2024 | Updated Date: Apr 2026 | Product Type: Market Research Report | |
| Publisher: 6Wresearch | Author: Sumit Sagar | No. of Pages: 75 | No. of Figures: 35 | No. of Tables: 20 |
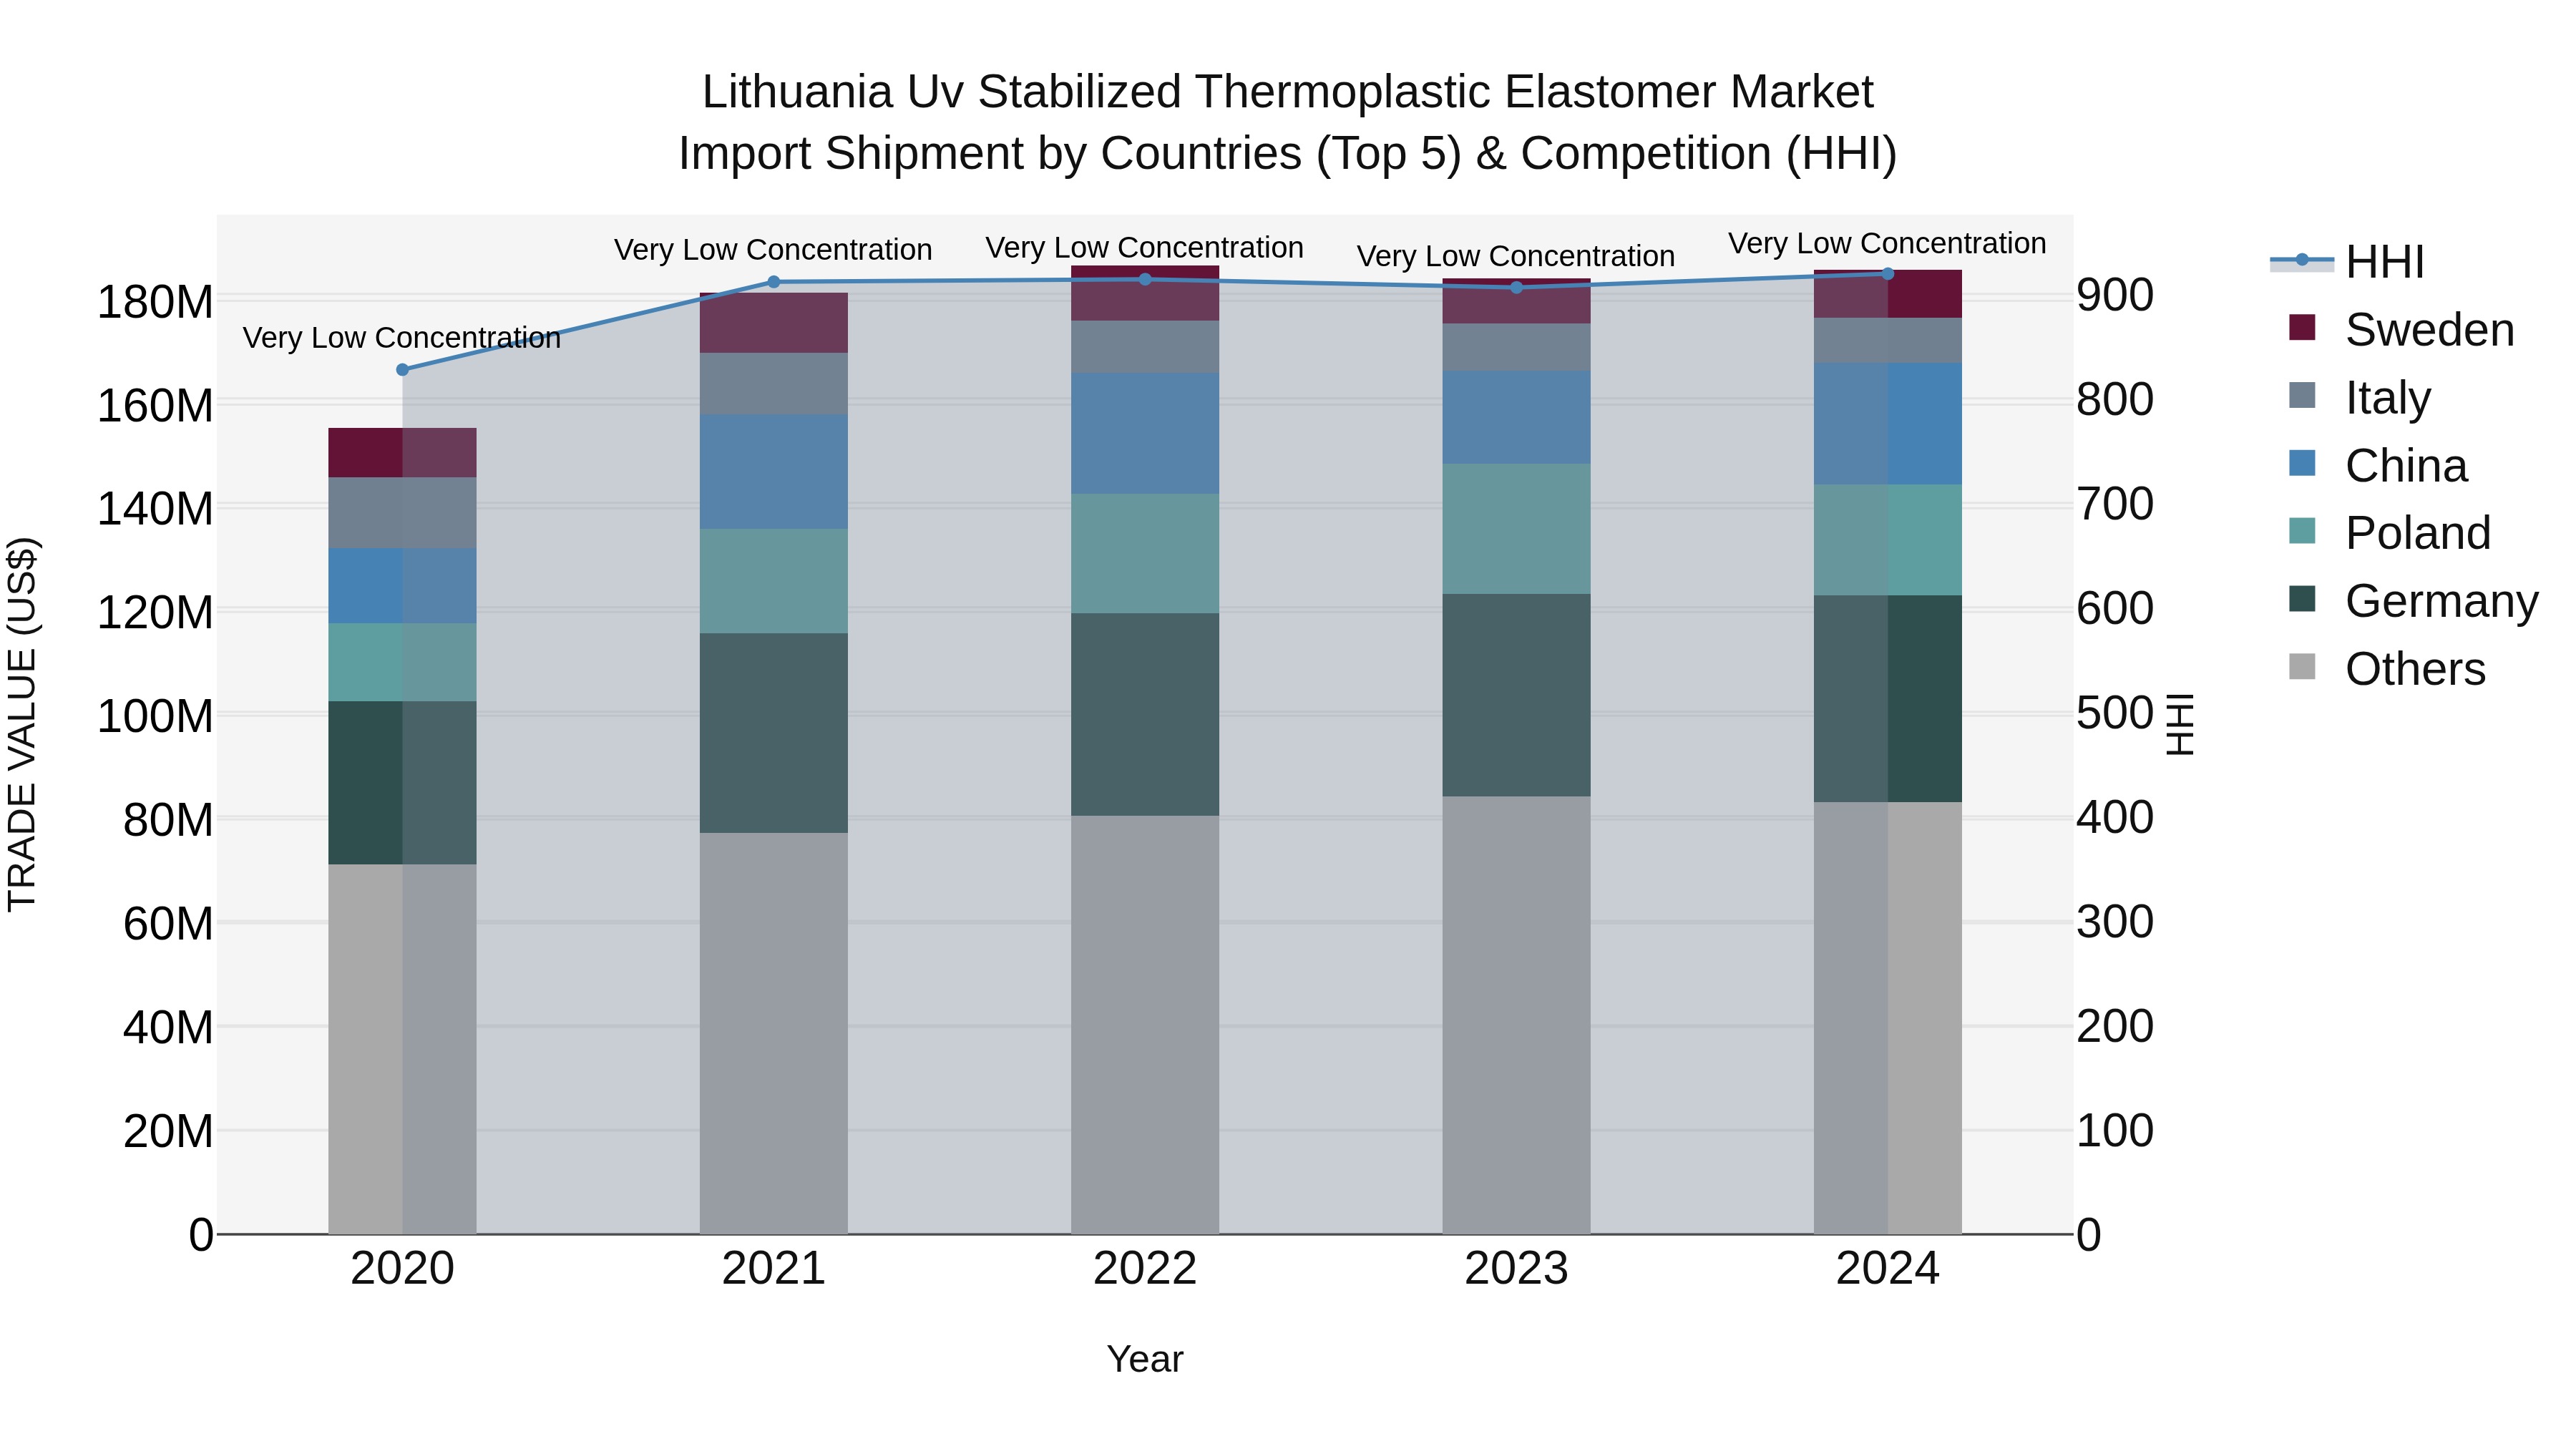
Lithuania Uv Stabilized Thermoplastic Elastomer Market Top 5 Importing Countries and Market Competition (HHI) Analysis
The Lithuanian market for UV stabilized thermoplastic elastomers saw steady growth in 2024, with top suppliers including Germany, China, Poland, Latvia, and Sweden. The low Herfindahl-Hirschman Index (HHI) indicates a competitive market landscape. The compound annual growth rate (CAGR) from 2020 to 2024 was a healthy 4.6%, with a slight uptick in the growth rate from 2023 to 2024 at 0.94%. This data suggests a stable and gradually expanding market for UV stabilized thermoplastic elastomer imports in Lithuania, driven by a diverse range of suppliers.
Key Highlights of the Report:
- Lithuania UV Stabilized Thermoplastic Elastomer Market Outlook
- Market Size of Lithuania UV Stabilized Thermoplastic Elastomer Market, 2025
- Forecast of Lithuania UV Stabilized Thermoplastic Elastomer Market, 2032
- Historical Data and Forecast of Lithuania UV Stabilized Thermoplastic Elastomer Revenues & Volume for the Period 2022 - 2032
- Lithuania UV Stabilized Thermoplastic Elastomer Market Trend Evolution
- Lithuania UV Stabilized Thermoplastic Elastomer Market Drivers and Challenges
- Lithuania UV Stabilized Thermoplastic Elastomer Price Trends
- Lithuania UV Stabilized Thermoplastic Elastomer Porter's Five Forces
- Lithuania UV Stabilized Thermoplastic Elastomer Industry Life Cycle
- Historical Data and Forecast of Lithuania UV Stabilized Thermoplastic Elastomer Market Revenues & Volume By Type for the Period 2022 - 2032
- Historical Data and Forecast of Lithuania UV Stabilized Thermoplastic Elastomer Market Revenues & Volume By Styrene block polymer (DBS) for the Period 2022 - 2032
- Historical Data and Forecast of Lithuania UV Stabilized Thermoplastic Elastomer Market Revenues & Volume By Thermoplastic Polyurethane (TPU) for the Period 2022 - 2032
- Historical Data and Forecast of Lithuania UV Stabilized Thermoplastic Elastomer Market Revenues & Volume By Thermoplastic Polyolefin (TPO) for the Period 2022 - 2032
- Historical Data and Forecast of Lithuania UV Stabilized Thermoplastic Elastomer Market Revenues & Volume By Thermoplastic vulcanizate (TPV) for the Period 2022 - 2032
- Historical Data and Forecast of Lithuania UV Stabilized Thermoplastic Elastomer Market Revenues & Volume By Polyester ether elastomer (COPE) for the Period 2022 - 2032
- Historical Data and Forecast of Lithuania UV Stabilized Thermoplastic Elastomer Market Revenues & Volume By Polyether block amide (PEBA) for the Period 2022 - 2032
- Historical Data and Forecast of Lithuania UV Stabilized Thermoplastic Elastomer Market Revenues & Volume By Application for the Period 2022 - 2032
- Historical Data and Forecast of Lithuania UV Stabilized Thermoplastic Elastomer Market Revenues & Volume By Electrical & Electronics for the Period 2022 - 2032
- Historical Data and Forecast of Lithuania UV Stabilized Thermoplastic Elastomer Market Revenues & Volume By Industrial for the Period 2022 - 2032
- Historical Data and Forecast of Lithuania UV Stabilized Thermoplastic Elastomer Market Revenues & Volume By Medical for the Period 2022 - 2032
- Historical Data and Forecast of Lithuania UV Stabilized Thermoplastic Elastomer Market Revenues & Volume By Consumer Goods for the Period 2022 - 2032
- Historical Data and Forecast of Lithuania UV Stabilized Thermoplastic Elastomer Market Revenues & Volume By Automotive for the Period 2022 - 2032
- Lithuania UV Stabilized Thermoplastic Elastomer Import Export Trade Statistics
- Market Opportunity Assessment By Type
- Market Opportunity Assessment By Application
- Lithuania UV Stabilized Thermoplastic Elastomer Top Companies Market Share
- Lithuania UV Stabilized Thermoplastic Elastomer Competitive Benchmarking By Technical and Operational Parameters
- Lithuania UV Stabilized Thermoplastic Elastomer Company Profiles
- Lithuania UV Stabilized Thermoplastic Elastomer Key Strategic Recommendations
Frequently Asked Questions About the Market Study (FAQs):
6Wresearch actively monitors the Lithuania UV Stabilized Thermoplastic Elastomer Market and publishes its comprehensive annual report, highlighting emerging trends, growth drivers, revenue analysis, and forecast outlook. Our insights help businesses to make data-backed strategic decisions with ongoing market dynamics. Our analysts track relevent industries related to the Lithuania UV Stabilized Thermoplastic Elastomer Market, allowing our clients with actionable intelligence and reliable forecasts tailored to emerging regional needs.
Yes, we provide customisation as per your requirements. To learn more, feel free to contact us on sales@6wresearch.com
1 Executive Summary |
2 Introduction |
2.1 Key Highlights of the Report |
2.2 Report Description |
2.3 Market Scope & Segmentation |
2.4 Research Methodology |
2.5 Assumptions |
3 Lithuania UV Stabilized Thermoplastic Elastomer Market Overview |
3.1 Lithuania Country Macro Economic Indicators |
3.2 Lithuania UV Stabilized Thermoplastic Elastomer Market Revenues & Volume, 2022 & 2032F |
3.3 Lithuania UV Stabilized Thermoplastic Elastomer Market - Industry Life Cycle |
3.4 Lithuania UV Stabilized Thermoplastic Elastomer Market - Porter's Five Forces |
3.5 Lithuania UV Stabilized Thermoplastic Elastomer Market Revenues & Volume Share, By Type, 2022 & 2032F |
3.6 Lithuania UV Stabilized Thermoplastic Elastomer Market Revenues & Volume Share, By Application, 2022 & 2032F |
4 Lithuania UV Stabilized Thermoplastic Elastomer Market Dynamics |
4.1 Impact Analysis |
4.2 Market Drivers |
4.2.1 Growing demand for UV stabilized thermoplastic elastomers in industries such as automotive, consumer goods, and construction due to their enhanced properties and durability. |
4.2.2 Increasing focus on sustainable and eco-friendly materials, leading to the adoption of UV stabilized thermoplastic elastomers as they are recyclable and contribute to reducing environmental impact. |
4.2.3 Technological advancements in the production processes of UV stabilized thermoplastic elastomers, leading to improved performance characteristics and wider application possibilities. |
4.3 Market Restraints |
4.3.1 Fluctuating prices of raw materials used in the production of UV stabilized thermoplastic elastomers, impacting the overall cost and profitability for manufacturers. |
4.3.2 Regulatory challenges and compliance requirements related to the use of certain chemicals and additives in UV stabilized thermoplastic elastomers, leading to increased scrutiny and potential limitations on product formulations. |
5 Lithuania UV Stabilized Thermoplastic Elastomer Market Trends |
6 Lithuania UV Stabilized Thermoplastic Elastomer Market, By Types |
6.1 Lithuania UV Stabilized Thermoplastic Elastomer Market, By Type |
6.1.1 Overview and Analysis |
6.1.2 Lithuania UV Stabilized Thermoplastic Elastomer Market Revenues & Volume, By Type, 2022 - 2032F |
6.1.3 Lithuania UV Stabilized Thermoplastic Elastomer Market Revenues & Volume, By Styrene block polymer (DBS), 2022 - 2032F |
6.1.4 Lithuania UV Stabilized Thermoplastic Elastomer Market Revenues & Volume, By Thermoplastic Polyurethane (TPU), 2022 - 2032F |
6.1.5 Lithuania UV Stabilized Thermoplastic Elastomer Market Revenues & Volume, By Thermoplastic Polyolefin (TPO), 2022 - 2032F |
6.1.6 Lithuania UV Stabilized Thermoplastic Elastomer Market Revenues & Volume, By Thermoplastic vulcanizate (TPV), 2022 - 2032F |
6.1.7 Lithuania UV Stabilized Thermoplastic Elastomer Market Revenues & Volume, By Polyester ether elastomer (COPE), 2022 - 2032F |
6.1.8 Lithuania UV Stabilized Thermoplastic Elastomer Market Revenues & Volume, By Polyether block amide (PEBA), 2022 - 2032F |
6.2 Lithuania UV Stabilized Thermoplastic Elastomer Market, By Application |
6.2.1 Overview and Analysis |
6.2.2 Lithuania UV Stabilized Thermoplastic Elastomer Market Revenues & Volume, By Electrical & Electronics, 2022 - 2032F |
6.2.3 Lithuania UV Stabilized Thermoplastic Elastomer Market Revenues & Volume, By Industrial, 2022 - 2032F |
6.2.4 Lithuania UV Stabilized Thermoplastic Elastomer Market Revenues & Volume, By Medical, 2022 - 2032F |
6.2.5 Lithuania UV Stabilized Thermoplastic Elastomer Market Revenues & Volume, By Consumer Goods, 2022 - 2032F |
6.2.6 Lithuania UV Stabilized Thermoplastic Elastomer Market Revenues & Volume, By Automotive, 2022 - 2032F |
7 Lithuania UV Stabilized Thermoplastic Elastomer Market Import-Export Trade Statistics |
7.1 Lithuania UV Stabilized Thermoplastic Elastomer Market Export to Major Countries |
7.2 Lithuania UV Stabilized Thermoplastic Elastomer Market Imports from Major Countries |
8 Lithuania UV Stabilized Thermoplastic Elastomer Market Key Performance Indicators |
8.1 Percentage of market penetration of UV stabilized thermoplastic elastomers in key industries in Lithuania. |
8.2 Rate of adoption of UV stabilized thermoplastic elastomers compared to traditional materials in various applications. |
8.3 Environmental impact metrics such as carbon footprint reduction or recyclability rates of UV stabilized thermoplastic elastomers in the market. |
9 Lithuania UV Stabilized Thermoplastic Elastomer Market - Opportunity Assessment |
9.1 Lithuania UV Stabilized Thermoplastic Elastomer Market Opportunity Assessment, By Type, 2022 & 2032F |
9.2 Lithuania UV Stabilized Thermoplastic Elastomer Market Opportunity Assessment, By Application, 2022 & 2032F |
10 Lithuania UV Stabilized Thermoplastic Elastomer Market - Competitive Landscape |
10.1 Lithuania UV Stabilized Thermoplastic Elastomer Market Revenue Share, By Companies, 2025 |
10.2 Lithuania UV Stabilized Thermoplastic Elastomer Market Competitive Benchmarking, By Operating and Technical Parameters |
11 Company Profiles |
12 Recommendations |
13 Disclaimer |
Export potential assessment - trade Analytics for 2030
Export potential enables firms to identify high-growth global markets with greater confidence by combining advanced trade intelligence with a structured quantitative methodology. The framework analyzes emerging demand trends and country-level import patterns while integrating macroeconomic and trade datasets such as GDP and population forecasts, bilateral import–export flows, tariff structures, elasticity differentials between developed and developing economies, geographic distance, and import demand projections. Using weighted trade values from 2020–2024 as the base period to project country-to-country export potential for 2030, these inputs are operationalized through calculated drivers such as gravity model parameters, tariff impact factors, and projected GDP per-capita growth. Through an analysis of hidden potentials, demand hotspots, and market conditions that are most favorable to success, this method enables firms to focus on target countries, maximize returns, and global expansion with data, backed by accuracy.
By factoring in the projected importer demand gap that is currently unmet and could be potential opportunity, it identifies the potential for the Exporter (Country) among 190 countries, against the general trade analysis, which identifies the biggest importer or exporter.
To discover high-growth global markets and optimize your business strategy:
Click Here
Pricing
- Single User License$ 1,995
- Department License$ 2,400
- Site License$ 3,120
- Global License$ 3,795

Search
Thought Leadership and Analyst Meet


Our Clients
Latest Reports
- Philippines Polyhydroxybutyrate-co-Hydroxyvalerate Market (2026-2032) | Trends, Insights, Challenges, Restraints, Competition, Size, Value, Forecast, Pricing, Share, Outlook, Revenue, Investment Opportunities, Strategy, Drivers, Demand, Growth, segmentation, Analysis, Companies
- Peru Polyhydroxybutyrate-co-Hydroxyvalerate Market (2026-2032) | Growth, Demand, Challenges, Share, Trends, Analysis, Pricing, Investment Opportunities, Drivers, Value, Forecast, Competition, Size, Companies, Insights, Outlook, Restraints, segmentation, Revenue, Strategy
- Pakistan Polyhydroxybutyrate-co-Hydroxyvalerate Market (2026-2032) | Restraints, segmentation, Pricing, Forecast, Share, Strategy, Competition, Trends, Insights, Drivers, Challenges, Growth, Revenue, Outlook, Value, Investment Opportunities, Companies, Size, Analysis, Demand
- Oman Polyhydroxybutyrate-co-Hydroxyvalerate Market (2026-2032) | Drivers, segmentation, Insights, Competition, Pricing, Outlook, Size, Revenue, Challenges, Forecast, Analysis, Growth, Value, Share, Trends, Investment Opportunities, Strategy, Restraints, Companies, Demand
- Nigeria Polyhydroxybutyrate-co-Hydroxyvalerate Market (2026-2032) | Value, Investment Opportunities, Analysis, Revenue, Restraints, Pricing, Outlook, Competition, Demand, Growth, Forecast, Companies, Trends, Challenges, segmentation, Drivers, Insights, Share, Size, Strategy
- Nepal Polyhydroxybutyrate-co-Hydroxyvalerate Market (2026-2032) | Insights, Analysis, Drivers, Share, Revenue, Demand, segmentation, Investment Opportunities, Competition, Forecast, Growth, Pricing, Companies, Strategy, Trends, Restraints, Challenges, Outlook, Size, Value
- Myanmar Polyhydroxybutyrate-co-Hydroxyvalerate Market (2026-2032) | Outlook, Revenue, Strategy, Restraints, Drivers, segmentation, Share, Forecast, Competition, Insights, Growth, Pricing, Size, Demand, Value, Companies, Trends, Challenges, Investment Opportunities, Analysis
- Morocco Polyhydroxybutyrate-co-Hydroxyvalerate Market (2026-2032) | Outlook, Investment Opportunities, Restraints, Strategy, Forecast, Challenges, Drivers, Growth, Companies, segmentation, Trends, Size, Competition, Revenue, Demand, Insights, Share, Analysis, Value, Pricing
- Mexico Polyhydroxybutyrate-co-Hydroxyvalerate Market (2026-2032) | Size, Drivers, Outlook, Share, Strategy, Growth, Pricing, Challenges, Companies, Demand, Value, Investment Opportunities, Restraints, Trends, Forecast, segmentation, Analysis, Insights, Competition, Revenue
- Malaysia Polyhydroxybutyrate-co-Hydroxyvalerate Market (2026-2032) | Share, segmentation, Size, Companies, Analysis, Insights, Forecast, Value, Revenue, Drivers, Restraints, Challenges, Investment Opportunities, Trends, Competition, Strategy, Demand, Growth, Outlook, Pricing
Industry Events and Analyst Meet

HIMTEX 2026

India Refining Summit 2026

India EV Show 2026

EV tech India Expo 2026

Auto Tech Asia 2026
Whitepaper
- Middle East & Africa Commercial Security Market Click here to view more.
- Middle East & Africa Fire Safety Systems & Equipment Market Click here to view more.
- GCC Drone Market Click here to view more.
- Middle East Lighting Fixture Market Click here to view more.
- GCC Physical & Perimeter Security Market Click here to view more.
6WResearch In News
- Doha a strategic location for EV manufacturing hub: IPA Qatar
- Demand for luxury TVs surging in the GCC, says Samsung
- Empowering Growth: The Thriving Journey of Bangladesh’s Cable Industry
- Demand for luxury TVs surging in the GCC, says Samsung
- Video call with a traditional healer? Once unthinkable, it’s now common in South Africa
- Intelligent Buildings To Smooth GCC’s Path To Net Zero