Luxembourg Caprylic Acid Market (2026-2032) | Drivers, Trends, Strategy, Challenges, Restraints, Investment Trends, Revenue, Pricing Analysis, Growth, Segments, Outlook, Competition, Competitive, Consumer Insights, Value, Analysis, Segmentation, Demand, Share, Strategic Insights, Forecast, Companies, Size, Industry, Opportunities, Supply
Market Forecast By Source (Coconut Oil, Palm Oil, Synthetic), By Application (Antimicrobial Agent, Supplement Ingredient, Personal Care), By End User (Food Industry, Pharmaceuticals, Cosmetics), By Production Method (Fractionation, Extraction, Chemical Synthesis), By Function (Emulsifier, Antifungal, Preservative) And Competitive Landscape
| Product Code: ETC11495803 | Publication Date: Apr 2025 | Updated Date: Apr 2026 | Product Type: Market Research Report | |
| Publisher: 6Wresearch | No. of Pages: 65 | No. of Figures: 34 | No. of Tables: 19 | |
Luxembourg Caprylic Acid Market Size (2020-2030)
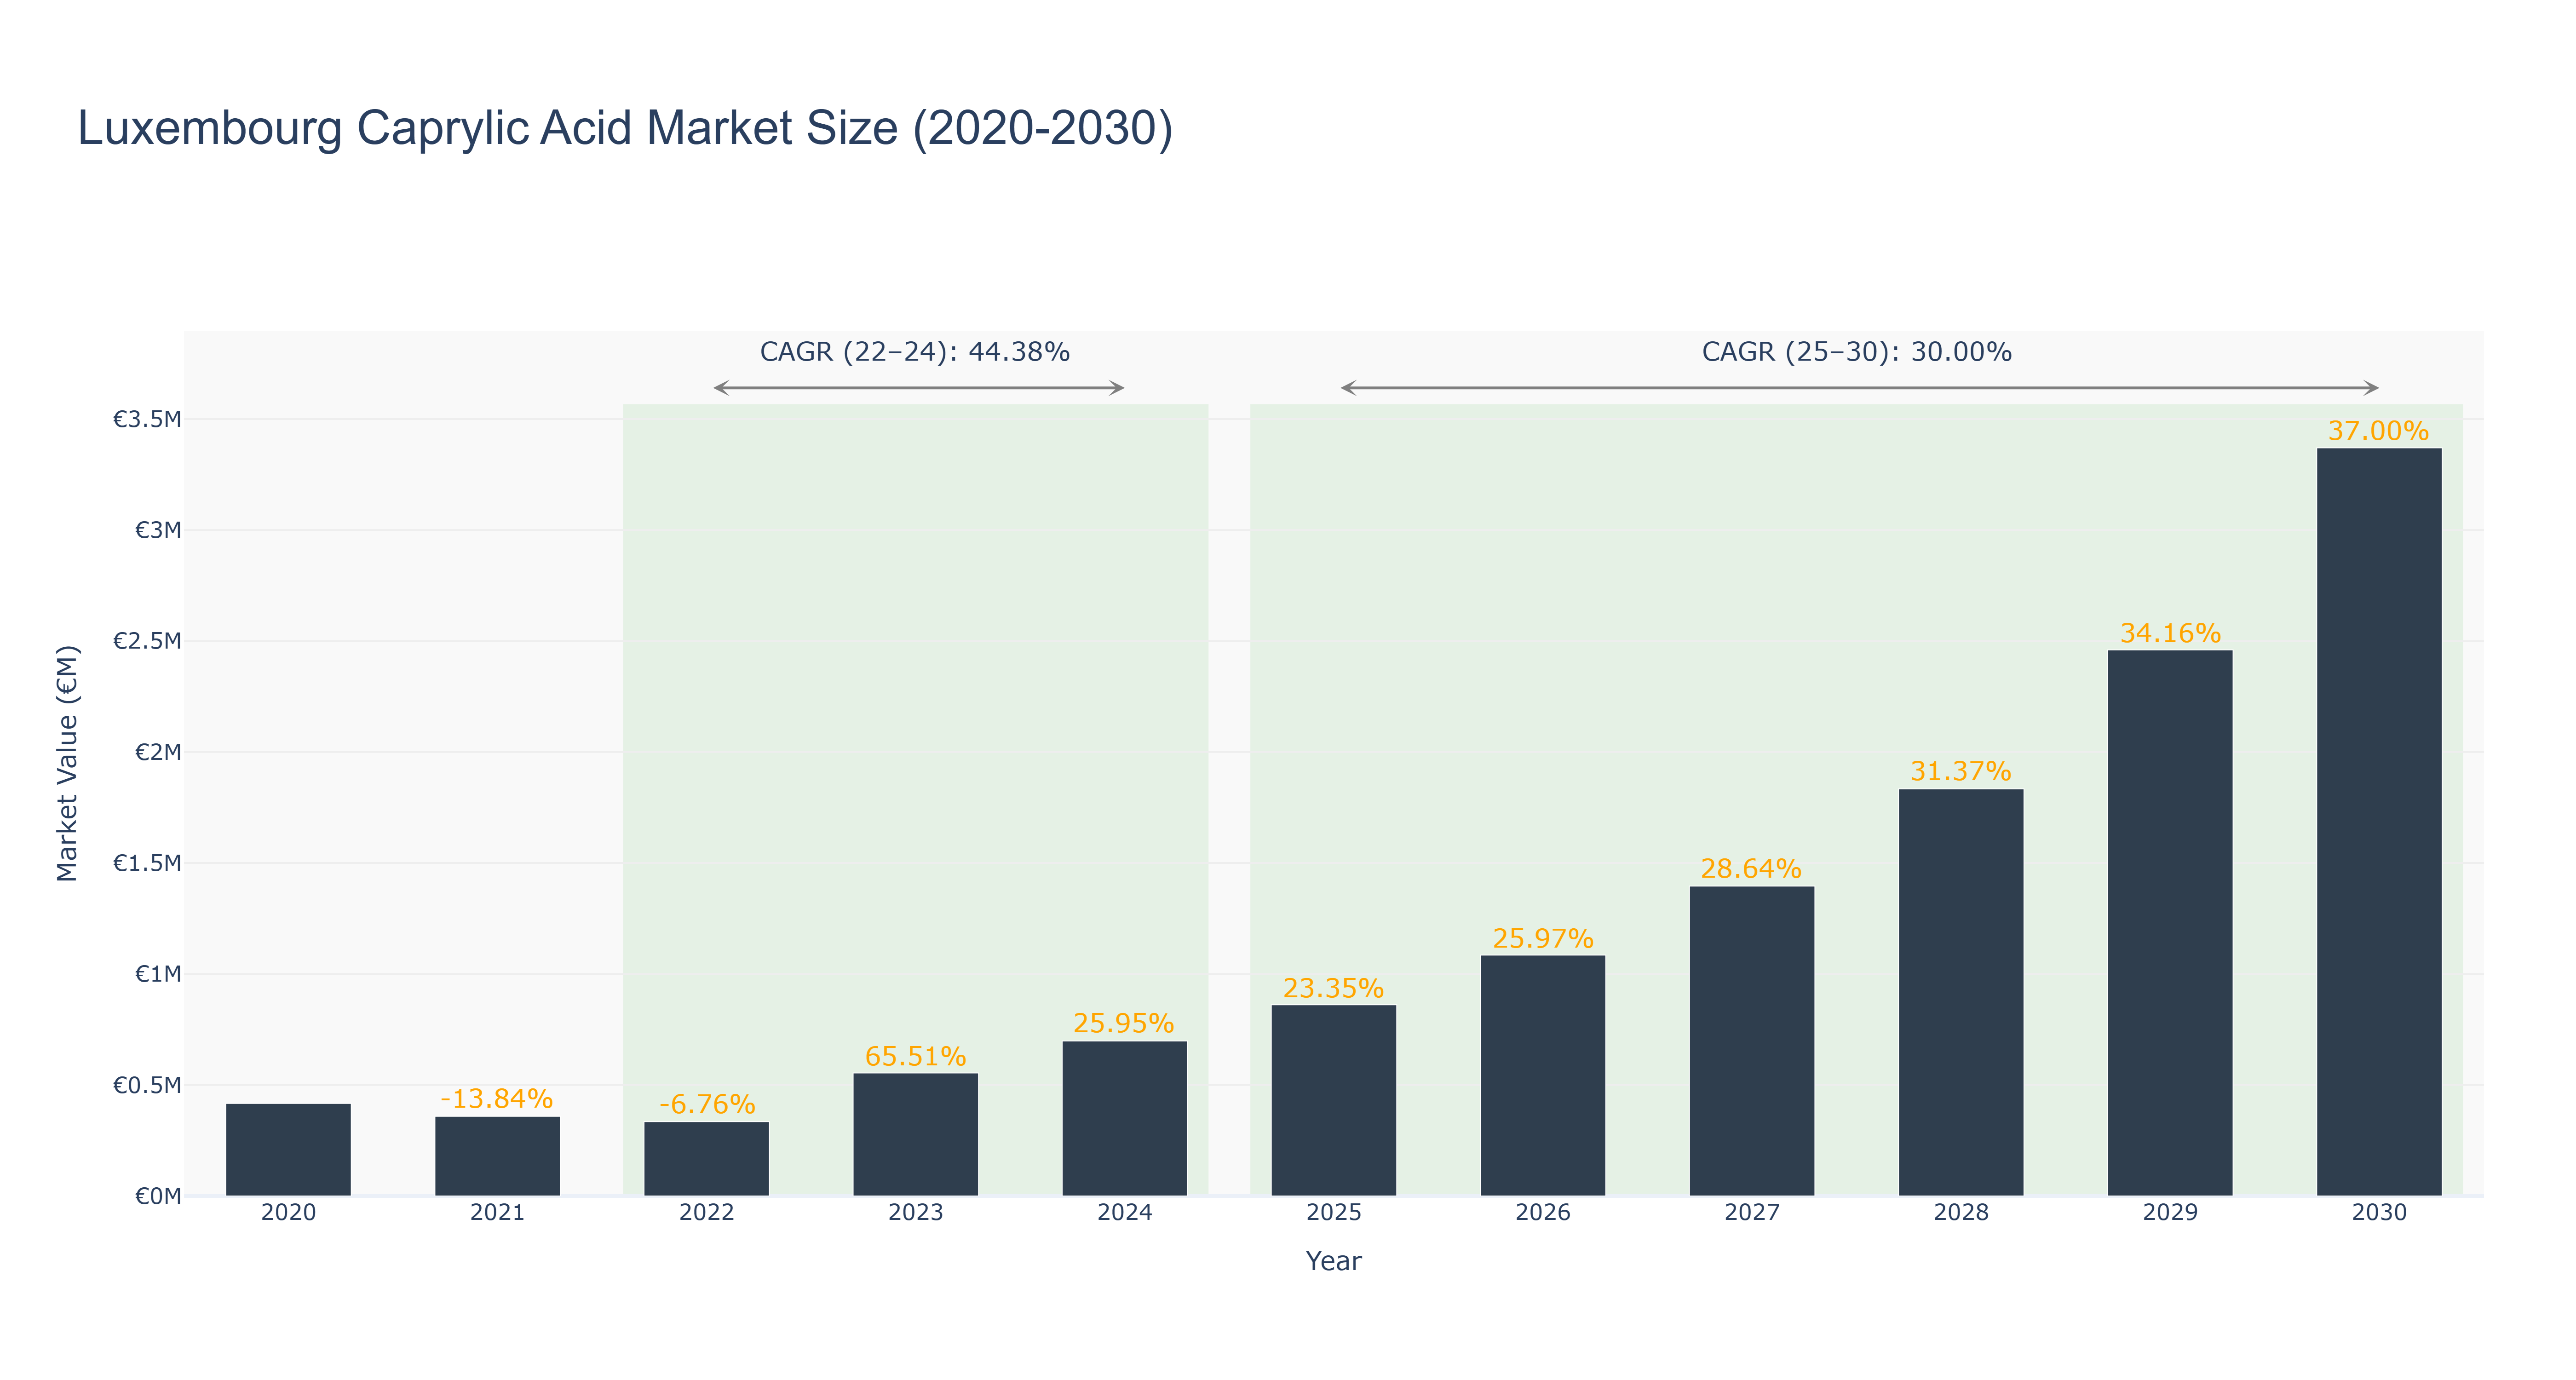
Luxembourg Caprylic Acid Market has shown a remarkable growth trend over the years. The market size reached its peak in 2030 at €3.37 million, with consistent growth from €0.42 million in 2020. The actual market size experienced a significant increase from 2020 to 2024, driven by rising demand for caprylic acid in various industries. The forecasted market size from 2025 to 2030 is projected to continue expanding at a steady pace, with a CAGR of 30.0%. The market witnessed a notable spike in growth from 2022 to 2024, attributed to increasing applications in the food and pharmaceutical sectors. Looking ahead, upcoming projects in the pharmaceutical industry are set to further boost the demand for caprylic acid in Luxembourg, indicating a promising future for the market. Industry drivers such as the growing awareness of health benefits associated with caprylic acid and its versatile applications across different sectors will continue to propel market growth in the coming years.
Luxembourg Caprylic Acid Market: Production & Trade Performance (2019-2025)
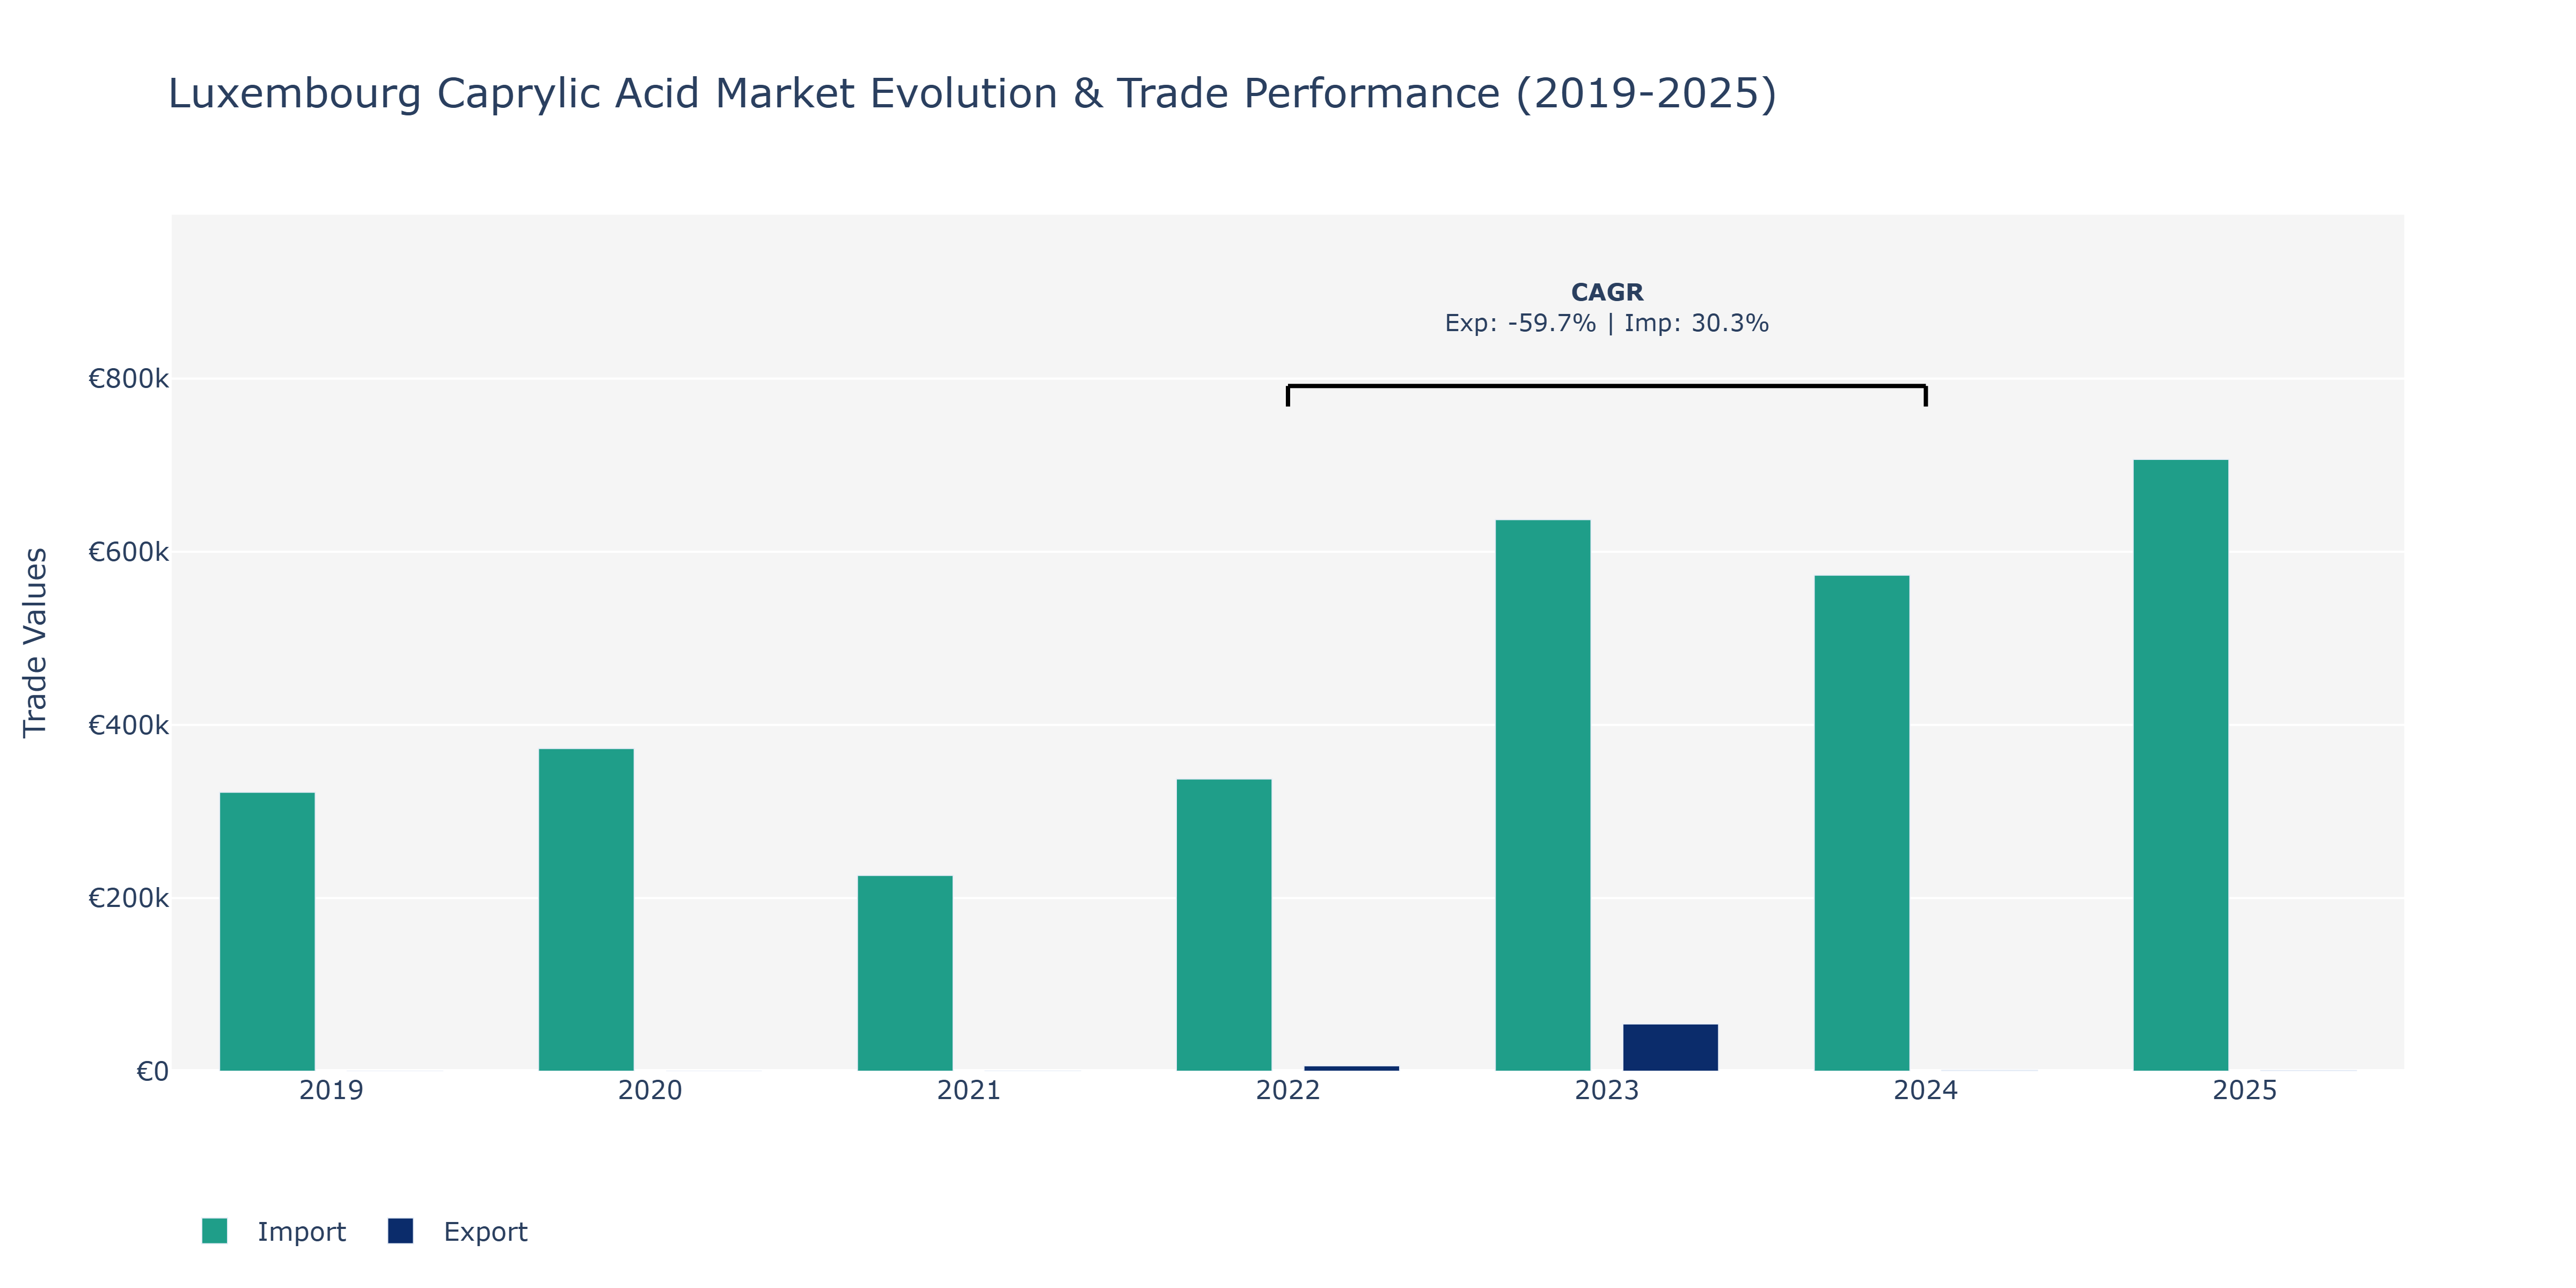
The Luxembourg Caprylic Acid Market exhibited notable fluctuations in both Exports and Imports from 2019 to 2025. In 2019, Imports dominated at €322.22 thousand, far surpassing Exports at €60 thousand. However, in 2020, Imports saw a substantial increase to €372.77 thousand. The year 2021 marked a reversal with Exports rising to €134 thousand while Imports decreased to €226.08 thousand. By 2022, Exports surged to €6.27 thousand, complemented by a rise in Imports to €337.53 thousand. The peak point for Imports was observed in 2023 at €637.13 thousand, whereas Exports peaked in 2025 at €765 thousand. The fluctuations in trade volumes can be attributed to factors such as changes in global demand for caprylic acid, shifts in supply chains, and advancements in production technologies impacting Luxembourg's market positioning in the industry.
Key Highlights of the Report:
- Luxembourg Caprylic Acid Market Outlook
- Market Size of Luxembourg Caprylic Acid Market, 2025
- Forecast of Luxembourg Caprylic Acid Market, 2032
- Historical Data and Forecast of Luxembourg Caprylic Acid Revenues & Volume for the Period 2022-2032F
- Luxembourg Caprylic Acid Market Trend Evolution
- Luxembourg Caprylic Acid Market Drivers and Challenges
- Luxembourg Caprylic Acid Price Trends
- Luxembourg Caprylic Acid Porter's Five Forces
- Luxembourg Caprylic Acid Industry Life Cycle
- Historical Data and Forecast of Luxembourg Caprylic Acid Market Revenues & Volume By Source for the Period 2022-2032F
- Historical Data and Forecast of Luxembourg Caprylic Acid Market Revenues & Volume By Coconut Oil for the Period 2022-2032F
- Historical Data and Forecast of Luxembourg Caprylic Acid Market Revenues & Volume By Palm Oil for the Period 2022-2032F
- Historical Data and Forecast of Luxembourg Caprylic Acid Market Revenues & Volume By Synthetic for the Period 2022-2032F
- Historical Data and Forecast of Luxembourg Caprylic Acid Market Revenues & Volume By Application for the Period 2022-2032F
- Historical Data and Forecast of Luxembourg Caprylic Acid Market Revenues & Volume By Antimicrobial Agent for the Period 2022-2032F
- Historical Data and Forecast of Luxembourg Caprylic Acid Market Revenues & Volume By Supplement Ingredient for the Period 2022-2032F
- Historical Data and Forecast of Luxembourg Caprylic Acid Market Revenues & Volume By Personal Care for the Period 2022-2032F
- Historical Data and Forecast of Luxembourg Caprylic Acid Market Revenues & Volume By End User for the Period 2022-2032F
- Historical Data and Forecast of Luxembourg Caprylic Acid Market Revenues & Volume By Food Industry for the Period 2022-2032F
- Historical Data and Forecast of Luxembourg Caprylic Acid Market Revenues & Volume By Pharmaceuticals for the Period 2022-2032F
- Historical Data and Forecast of Luxembourg Caprylic Acid Market Revenues & Volume By Cosmetics for the Period 2022-2032F
- Historical Data and Forecast of Luxembourg Caprylic Acid Market Revenues & Volume By Production Method for the Period 2022-2032F
- Historical Data and Forecast of Luxembourg Caprylic Acid Market Revenues & Volume By Fractionation for the Period 2022-2032F
- Historical Data and Forecast of Luxembourg Caprylic Acid Market Revenues & Volume By Extraction for the Period 2022-2032F
- Historical Data and Forecast of Luxembourg Caprylic Acid Market Revenues & Volume By Chemical Synthesis for the Period 2022-2032F
- Historical Data and Forecast of Luxembourg Caprylic Acid Market Revenues & Volume By Function for the Period 2022-2032F
- Historical Data and Forecast of Luxembourg Caprylic Acid Market Revenues & Volume By Emulsifier for the Period 2022-2032F
- Historical Data and Forecast of Luxembourg Caprylic Acid Market Revenues & Volume By Antifungal for the Period 2022-2032F
- Historical Data and Forecast of Luxembourg Caprylic Acid Market Revenues & Volume By Preservative for the Period 2022-2032F
- Luxembourg Caprylic Acid Import Export Trade Statistics
- Market Opportunity Assessment By Source
- Market Opportunity Assessment By Application
- Market Opportunity Assessment By End User
- Market Opportunity Assessment By Production Method
- Market Opportunity Assessment By Function
- Luxembourg Caprylic Acid Top Companies Market Share
- Luxembourg Caprylic Acid Competitive Benchmarking By Technical and Operational Parameters
- Luxembourg Caprylic Acid Company Profiles
- Luxembourg Caprylic Acid Key Strategic Recommendations
Frequently Asked Questions About the Market Study (FAQs):
6Wresearch actively monitors the Luxembourg Caprylic Acid Market and publishes its comprehensive annual report, highlighting emerging trends, growth drivers, revenue analysis, and forecast outlook. Our insights help businesses to make data-backed strategic decisions with ongoing market dynamics. Our analysts track relevent industries related to the Luxembourg Caprylic Acid Market, allowing our clients with actionable intelligence and reliable forecasts tailored to emerging regional needs.
Yes, we provide customisation as per your requirements. To learn more, feel free to contact us on sales@6wresearch.com
1 Executive Summary |
2 Introduction |
2.1 Key Highlights of the Report |
2.2 Report Description |
2.3 Market Scope & Segmentation |
2.4 Research Methodology |
2.5 Assumptions |
3 Luxembourg Caprylic Acid Market Overview |
3.1 Luxembourg Country Macro Economic Indicators |
3.2 Luxembourg Caprylic Acid Market Revenues & Volume, 2022 & 2032F |
3.3 Luxembourg Caprylic Acid Market - Industry Life Cycle |
3.4 Luxembourg Caprylic Acid Market - Porter's Five Forces |
3.5 Luxembourg Caprylic Acid Market Revenues & Volume Share, By Source, 2022 & 2032F |
3.6 Luxembourg Caprylic Acid Market Revenues & Volume Share, By Application, 2022 & 2032F |
3.7 Luxembourg Caprylic Acid Market Revenues & Volume Share, By End User, 2022 & 2032F |
3.8 Luxembourg Caprylic Acid Market Revenues & Volume Share, By Production Method, 2022 & 2032F |
3.9 Luxembourg Caprylic Acid Market Revenues & Volume Share, By Function, 2022 & 2032F |
4 Luxembourg Caprylic Acid Market Dynamics |
4.1 Impact Analysis |
4.2 Market Drivers |
4.3 Market Restraints |
5 Luxembourg Caprylic Acid Market Trends |
6 Luxembourg Caprylic Acid Market, By Types |
6.1 Luxembourg Caprylic Acid Market, By Source |
6.1.1 Overview and Analysis |
6.1.2 Luxembourg Caprylic Acid Market Revenues & Volume, By Source, 2022 - 2032F |
6.1.3 Luxembourg Caprylic Acid Market Revenues & Volume, By Coconut Oil, 2022 - 2032F |
6.1.4 Luxembourg Caprylic Acid Market Revenues & Volume, By Palm Oil, 2022 - 2032F |
6.1.5 Luxembourg Caprylic Acid Market Revenues & Volume, By Synthetic, 2022 - 2032F |
6.2 Luxembourg Caprylic Acid Market, By Application |
6.2.1 Overview and Analysis |
6.2.2 Luxembourg Caprylic Acid Market Revenues & Volume, By Antimicrobial Agent, 2022 - 2032F |
6.2.3 Luxembourg Caprylic Acid Market Revenues & Volume, By Supplement Ingredient, 2022 - 2032F |
6.2.4 Luxembourg Caprylic Acid Market Revenues & Volume, By Personal Care, 2022 - 2032F |
6.3 Luxembourg Caprylic Acid Market, By End User |
6.3.1 Overview and Analysis |
6.3.2 Luxembourg Caprylic Acid Market Revenues & Volume, By Food Industry, 2022 - 2032F |
6.3.3 Luxembourg Caprylic Acid Market Revenues & Volume, By Pharmaceuticals, 2022 - 2032F |
6.3.4 Luxembourg Caprylic Acid Market Revenues & Volume, By Cosmetics, 2022 - 2032F |
6.4 Luxembourg Caprylic Acid Market, By Production Method |
6.4.1 Overview and Analysis |
6.4.2 Luxembourg Caprylic Acid Market Revenues & Volume, By Fractionation, 2022 - 2032F |
6.4.3 Luxembourg Caprylic Acid Market Revenues & Volume, By Extraction, 2022 - 2032F |
6.4.4 Luxembourg Caprylic Acid Market Revenues & Volume, By Chemical Synthesis, 2022 - 2032F |
6.5 Luxembourg Caprylic Acid Market, By Function |
6.5.1 Overview and Analysis |
6.5.2 Luxembourg Caprylic Acid Market Revenues & Volume, By Emulsifier, 2022 - 2032F |
6.5.3 Luxembourg Caprylic Acid Market Revenues & Volume, By Antifungal, 2022 - 2032F |
6.5.4 Luxembourg Caprylic Acid Market Revenues & Volume, By Preservative, 2022 - 2032F |
7 Luxembourg Caprylic Acid Market Import-Export Trade Statistics |
7.1 Luxembourg Caprylic Acid Market Export to Major Countries |
7.2 Luxembourg Caprylic Acid Market Imports from Major Countries |
8 Luxembourg Caprylic Acid Market Key Performance Indicators |
9 Luxembourg Caprylic Acid Market - Opportunity Assessment |
9.1 Luxembourg Caprylic Acid Market Opportunity Assessment, By Source, 2022 & 2032F |
9.2 Luxembourg Caprylic Acid Market Opportunity Assessment, By Application, 2022 & 2032F |
9.3 Luxembourg Caprylic Acid Market Opportunity Assessment, By End User, 2022 & 2032F |
9.4 Luxembourg Caprylic Acid Market Opportunity Assessment, By Production Method, 2022 & 2032F |
9.5 Luxembourg Caprylic Acid Market Opportunity Assessment, By Function, 2022 & 2032F |
10 Luxembourg Caprylic Acid Market - Competitive Landscape |
10.1 Luxembourg Caprylic Acid Market Revenue Share, By Companies, 2025 |
10.2 Luxembourg Caprylic Acid Market Competitive Benchmarking, By Operating and Technical Parameters |
11 Company Profiles |
12 Recommendations |
13 Disclaimer |
Global Go To Market Strategy - 2030
Export potential enables firms to identify high-growth global markets with greater confidence by combining advanced trade intelligence with a structured quantitative methodology. The framework analyzes emerging demand trends and country-level import patterns while integrating macroeconomic and trade datasets such as GDP and population forecasts, bilateral import–export flows, tariff structures, elasticity differentials between developed and developing economies, geographic distance, and import demand projections. Using weighted trade values from 2020–2024 as the base period to project country-to-country export potential for 2030, these inputs are operationalized through calculated drivers such as gravity model parameters, tariff impact factors, and projected GDP per-capita growth. Through an analysis of hidden potentials, demand hotspots, and market conditions that are most favorable to success, this method enables firms to focus on target countries, maximize returns, and global expansion with data, backed by accuracy.
By factoring in the projected importer demand gap that is currently unmet and could be potential opportunity, it identifies the potential for the Exporter (Country) among 190 countries, against the general trade analysis, which identifies the biggest importer or exporter.
To discover high-growth global markets and optimize your business strategy:
Click Here
Pricing
- Single User License$ 1,995
- Department License$ 2,400
- Site License$ 3,120
- Global License$ 3,795

Leadership Perspectives from Industry Events
Search
Thought Leadership and Analyst Meet


Our Clients
6WResearch In News
- Doha a strategic location for EV manufacturing hub: IPA Qatar
- Demand for luxury TVs surging in the GCC, says Samsung
- Empowering Growth: The Thriving Journey of Bangladesh’s Cable Industry
- Demand for luxury TVs surging in the GCC, says Samsung
- Video call with a traditional healer? Once unthinkable, it’s now common in South Africa
- Intelligent Buildings To Smooth GCC’s Path To Net Zero
Latest Reports
- Taiwan Airport Wireless Infrastructure Market (2026-2032)
- Vietnam Airport Wireless Infrastructure Market (2026-2032)
- Thailand Airport Wireless Infrastructure Market (2026-2032)
- South Korea Airport Wireless Infrastructure Market (2026-2032)
- Romania Airport Wireless Infrastructure Market (2026-2032)
- Qatar Airport Wireless Infrastructure Market (2026-2032)
- Philippines Airport Wireless Infrastructure Market (2026-2032)
- Japan Airport Wireless Infrastructure Market (2026-2032)
- Taiwan Airport Winter Services Market (2026-2032)
- Vietnam Airport Winter Services Market (2026-2032)
Industry Events and Analyst Meet

HIMTEX 2026

India Refining Summit 2026

India EV Show 2026

EV tech India Expo 2026

Auto Tech Asia 2026
Whitepaper
- Middle East & Africa Commercial Security Market Click here to view more.
- Middle East & Africa Fire Safety Systems & Equipment Market Click here to view more.
- GCC Drone Market Click here to view more.
- Middle East Lighting Fixture Market Click here to view more.
- GCC Physical & Perimeter Security Market Click here to view more.