Luxembourg Drinking Chocolate Market (2026-2032) | Share, Analysis, Companies, Competitive Landscape, Industry, Outlook, Size & Revenue, Segmentation, Value, Growth, Trends, Forecast
Market Forecast By Type (Dark chocolate, Milk chocolate, White), By Cocoa content (60-90%, 40-60%, 30-40%, Others), By Distribution channel (Hypermarkets/supermarkets, Specialty store, Convenience stores, Online store, Other), By Application (Chocolate Drinks, Protein Shakes, Energy Drinks, Coffee Mixes, Others), By Flavour (Vanilla, Caramel, Honey, Hazelnut), By Form (Powder, Liquid), By Target customers (Adults, Kids), By End users (Food Service Providers, Household/Domestic, Corporates, Airlines) And Competitive Landscape
| Product Code: ETC8061130 | Publication Date: Sep 2024 | Updated Date: Apr 2026 | Product Type: Market Research Report | |
| Publisher: 6Wresearch | Author: Vasudha | No. of Pages: 75 | No. of Figures: 35 | No. of Tables: 20 |
Luxembourg Drinking Chocolate Market Size (2020-2030)
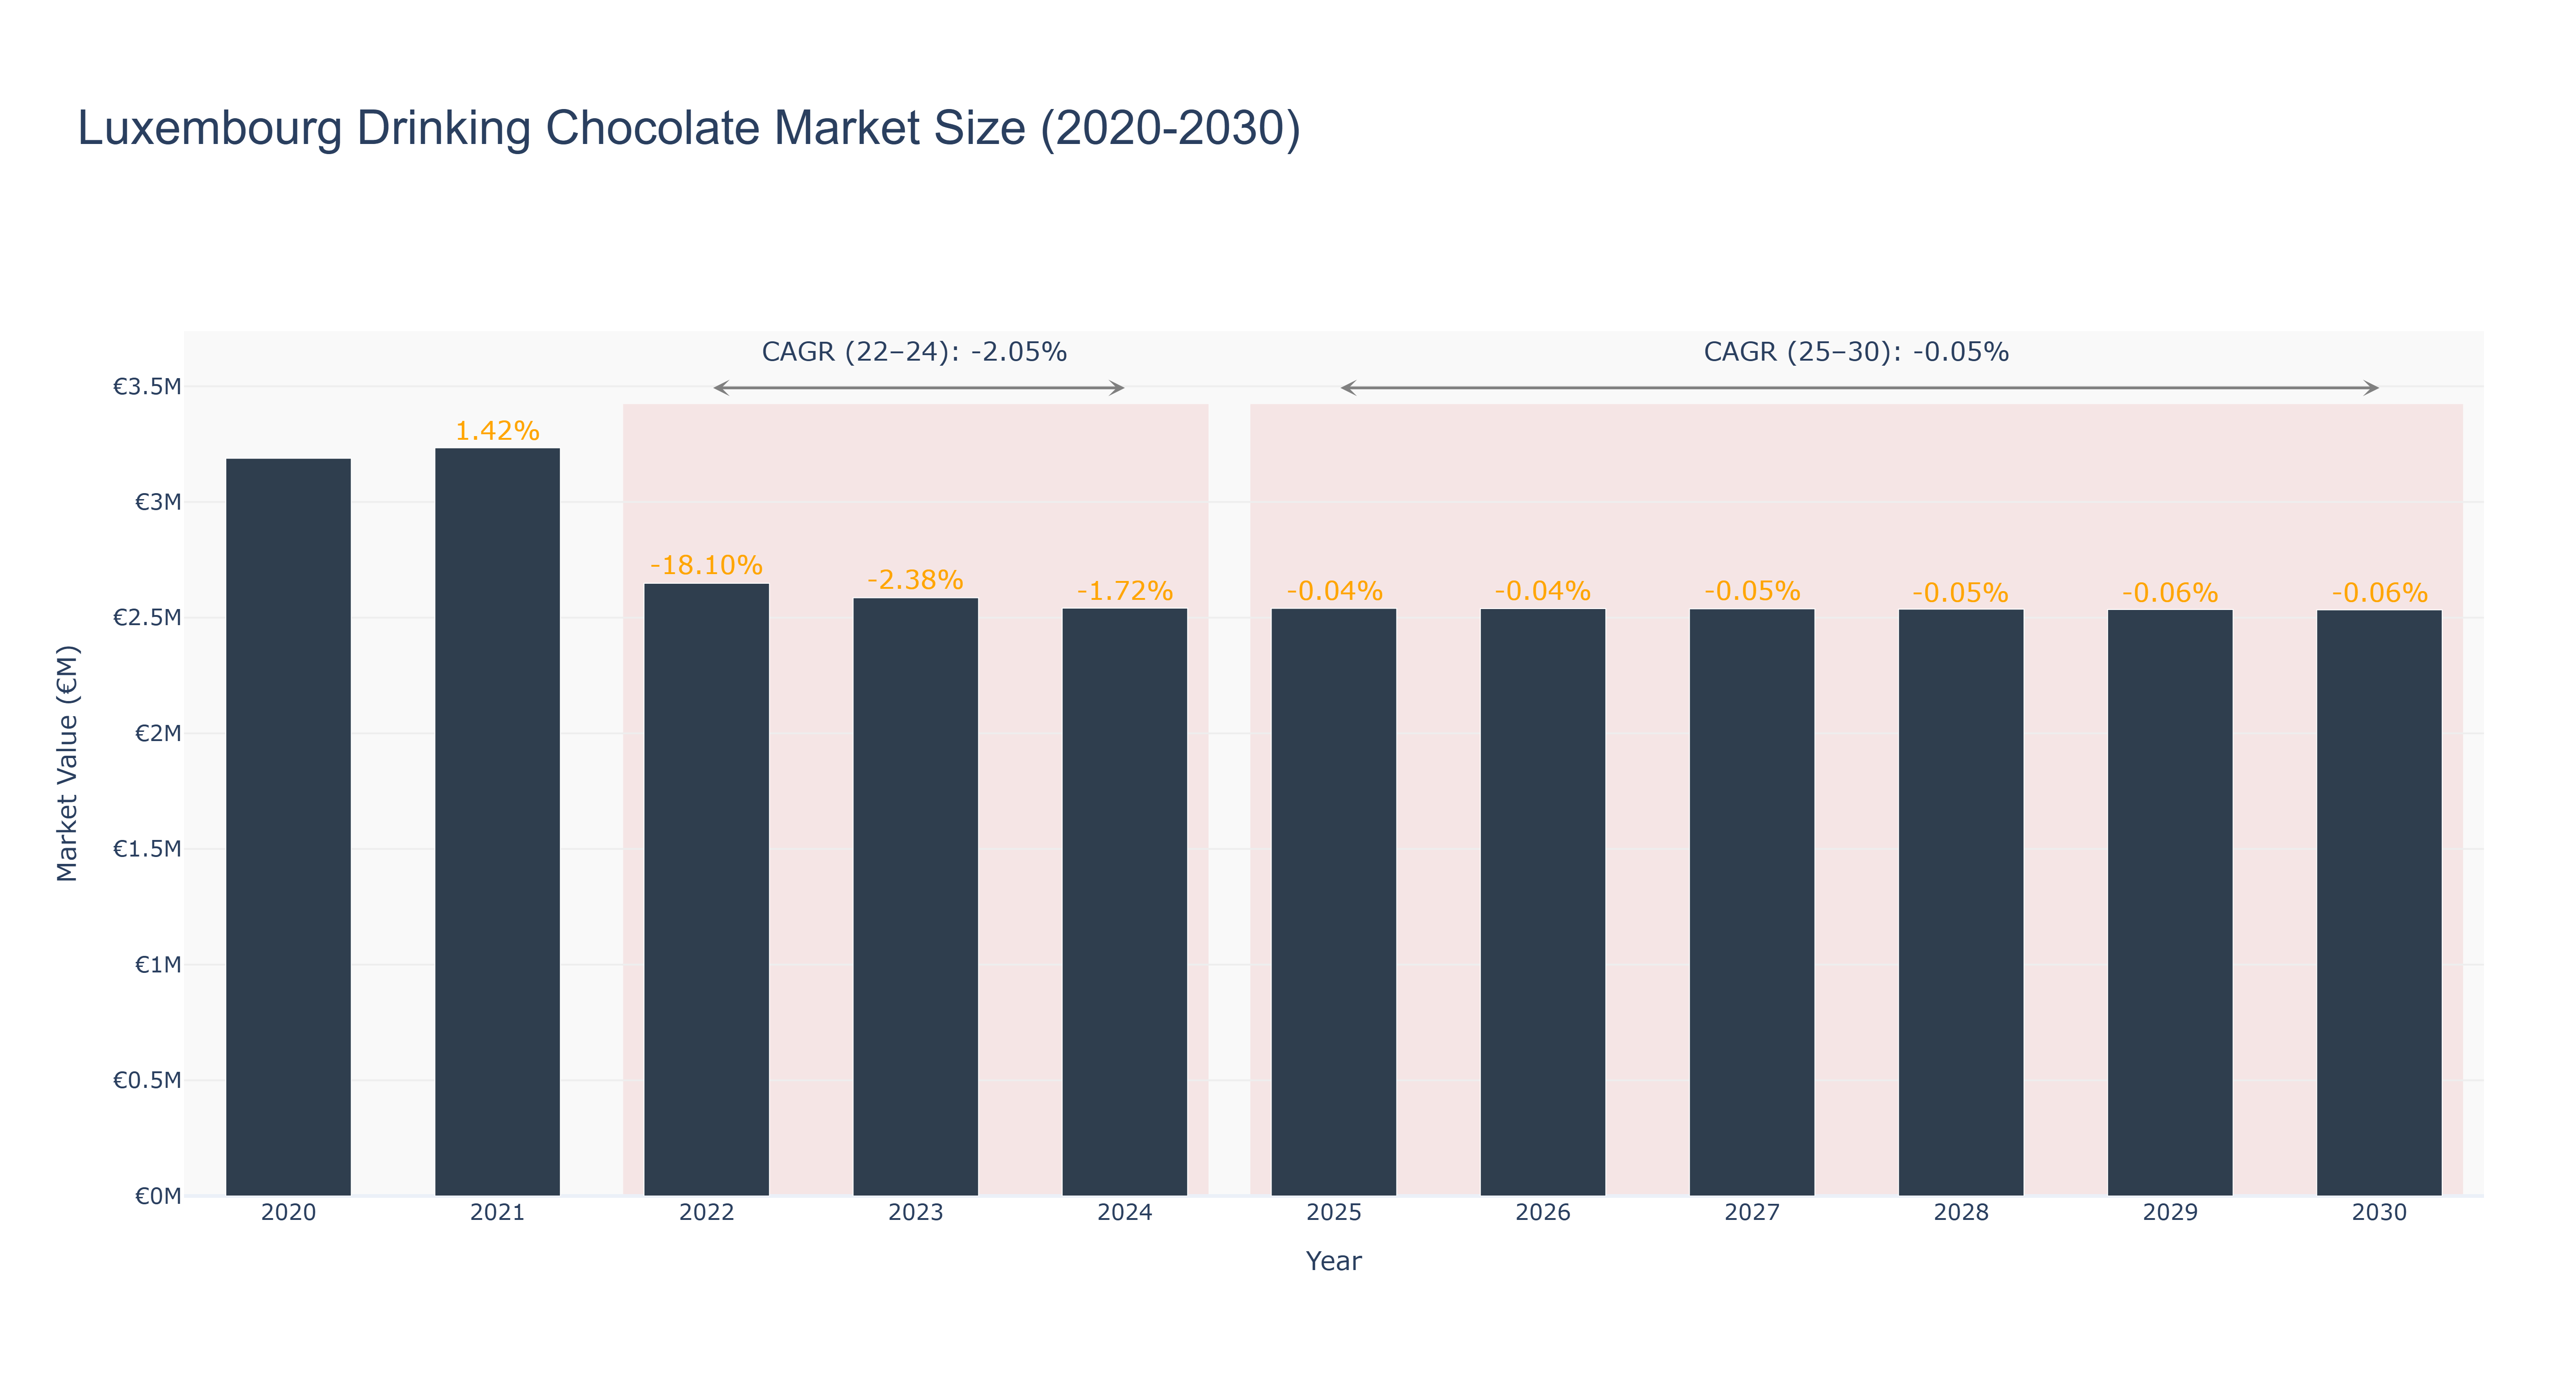
Luxembourg Drinking Chocolate Market has shown a declining trend in market size from €3.19 million in 2020 to €2.54 million in 2024. The market is forecasted to continue this downward trajectory with an expected size of €2.53 million in 2030. The CAGR for the period 2022-24 is -2.05%, while for 2025-30, it stands at -0.05%. This decline can be attributed to changing consumer preferences towards healthier alternatives, increased competition from other beverage options, and economic factors affecting consumer spending. Despite the current challenges, the market is looking towards innovative product offerings, sustainable sourcing practices, and digital marketing strategies to revitalize growth in the near future. Luxembourg Drinking Chocolate Market's future success will heavily depend on its ability to adapt to evolving consumer demands and differentiate itself in a competitive landscape.
Luxembourg Drinking Chocolate Market: Production & Trade Performance (2019-2025)
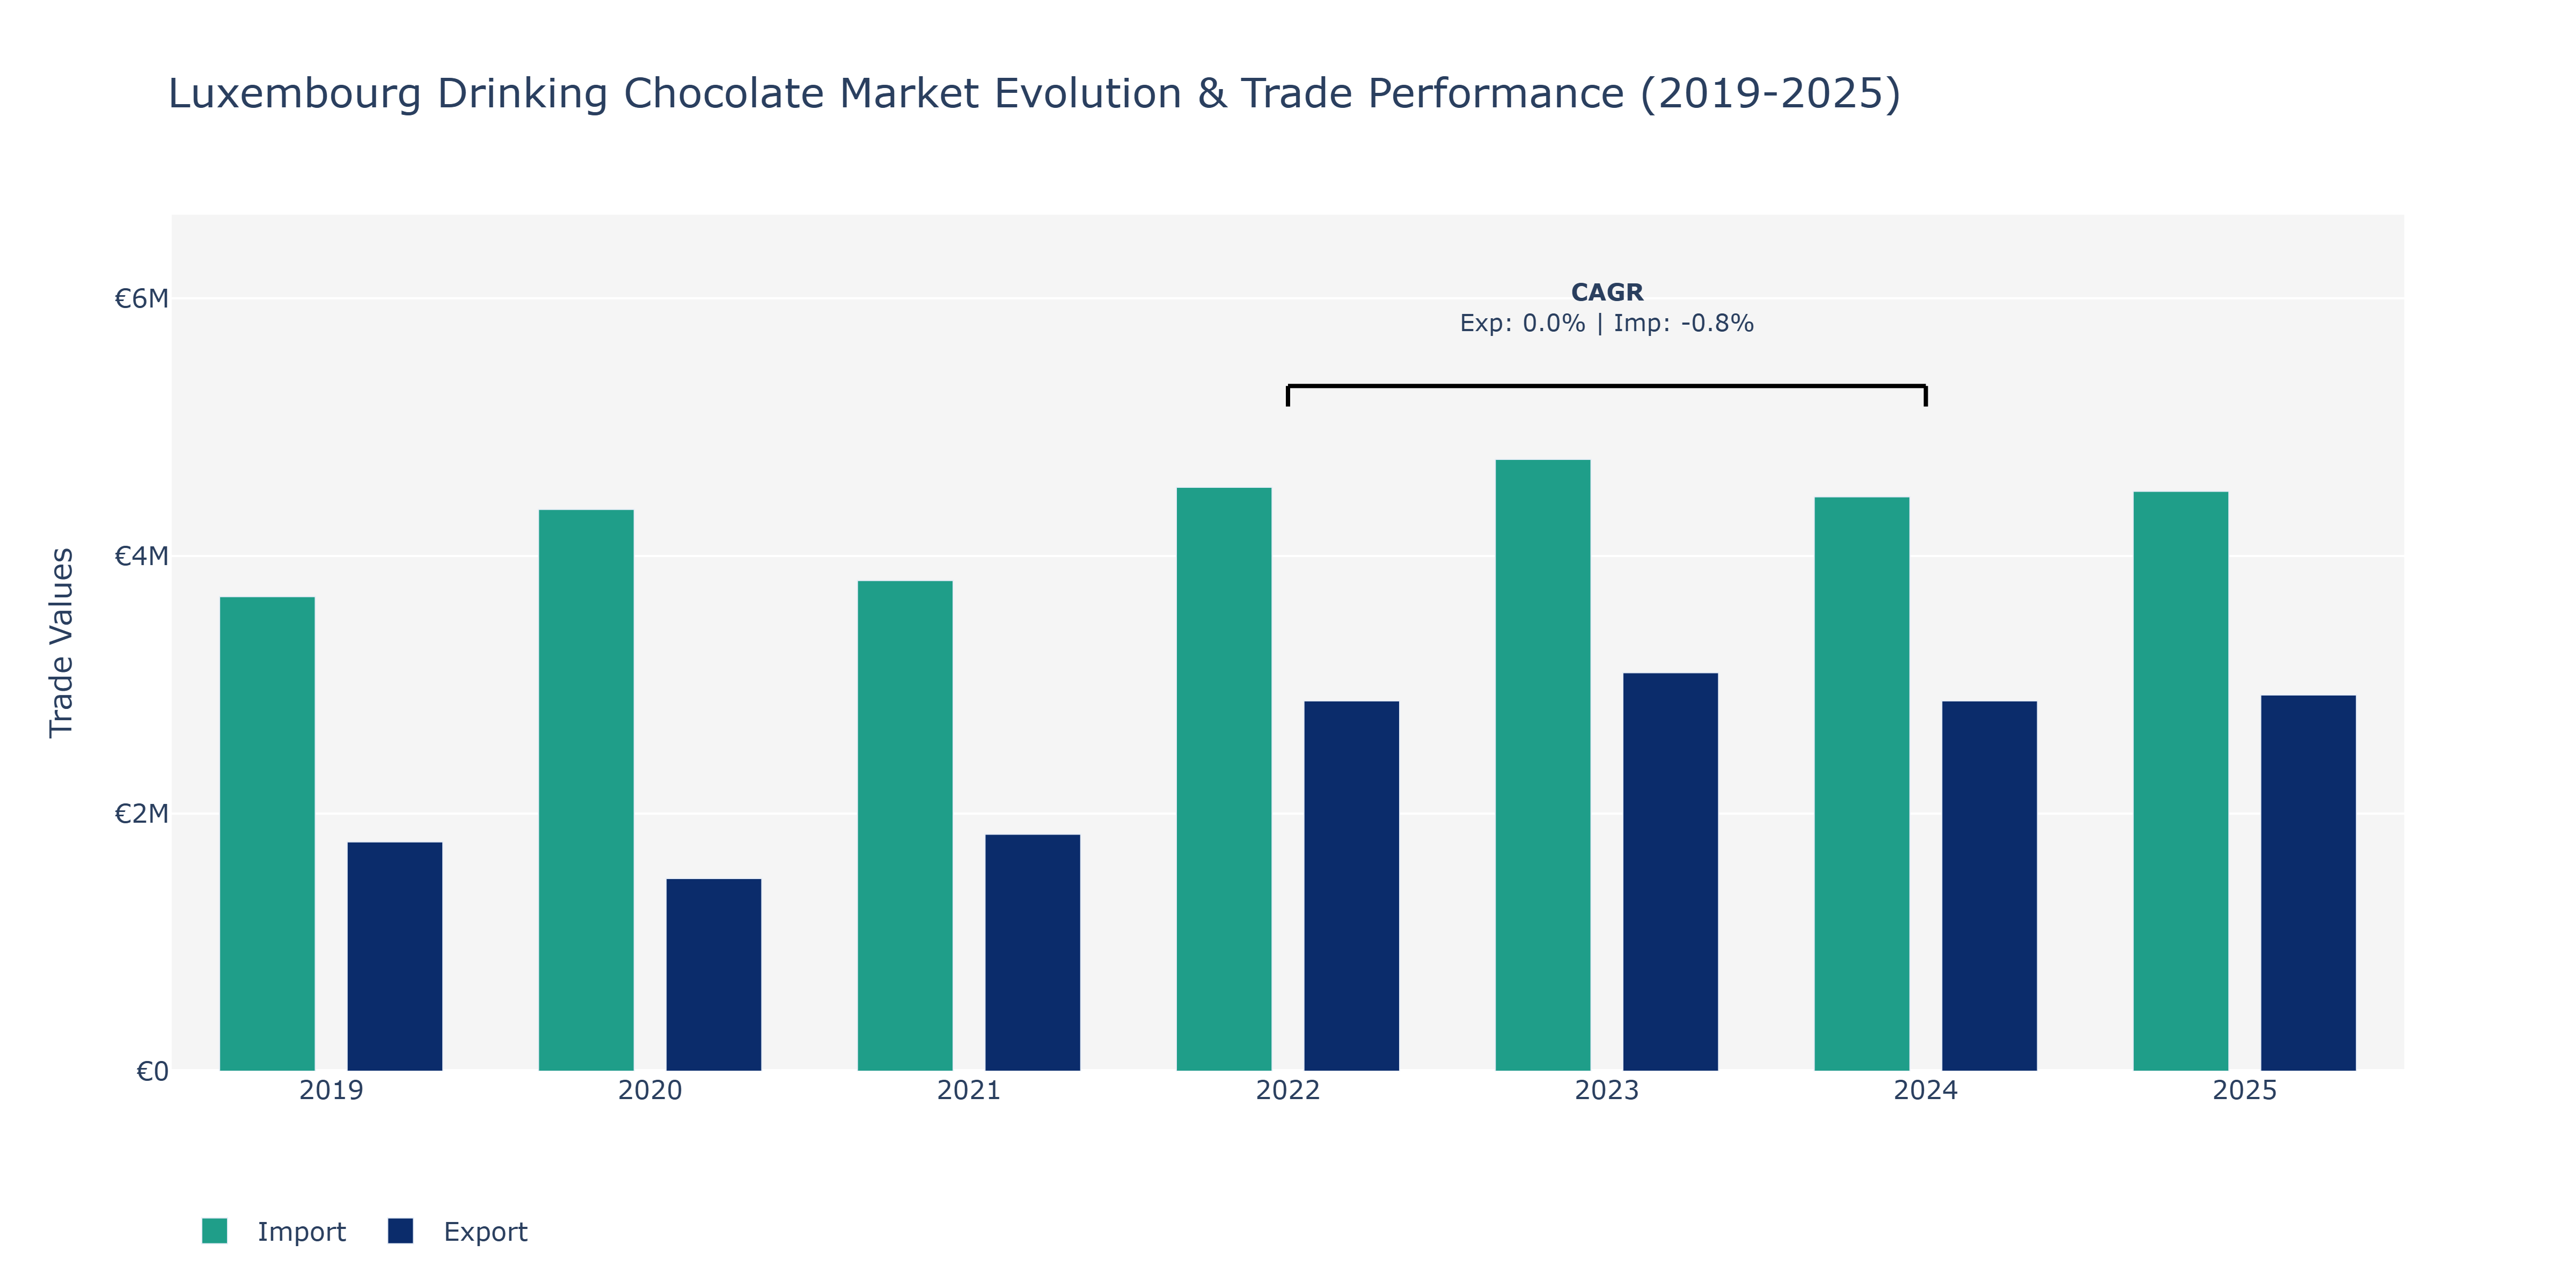
From 2019 to 2025, the Luxembourg Drinking Chocolate Market witnessed fluctuations in both exports and imports. Exports started at €1.78 million in 2019, decreased to €1.5 million in 2020, and then showed an increasing trend, reaching €2.92 million in 2025. On the other hand, imports began at €3.68 million in 2019, experienced a peak in 2023 at €4.75 million, and then slightly decreased to €4.5 million in 2025. The market saw a notable peak in exports in 2025, possibly due to increased demand for premium drinking chocolate products. The fluctuation in imports could be attributed to shifts in global cocoa prices or changes in trade agreements affecting the market. The decline in imports from 2023 to 2025 might be influenced by efforts to promote domestic production or changes in consumer preferences towards local brands.
Key Highlights of the Report:
- Luxembourg Drinking Chocolate Market Outlook
- Market Size of Luxembourg Drinking Chocolate Market, 2025
- Forecast of Luxembourg Drinking Chocolate Market, 2032
- Historical Data and Forecast of Luxembourg Drinking Chocolate Revenues & Volume for the Period 2022-2032F
- Luxembourg Drinking Chocolate Market Trend Evolution
- Luxembourg Drinking Chocolate Market Drivers and Challenges
- Luxembourg Drinking Chocolate Price Trends
- Luxembourg Drinking Chocolate Porter's Five Forces
- Luxembourg Drinking Chocolate Industry Life Cycle
- Historical Data and Forecast of Luxembourg Drinking Chocolate Market Revenues & Volume By Type for the Period 2022-2032F
- Historical Data and Forecast of Luxembourg Drinking Chocolate Market Revenues & Volume By Dark chocolate for the Period 2022-2032F
- Historical Data and Forecast of Luxembourg Drinking Chocolate Market Revenues & Volume By Milk chocolate for the Period 2022-2032F
- Historical Data and Forecast of Luxembourg Drinking Chocolate Market Revenues & Volume By White for the Period 2022-2032F
- Historical Data and Forecast of Luxembourg Drinking Chocolate Market Revenues & Volume By Cocoa content for the Period 2022-2032F
- Historical Data and Forecast of Luxembourg Drinking Chocolate Market Revenues & Volume By 60-90% for the Period 2022-2032F
- Historical Data and Forecast of Luxembourg Drinking Chocolate Market Revenues & Volume By 40-60% for the Period 2022-2032F
- Historical Data and Forecast of Luxembourg Drinking Chocolate Market Revenues & Volume By 30-40% for the Period 2022-2032F
- Historical Data and Forecast of Luxembourg Drinking Chocolate Market Revenues & Volume By Others for the Period 2022-2032F
- Historical Data and Forecast of Luxembourg Drinking Chocolate Market Revenues & Volume By Distribution channel for the Period 2022-2032F
- Historical Data and Forecast of Luxembourg Drinking Chocolate Market Revenues & Volume By Hypermarkets/supermarkets for the Period 2022-2032F
- Historical Data and Forecast of Luxembourg Drinking Chocolate Market Revenues & Volume By Specialty store for the Period 2022-2032F
- Historical Data and Forecast of Luxembourg Drinking Chocolate Market Revenues & Volume By Convenience stores for the Period 2022-2032F
- Historical Data and Forecast of Luxembourg Drinking Chocolate Market Revenues & Volume By Online store for the Period 2022-2032F
- Historical Data and Forecast of Luxembourg Drinking Chocolate Market Revenues & Volume By Other for the Period 2022-2032F
- Historical Data and Forecast of Luxembourg Drinking Chocolate Market Revenues & Volume By Application for the Period 2022-2032F
- Historical Data and Forecast of Luxembourg Drinking Chocolate Market Revenues & Volume By Chocolate Drinks for the Period 2022-2032F
- Historical Data and Forecast of Luxembourg Drinking Chocolate Market Revenues & Volume By Protein Shakes for the Period 2022-2032F
- Historical Data and Forecast of Luxembourg Drinking Chocolate Market Revenues & Volume By Energy Drinks for the Period 2022-2032F
- Historical Data and Forecast of Luxembourg Drinking Chocolate Market Revenues & Volume By Coffee Mixes for the Period 2022-2032F
- Historical Data and Forecast of Luxembourg Drinking Chocolate Market Revenues & Volume By Others for the Period 2022-2032F
- Historical Data and Forecast of Luxembourg Drinking Chocolate Market Revenues & Volume By Flavour for the Period 2022-2032F
- Historical Data and Forecast of Luxembourg Drinking Chocolate Market Revenues & Volume By Vanilla for the Period 2022-2032F
- Historical Data and Forecast of Luxembourg Drinking Chocolate Market Revenues & Volume By Caramel for the Period 2022-2032F
- Historical Data and Forecast of Luxembourg Drinking Chocolate Market Revenues & Volume By Honey for the Period 2022-2032F
- Historical Data and Forecast of Luxembourg Drinking Chocolate Market Revenues & Volume By Hazelnut for the Period 2022-2032F
- Historical Data and Forecast of Luxembourg Drinking Chocolate Market Revenues & Volume By Form for the Period 2022-2032F
- Historical Data and Forecast of Luxembourg Drinking Chocolate Market Revenues & Volume By Powder for the Period 2022-2032F
- Historical Data and Forecast of Luxembourg Drinking Chocolate Market Revenues & Volume By Liquid for the Period 2022-2032F
- Historical Data and Forecast of Luxembourg Drinking Chocolate Market Revenues & Volume By Target customers for the Period 2022-2032F
- Historical Data and Forecast of Luxembourg Drinking Chocolate Market Revenues & Volume By Adults for the Period 2022-2032F
- Historical Data and Forecast of Luxembourg Drinking Chocolate Market Revenues & Volume By Kids for the Period 2022-2032F
- Historical Data and Forecast of Luxembourg Drinking Chocolate Market Revenues & Volume By End users for the Period 2022-2032F
- Historical Data and Forecast of Luxembourg Drinking Chocolate Market Revenues & Volume By Food Service Providers for the Period 2022-2032F
- Historical Data and Forecast of Luxembourg Drinking Chocolate Market Revenues & Volume By Household/Domestic for the Period 2022-2032F
- Historical Data and Forecast of Luxembourg Drinking Chocolate Market Revenues & Volume By Corporates for the Period 2022-2032F
- Historical Data and Forecast of Luxembourg Drinking Chocolate Market Revenues & Volume By Airlines for the Period 2022-2032F
- Luxembourg Drinking Chocolate Import Export Trade Statistics
- Market Opportunity Assessment By Type
- Market Opportunity Assessment By Cocoa content
- Market Opportunity Assessment By Distribution channel
- Market Opportunity Assessment By Application
- Market Opportunity Assessment By Flavour
- Market Opportunity Assessment By Form
- Market Opportunity Assessment By Target customers
- Market Opportunity Assessment By End users
- Luxembourg Drinking Chocolate Top Companies Market Share
- Luxembourg Drinking Chocolate Competitive Benchmarking By Technical and Operational Parameters
- Luxembourg Drinking Chocolate Company Profiles
- Luxembourg Drinking Chocolate Key Strategic Recommendations
Frequently Asked Questions About the Market Study (FAQs):
6Wresearch actively monitors the Luxembourg Drinking Chocolate Market and publishes its comprehensive annual report, highlighting emerging trends, growth drivers, revenue analysis, and forecast outlook. Our insights help businesses to make data-backed strategic decisions with ongoing market dynamics. Our analysts track relevent industries related to the Luxembourg Drinking Chocolate Market, allowing our clients with actionable intelligence and reliable forecasts tailored to emerging regional needs.
Yes, we provide customisation as per your requirements. To learn more, feel free to contact us on sales@6wresearch.com
1 Executive Summary |
2 Introduction |
2.1 Key Highlights of the Report |
2.2 Report Description |
2.3 Market Scope & Segmentation |
2.4 Research Methodology |
2.5 Assumptions |
3 Luxembourg Drinking Chocolate Market Overview |
3.1 Luxembourg Country Macro Economic Indicators |
3.2 Luxembourg Drinking Chocolate Market Revenues & Volume, 2022 & 2032F |
3.3 Luxembourg Drinking Chocolate Market - Industry Life Cycle |
3.4 Luxembourg Drinking Chocolate Market - Porter's Five Forces |
3.5 Luxembourg Drinking Chocolate Market Revenues & Volume Share, By Type, 2022 & 2032F |
3.6 Luxembourg Drinking Chocolate Market Revenues & Volume Share, By Cocoa content, 2022 & 2032F |
3.7 Luxembourg Drinking Chocolate Market Revenues & Volume Share, By Distribution channel, 2022 & 2032F |
3.8 Luxembourg Drinking Chocolate Market Revenues & Volume Share, By Application, 2022 & 2032F |
3.9 Luxembourg Drinking Chocolate Market Revenues & Volume Share, By Flavour, 2022 & 2032F |
3.10 Luxembourg Drinking Chocolate Market Revenues & Volume Share, By Form, 2022 & 2032F |
3.11 Luxembourg Drinking Chocolate Market Revenues & Volume Share, By Target customers, 2022 & 2032F |
4 Luxembourg Drinking Chocolate Market Dynamics |
4.1 Impact Analysis |
4.2 Market Drivers |
4.2.1 Increasing consumer awareness about the health benefits of drinking chocolate |
4.2.2 Growing demand for premium and artisanal drinking chocolate products |
4.2.3 Rising trend of indulgence and consumption of luxury food products |
4.3 Market Restraints |
4.3.1 Price sensitivity among consumers due to the premium pricing of drinking chocolate products |
4.3.2 Availability of substitutes such as coffee, tea, and other hot beverages |
4.3.3 Seasonal demand fluctuations impacting sales |
5 Luxembourg Drinking Chocolate Market Trends |
6 Luxembourg Drinking Chocolate Market, By Types |
6.1 Luxembourg Drinking Chocolate Market, By Type |
6.1.1 Overview and Analysis |
6.1.2 Luxembourg Drinking Chocolate Market Revenues & Volume, By Type, 2022-2032F |
6.1.3 Luxembourg Drinking Chocolate Market Revenues & Volume, By Dark chocolate, 2022-2032F |
6.1.4 Luxembourg Drinking Chocolate Market Revenues & Volume, By Milk chocolate, 2022-2032F |
6.1.5 Luxembourg Drinking Chocolate Market Revenues & Volume, By White, 2022-2032F |
6.2 Luxembourg Drinking Chocolate Market, By Cocoa content |
6.2.1 Overview and Analysis |
6.2.2 Luxembourg Drinking Chocolate Market Revenues & Volume, By 60-90%, 2022-2032F |
6.2.3 Luxembourg Drinking Chocolate Market Revenues & Volume, By 40-60%, 2022-2032F |
6.2.4 Luxembourg Drinking Chocolate Market Revenues & Volume, By 30-40%, 2022-2032F |
6.2.5 Luxembourg Drinking Chocolate Market Revenues & Volume, By Others, 2022-2032F |
6.3 Luxembourg Drinking Chocolate Market, By Distribution channel |
6.3.1 Overview and Analysis |
6.3.2 Luxembourg Drinking Chocolate Market Revenues & Volume, By Hypermarkets/supermarkets, 2022-2032F |
6.3.3 Luxembourg Drinking Chocolate Market Revenues & Volume, By Specialty store, 2022-2032F |
6.3.4 Luxembourg Drinking Chocolate Market Revenues & Volume, By Convenience stores, 2022-2032F |
6.3.5 Luxembourg Drinking Chocolate Market Revenues & Volume, By Online store, 2022-2032F |
6.3.6 Luxembourg Drinking Chocolate Market Revenues & Volume, By Other, 2022-2032F |
6.4 Luxembourg Drinking Chocolate Market, By Application |
6.4.1 Overview and Analysis |
6.4.2 Luxembourg Drinking Chocolate Market Revenues & Volume, By Chocolate Drinks, 2022-2032F |
6.4.3 Luxembourg Drinking Chocolate Market Revenues & Volume, By Protein Shakes, 2022-2032F |
6.4.4 Luxembourg Drinking Chocolate Market Revenues & Volume, By Energy Drinks, 2022-2032F |
6.4.5 Luxembourg Drinking Chocolate Market Revenues & Volume, By Coffee Mixes, 2022-2032F |
6.4.6 Luxembourg Drinking Chocolate Market Revenues & Volume, By Others, 2022-2032F |
6.5 Luxembourg Drinking Chocolate Market, By Flavour |
6.5.1 Overview and Analysis |
6.5.2 Luxembourg Drinking Chocolate Market Revenues & Volume, By Vanilla, 2022-2032F |
6.5.3 Luxembourg Drinking Chocolate Market Revenues & Volume, By Caramel, 2022-2032F |
6.5.4 Luxembourg Drinking Chocolate Market Revenues & Volume, By Honey, 2022-2032F |
6.5.5 Luxembourg Drinking Chocolate Market Revenues & Volume, By Hazelnut, 2022-2032F |
6.6 Luxembourg Drinking Chocolate Market, By Form |
6.6.1 Overview and Analysis |
6.6.2 Luxembourg Drinking Chocolate Market Revenues & Volume, By Powder, 2022-2032F |
6.6.3 Luxembourg Drinking Chocolate Market Revenues & Volume, By Liquid, 2022-2032F |
6.7 Luxembourg Drinking Chocolate Market, By Target customers |
6.7.1 Overview and Analysis |
6.7.2 Luxembourg Drinking Chocolate Market Revenues & Volume, By Adults, 2022-2032F |
6.7.3 Luxembourg Drinking Chocolate Market Revenues & Volume, By Kids, 2022-2032F |
6.8 Luxembourg Drinking Chocolate Market, By End users |
6.8.1 Overview and Analysis |
6.8.2 Luxembourg Drinking Chocolate Market Revenues & Volume, By Food Service Providers, 2022-2032F |
6.8.3 Luxembourg Drinking Chocolate Market Revenues & Volume, By Household/Domestic, 2022-2032F |
6.8.4 Luxembourg Drinking Chocolate Market Revenues & Volume, By Airlines, 2022-2032F |
6.8.5 Luxembourg Drinking Chocolate Market Revenues & Volume, By Airlines, 2022-2032F |
7 Luxembourg Drinking Chocolate Market Import-Export Trade Statistics |
7.1 Luxembourg Drinking Chocolate Market Export to Major Countries |
7.2 Luxembourg Drinking Chocolate Market Imports from Major Countries |
8 Luxembourg Drinking Chocolate Market Key Performance Indicators |
8.1 Average order value per customer |
8.2 Customer retention rate |
8.3 Customer satisfaction score |
8.4 Number of new product launches or innovations |
8.5 Social media engagement metrics (likes, shares, comments) |
9 Luxembourg Drinking Chocolate Market - Opportunity Assessment |
9.1 Luxembourg Drinking Chocolate Market Opportunity Assessment, By Type, 2022 & 2032F |
9.2 Luxembourg Drinking Chocolate Market Opportunity Assessment, By Cocoa content, 2022 & 2032F |
9.3 Luxembourg Drinking Chocolate Market Opportunity Assessment, By Distribution channel, 2022 & 2032F |
9.4 Luxembourg Drinking Chocolate Market Opportunity Assessment, By Application, 2022 & 2032F |
9.5 Luxembourg Drinking Chocolate Market Opportunity Assessment, By Flavour, 2022 & 2032F |
9.6 Luxembourg Drinking Chocolate Market Opportunity Assessment, By Form, 2022 & 2032F |
9.7 Luxembourg Drinking Chocolate Market Opportunity Assessment, By Target customers, 2022 & 2032F |
9.7 Luxembourg Drinking Chocolate Market Opportunity Assessment, By End users, 2022 & 2032F |
10 Luxembourg Drinking Chocolate Market - Competitive Landscape |
10.1 Luxembourg Drinking Chocolate Market Revenue Share, By Companies, 2025 |
10.2 Luxembourg Drinking Chocolate Market Competitive Benchmarking, By Operating and Technical Parameters |
11 Company Profiles |
12 Recommendations |
13 Disclaimer |
Export potential assessment - trade Analytics for 2030
Export potential enables firms to identify high-growth global markets with greater confidence by combining advanced trade intelligence with a structured quantitative methodology. The framework analyzes emerging demand trends and country-level import patterns while integrating macroeconomic and trade datasets such as GDP and population forecasts, bilateral import–export flows, tariff structures, elasticity differentials between developed and developing economies, geographic distance, and import demand projections. Using weighted trade values from 2020–2024 as the base period to project country-to-country export potential for 2030, these inputs are operationalized through calculated drivers such as gravity model parameters, tariff impact factors, and projected GDP per-capita growth. Through an analysis of hidden potentials, demand hotspots, and market conditions that are most favorable to success, this method enables firms to focus on target countries, maximize returns, and global expansion with data, backed by accuracy.
By factoring in the projected importer demand gap that is currently unmet and could be potential opportunity, it identifies the potential for the Exporter (Country) among 190 countries, against the general trade analysis, which identifies the biggest importer or exporter.
To discover high-growth global markets and optimize your business strategy:
Click Here
Pricing
- Single User License$ 1,995
- Department License$ 2,400
- Site License$ 3,120
- Global License$ 3,795

Search
Thought Leadership and Analyst Meet


Our Clients
Latest Reports
- China Electric Appliance Rental Market (2026-2032) | Trends, Revenue, Growth, Challenges, Size, Value, Outlook, Pricing, Strategy, Insights, Restraints, segmentation, Companies, Investment Opportunities, Analysis, Demand, Drivers, Competition, Forecast, Share
- Chile Electric Appliance Rental Market (2026-2032) | Outlook, Competition, Drivers, Strategy, Revenue, Analysis, Value, Pricing, Restraints, Size, Demand, Share, Growth, Forecast, Challenges, Insights, Investment Opportunities, Companies, Trends, segmentation
- Cambodia Electric Appliance Rental Market (2026-2032) | Companies, Analysis, Restraints, Pricing, Insights, Challenges, Outlook, Strategy, Forecast, Trends, Competition, Value, Revenue, Investment Opportunities, segmentation, Drivers, Size, Demand, Growth, Share
- Brazil Electric Appliance Rental Market (2026-2032) | Revenue, Strategy, Forecast, Companies, segmentation, Competition, Size, Investment Opportunities, Pricing, Restraints, Outlook, Challenges, Analysis, Drivers, Value, Demand, Insights, Trends, Growth, Share
- Bangladesh Electric Appliance Rental Market (2026-2032) | Drivers, Forecast, Investment Opportunities, Strategy, Insights, Demand, Challenges, Outlook, Trends, Competition, Value, Revenue, Size, Pricing, Analysis, Companies, Restraints, segmentation, Share, Growth
- Bahrain Electric Appliance Rental Market (2026-2032) | Outlook, Size, Competition, Restraints, Drivers, Value, Trends, Investment Opportunities, Insights, Forecast, Revenue, Strategy, Growth, Share, Demand, Analysis, Challenges, Companies, segmentation, Pricing
- Azerbaijan Electric Appliance Rental Market (2026-2032) | Trends, Investment Opportunities, Restraints, Insights, Strategy, Competition, Value, Growth, Demand, Drivers, Analysis, Forecast, Size, Share, Outlook, segmentation, Pricing, Challenges, Revenue, Companies
- Australia Electric Appliance Rental Market (2026-2032) | Challenges, Restraints, Forecast, Demand, Size, Competition, Pricing, Investment Opportunities, Revenue, Trends, Drivers, Growth, Outlook, Analysis, Strategy, Value, segmentation, Insights, Companies, Share
- Argentina Electric Appliance Rental Market (2026-2032) | Growth, Trends, Insights, Outlook, Forecast, Size, Drivers, Analysis, Restraints, Challenges, Share, Revenue, Investment Opportunities, Strategy, Demand, Value, Companies, segmentation, Competition, Pricing
- Algeria Electric Appliance Rental Market (2026-2032) | Share, Size, Value, Strategy, Competition, Outlook, Challenges, Companies, Trends, Pricing, Insights, Forecast, Investment Opportunities, Revenue, Growth, Restraints, segmentation, Analysis, Demand, Drivers
Industry Events and Analyst Meet

HIMTEX 2026

India Refining Summit 2026

India EV Show 2026

EV tech India Expo 2026

Auto Tech Asia 2026
Whitepaper
- Middle East & Africa Commercial Security Market Click here to view more.
- Middle East & Africa Fire Safety Systems & Equipment Market Click here to view more.
- GCC Drone Market Click here to view more.
- Middle East Lighting Fixture Market Click here to view more.
- GCC Physical & Perimeter Security Market Click here to view more.
6WResearch In News
- Doha a strategic location for EV manufacturing hub: IPA Qatar
- Demand for luxury TVs surging in the GCC, says Samsung
- Empowering Growth: The Thriving Journey of Bangladesh’s Cable Industry
- Demand for luxury TVs surging in the GCC, says Samsung
- Video call with a traditional healer? Once unthinkable, it’s now common in South Africa
- Intelligent Buildings To Smooth GCC’s Path To Net Zero