Malaysia Fin Fish Market (2026-2032) | Trends, Share, Industry, Size, Outlook, Forecast, Revenue, Value, Companies, Growth & Analysis
Market Forecast By Environment (Freshwater, Marine Water, Brackish Water), By Fish Type (Pompano, Snappers, Groupers, Salmon, Milkfish, Tuna, Catfish, Others) And Competitive Landscape
| Product Code: ETC038827 | Publication Date: Jun 2023 | Updated Date: Jun 2026 | Product Type: Report | |
| Publisher: 6Wresearch | Author: Ravi Bhandari | No. of Pages: 70 | No. of Figures: 35 | No. of Tables: 5 |
Malaysia Fin Fish Market Summary
The malaysia fin fish market was estimated at USD 461 Million in 2025 and is projected to reach USD 598 Million by 2032, growing at a CAGR of 5.2% from 2026 to 2032.
Malaysia Fin Fish Market Growth Rate Analysis (2021-2032)
The Malaysian Fin Fish market has experienced notable fluctuations over the past few years. In 2021, the market faced a decline of 2.7%, primarily due to supply chain disruptions caused by the pandemic. However, in 2022, a recovery initiated with a 4.1% growth as consumer demand rebounded. This upward momentum gained speed in 2023, with an impressive 8.5% increase attributed to expanding aquaculture techniques and increased investments in sustainable fishing practices. As we move towards 2024, a projected growth rate of 3.9% reflects ongoing enhancements in infrastructure and digitalization within the sector. The market is expected to maintain a robust annual growth of around 5% through 2032, driven by policy reforms and rising consumer preferences for healthy protein sources.
Malaysia Fin Fish Market Year-wise Growth Rate and Key Drivers
This graph highlights how the Malaysia Fin Fish Market has steadily grown over the past five years, supported by major growth factors.
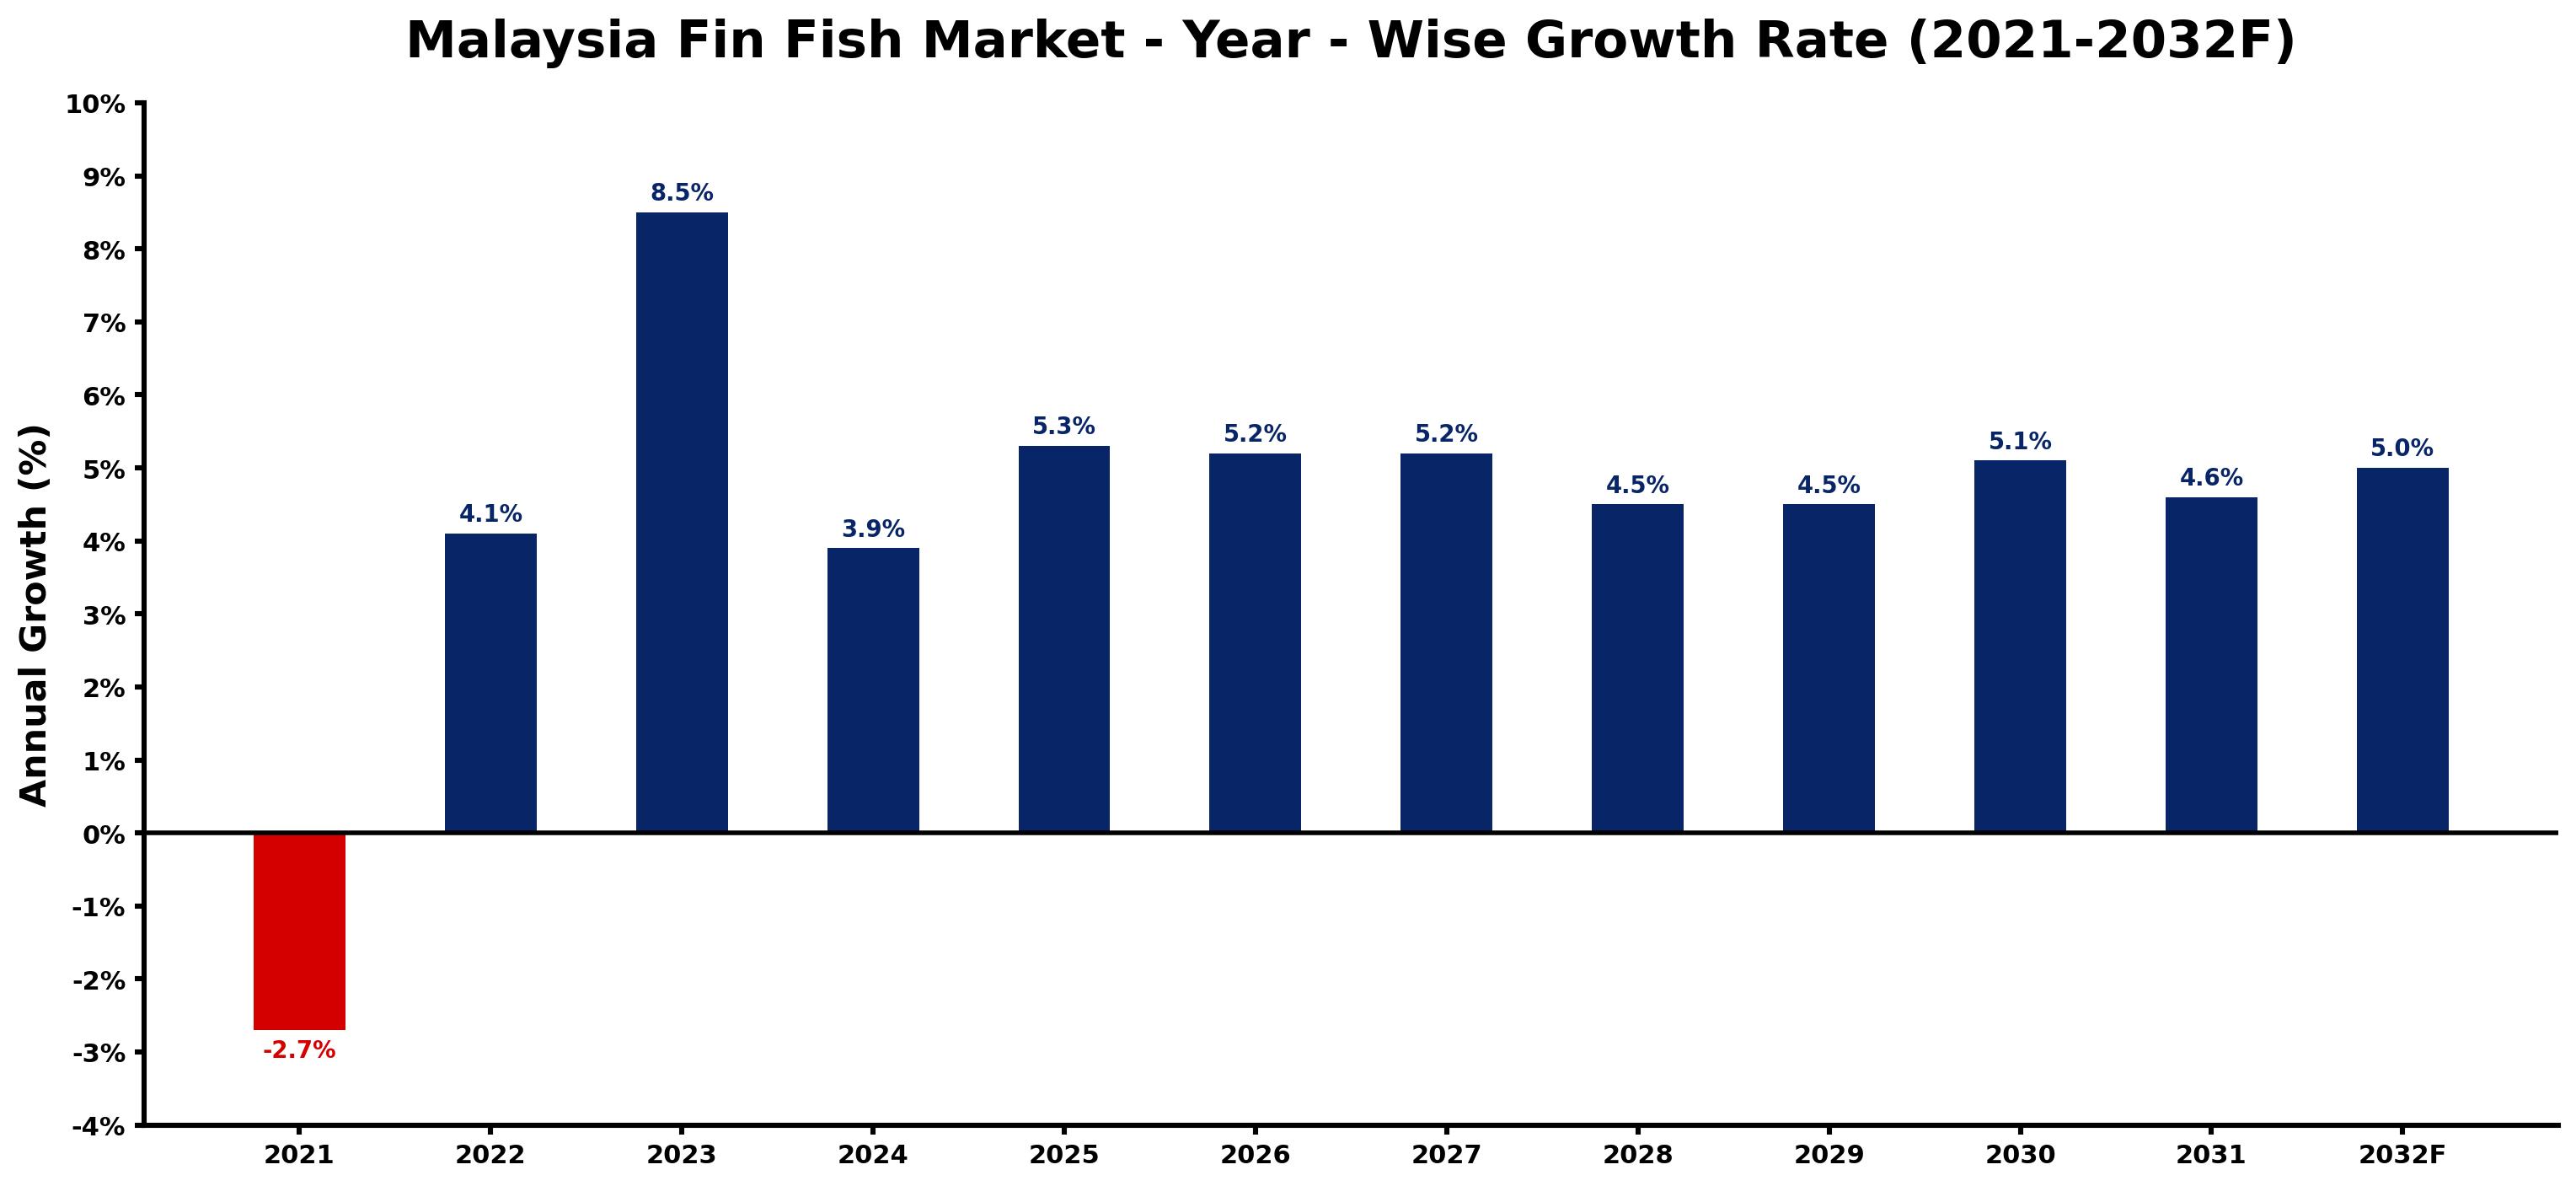
The table below presents the year wise growth rates along with the key drivers influencing the market
| Year | Growth Rate | Major Drivers |
| 2021 | -2.7% | Tightened import restrictions on live seafood diminished supply, leading to increased prices and lower consumer demand. |
| 2022 | 4.1% | Increased health awareness sparked interest in high-protein fish consumption trends. |
| 2023 | 8.5% | Sustainable aquaculture practices began reshaping production methods and market perceptions. |
| 2024 | 3.9% | Expansion of export markets encouraged local fisheries to enhance quality standards. |
| 2025 | 5.3% | Digital platforms gained traction, connecting fishermen directly with consumers efficiently. |
| 2026 | 5.2% | Technological innovations improved fish farming efficiency and minimized environmental impact. |
| 2027 | 5.2% | Urbanization trends fueled higher seafood consumption, especially among younger demographics. |
| 2028 | 4.5% | Culinary tourism started influencing local fish varieties and traditional preparation methods. |
| 2029 | 4.5% | Collaboration between local governments and fisheries improved infrastructure for distribution. |
| 2030 | 5.1% | Consumer preferences shifted towards sustainable sourcing, driving eco-friendly fishing methods. |
| 2031 | 4.6% | Aquaponics and integrated farming systems gained popularity for urban fish production. |
| 2032 | 5.0% | Emergence of innovative seafood processing technologies enhanced product shelf life and appeal. |
Note - Market size estimations and growth projections presented in this report are based on 6Wresearch's advanced forecasting approach, validated with industry datasets as of June 2026.
Malaysia Fin Fish Market Synopsis
The Malaysia Fin Fish Market is projected to reach 5.2% and witness significant growth during the forecast period (2026-2032). This growth trajectory can be attributed to several factors, primarily the increasing consumption of finfish among the rapidly growing population of Malaysia. As the demand for seafood intensifies, the local fish industry is poised to benefit substantially. Additionally, the government's strategic initiatives aimed at enhancing aquaculture practices, including the implementation of cage culture farming systems in coastal waters, have positioned Malaysia as a preferred hub for seafood production and processing.
Malaysia Fin Fish Market Growth Drivers
The primary growth drivers in the Malaysia Fin Fish Market include:
- Rising population: The rapid population growth in Malaysia has led to an increased demand for protein sources, particularly seafood, which is historically favored for its health benefits.
- Government support: The Malaysian government's focus on developing coastal aquaculture through various projects and initiatives promotes sustainable practices, thereby enhancing production capabilities.
- Technological advancements: Innovations in automation and fisheries technology are streamlining operations, improving yield, and ensuring quality, which are essential for meeting domestic and international demand.
- Export opportunities: With increasing global demand for quality seafood, Malaysia's coastal geography provides an advantageous platform for finfish exports.
- Health consciousness: Growing consumer awareness of the health benefits associated with finfish consumption is driving demand for seafood as a preferred dietary choice.
Malaysia Fin Fish Market Trends and Opportunities
The Malaysia Fin Fish Market is observing several key trends that present significant opportunities for growth:
- Sustainability focus: There is an increasing trend towards sustainable fishing practices, which not only helps preserve marine biodiversity but also aligns with global consumer preferences for environmentally friendly products.
- Investment in aquaculture: Enhanced investments in aquaculture technologies and infrastructure are promoting efficient production methods, thereby increasing output to meet both local and export demands.
- E-commerce platforms: The rise of online seafood marketplaces is redefining the distribution channels, making finfish products more accessible to consumers.
- Health-oriented products: With consumers becoming more health-conscious, there is a growing trend for organic and sustainably sourced finfish products, catering to niche markets.
- Research and development: Ongoing R&D efforts in fish breeding and feed efficiency are likely to yield better-performing fish species, enhancing profitability for aquaculture businesses.
Malaysia Fin Fish Market Challenges and Restraints
Despite its growth potential, the Malaysia Fin Fish Market faces several challenges:
- Environmental concerns: Overfishing and pollution are significant threats to sustainable fishing practices, necessitating stringent environmental regulations.
- Economic fluctuations: Economic instability, including inflation and fluctuating import/export tariffs, can adversely impact the market, affecting both production costs and consumer purchasing power.
- Competition: The market faces intense competition from other seafood-producing countries, which can affect pricing and market share.
- Skill shortages: A lack of skilled labor in modern aquaculture practices may hinder production efficiency and growth.
- Technological adaptation: The rapid pace of technological advancement requires constant investment and adaptation, which may be a barrier for smaller operators.
Malaysia Fin Fish Market Government Investment and Initiatives
The Malaysian government has initiated several policies aimed at stimulating growth within the fin fish market. These initiatives include significant investments in coastal aquaculture development projects that focus on sustainable practices. The government is also providing incentives for private sector participation in aquaculture through tax breaks, grants, and subsidies. Public spending on research and technological advancements in fish farming is increasing, which further supports the industry's growth potential. Additionally, collaboration with international organizations to improve best practices in fishery management is contributing to more sustainable operational frameworks.
Malaysia Fin Fish Market Latest Developments (May 2025 - June 2026)
Recent developments in the Malaysia Fin Fish Market indicate a trend towards modernization and sustainability. The period between May 2025 and June 2026 has seen a surge in government initiatives aimed at enhancing fish production techniques. Advances in aquaculture technology have been adopted more widely, allowing for greater efficiency in fish farming operations. Additionally, partnerships between public and private sectors have led to increased funding for research on sustainable aquaculture practices. Furthermore, the continuous rise in seafood consumption has prompted firms to explore new export markets, particularly in Asia and beyond, to meet the growing international demand for quality finfish products.
Malaysia Fin Fish Market - Key Attractiveness of the Report
- 10 Years of Market Numbers
- Historical Data Starting from 2022 to 2025
- Base Year: 2025
- Forecast Data until 2032
- Key Performance Indicators Impacting the Market
- Major Upcoming Developments and Projects
Key Highlights of the Report:
- Malaysia Fin Fish Market Outlook
- Market Size of Malaysia Fin Fish Market, 2025
- Forecast of Malaysia Fin Fish Market, 2032F
- Historical Data and Forecast of Malaysia Fin Fish Revenues & Volume for the Period 2022-2032F
- Malaysia Fin Fish Market Trend Evolution
- Malaysia Fin Fish Market Drivers and Challenges
- Malaysia Fin Fish Price Trends
- Malaysia Fin Fish Porter's Five Forces
- Malaysia Fin Fish Industry Life Cycle
- Historical Data and Forecast of Malaysia Fin Fish Market Revenues & Volume By Environment for the Period 2022-2032F
- Historical Data and Forecast of Malaysia Fin Fish Market Revenues & Volume By Freshwater for the Period 2022-2032F
- Historical Data and Forecast of Malaysia Fin Fish Market Revenues & Volume By Marine Water for the Period 2022-2032F
- Historical Data and Forecast of Malaysia Fin Fish Market Revenues & Volume By Brackish Water for the Period 2022-2032F
- Historical Data and Forecast of Malaysia Fin Fish Market Revenues & Volume By Fish Type for the Period 2022-2032F
- Historical Data and Forecast of Malaysia Fin Fish Market Revenues & Volume By Pompano for the Period 2022-2032F
- Historical Data and Forecast of Malaysia Fin Fish Market Revenues & Volume By Snappers for the Period 2022-2032F
- Historical Data and Forecast of Malaysia Fin Fish Market Revenues & Volume By Groupers for the Period 2022-2032F
- Historical Data and Forecast of Malaysia Fin Fish Market Revenues & Volume By Salmon for the Period 2022-2032F
- Historical Data and Forecast of Malaysia Fin Fish Market Revenues & Volume By Milkfish for the Period 2022-2032F
- Historical Data and Forecast of Malaysia Fin Fish Market Revenues & Volume By Tuna for the Period 2022-2032F
- Historical Data and Forecast of Malaysia Fin Fish Market Revenues & Volume By Catfish for the Period 2022-2032F
- Historical Data and Forecast of Malaysia Fin Fish Market Revenues & Volume By Others for the Period 2022-2032F
- Malaysia Fin Fish Import Export Trade Statistics
- Market Opportunity Assessment By Environment
- Market Opportunity Assessment By Fish Type
- Malaysia Fin Fish Top Companies Market Share
- Malaysia Fin Fish Competitive Benchmarking By Technical and Operational Parameters
- Malaysia Fin Fish Company Profiles
- Malaysia Fin Fish Key Strategic Recommendations
Frequently Asked Questions About the Market Study (FAQs):
The growth is primarily driven by an increasing population, rising seafood consumption, government support for aquaculture, and technological advancements.
Government initiatives include investments in coastal aquaculture development, incentives for private sector participation, and partnerships aimed at improving sustainable fishing practices.
The market faces challenges such as environmental concerns, competition from other seafood-producing countries, and the need for skilled labor in aquaculture practices.
Technological advancements are streamlining production processes, improving yields, and enabling more sustainable practices in aquaculture, thus strengthening the market's growth potential.
6Wresearch actively monitors the Malaysia Fin Fish Market and publishes its comprehensive annual report, highlighting emerging trends, growth drivers, revenue analysis, and forecast outlook. Our insights help businesses to make data-backed strategic decisions with ongoing market dynamics. Our analysts track relevent industries related to the Malaysia Fin Fish Market, allowing our clients with actionable intelligence and reliable forecasts tailored to emerging regional needs.
Yes, we provide customisation as per your requirements. To learn more, feel free to contact us on sales@6wresearch.com
1 Executive Summary |
2 Introduction |
2.1 Key Highlights of the Report |
2.2 Report Description |
2.3 Market Scope & Segmentation |
2.4 Research Methodology |
2.5 Assumptions |
3 Malaysia Fin Fish Market Overview |
3.1 Malaysia Country Macro Economic Indicators |
3.2 Malaysia Fin Fish Market Revenues & Volume, 2022 & 2032F |
3.3 Malaysia Fin Fish Market - Industry Life Cycle |
3.4 Malaysia Fin Fish Market - Porter's Five Forces |
3.5 Malaysia Fin Fish Market Revenues & Volume Share, By Environment, 2022 & 2032F |
3.6 Malaysia Fin Fish Market Revenues & Volume Share, By Fish Type, 2022 & 2032F |
4 Malaysia Fin Fish Market Dynamics |
4.1 Impact Analysis |
4.2 Market Drivers |
4.3 Market Restraints |
5 Malaysia Fin Fish Market Trends |
6 Malaysia Fin Fish Market, By Types |
6.1 Malaysia Fin Fish Market, By Environment |
6.1.1 Overview and Analysis |
6.1.2 Malaysia Fin Fish Market Revenues & Volume, By Environment, 2022-2032F |
6.1.3 Malaysia Fin Fish Market Revenues & Volume, By Freshwater, 2022-2032F |
6.1.4 Malaysia Fin Fish Market Revenues & Volume, By Marine Water, 2022-2032F |
6.1.5 Malaysia Fin Fish Market Revenues & Volume, By Brackish Water, 2022-2032F |
6.2 Malaysia Fin Fish Market, By Fish Type |
6.2.1 Overview and Analysis |
6.2.2 Malaysia Fin Fish Market Revenues & Volume, By Pompano, 2022-2032F |
6.2.3 Malaysia Fin Fish Market Revenues & Volume, By Snappers, 2022-2032F |
6.2.4 Malaysia Fin Fish Market Revenues & Volume, By Groupers, 2022-2032F |
6.2.5 Malaysia Fin Fish Market Revenues & Volume, By Salmon, 2022-2032F |
6.2.6 Malaysia Fin Fish Market Revenues & Volume, By Milkfish, 2022-2032F |
6.2.7 Malaysia Fin Fish Market Revenues & Volume, By Tuna, 2022-2032F |
6.2.8 Malaysia Fin Fish Market Revenues & Volume, By Others, 2022-2032F |
6.2.9 Malaysia Fin Fish Market Revenues & Volume, By Others, 2022-2032F |
7 Malaysia Fin Fish Market Import-Export Trade Statistics |
7.1 Malaysia Fin Fish Market Export to Major Countries |
7.2 Malaysia Fin Fish Market Imports from Major Countries |
8 Malaysia Fin Fish Market Key Performance Indicators |
9 Malaysia Fin Fish Market - Opportunity Assessment |
9.1 Malaysia Fin Fish Market Opportunity Assessment, By Environment, 2022 & 2032F |
9.2 Malaysia Fin Fish Market Opportunity Assessment, By Fish Type, 2022 & 2032F |
10 Malaysia Fin Fish Market - Competitive Landscape |
10.1 Malaysia Fin Fish Market Revenue Share, By Companies, 2025 |
10.2 Malaysia Fin Fish Market Competitive Benchmarking, By Operating and Technical Parameters |
11 Company Profiles |
12 Recommendations |
13 Disclaimer |
Global Go To Market Strategy - 2030
Export potential enables firms to identify high-growth global markets with greater confidence by combining advanced trade intelligence with a structured quantitative methodology. The framework analyzes emerging demand trends and country-level import patterns while integrating macroeconomic and trade datasets such as GDP and population forecasts, bilateral import–export flows, tariff structures, elasticity differentials between developed and developing economies, geographic distance, and import demand projections. Using weighted trade values from 2020–2024 as the base period to project country-to-country export potential for 2030, these inputs are operationalized through calculated drivers such as gravity model parameters, tariff impact factors, and projected GDP per-capita growth. Through an analysis of hidden potentials, demand hotspots, and market conditions that are most favorable to success, this method enables firms to focus on target countries, maximize returns, and global expansion with data, backed by accuracy.
By factoring in the projected importer demand gap that is currently unmet and could be potential opportunity, it identifies the potential for the Exporter (Country) among 190 countries, against the general trade analysis, which identifies the biggest importer or exporter.
To discover high-growth global markets and optimize your business strategy:
Click Here
Pricing
- Single User License$ 1,995
- Department License$ 2,400
- Site License$ 3,120
- Global License$ 3,795

Leadership Perspectives from Industry Events
Search
Thought Leadership and Analyst Meet


Our Clients
6WResearch In News
- India Air Conditioner Market Set for Strong Rebound in 2026 After Weather-Led Correction and GST-Driven Recovery: 6Wresearch
- ADAS in India: How Automatic Emergency Braking, Blind Spot Detection & Driver Monitoring are Transforming Road Safety
- Doha a strategic location for EV manufacturing hub: IPA Qatar
- Demand for luxury TVs surging in the GCC, says Samsung
- Empowering Growth: The Thriving Journey of Bangladesh’s Cable Industry
- Demand for luxury TVs surging in the GCC, says Samsung
Latest Reports
- Nicaragua RPG Gaming Market (2026-2032)
- New Zealand RPG Gaming Market (2026-2032)
- Netherlands RPG Gaming Market (2026-2032)
- Nauru RPG Gaming Market (2026-2032)
- Namibia RPG Gaming Market (2026-2032)
- Mozambique RPG Gaming Market (2026-2032)
- Montenegro RPG Gaming Market (2026-2032)
- Mongolia RPG Gaming Market (2026-2032)
- Monaco RPG Gaming Market (2026-2032)
- Micronesia RPG Gaming Market (2026-2032)
Industry Events and Analyst Meet

HIMTEX 2026

India Refining Summit 2026

India EV Show 2026

EV tech India Expo 2026

Auto Tech Asia 2026
Whitepaper
- Middle East & Africa Commercial Security Market Click here to view more.
- Middle East & Africa Fire Safety Systems & Equipment Market Click here to view more.
- GCC Drone Market Click here to view more.
- Middle East Lighting Fixture Market Click here to view more.
- GCC Physical & Perimeter Security Market Click here to view more.