Malaysia Hollow Glassware Market (2026-2032) | Share, Value, Trends, Companies, Growth, Analysis, Revenue, Outlook, Size, Forecast & Industry
Market Forecast By Type (Medium Borosilicate, High Borosilicate), By Application (Solar Energy Tubes, Laboratory Apparatus, Heat Glassware, Chemical Tubes, Pharmaceutical Packaging, Others) And Competitive Landscape
| Product Code: ETC043026 | Publication Date: Jun 2023 | Updated Date: Jun 2026 | Product Type: Report | |
| Publisher: 6Wresearch | Author: Ravi Bhandari | No. of Pages: 70 | No. of Figures: 35 | No. of Tables: 5 |
Malaysia Hollow Glassware Market Summary
The malaysia hollow glassware market was estimated at USD 480 Million in 2025 and is projected to reach USD 620 Million by 2032, growing at a CAGR of 5.2% from 2026 to 2032.
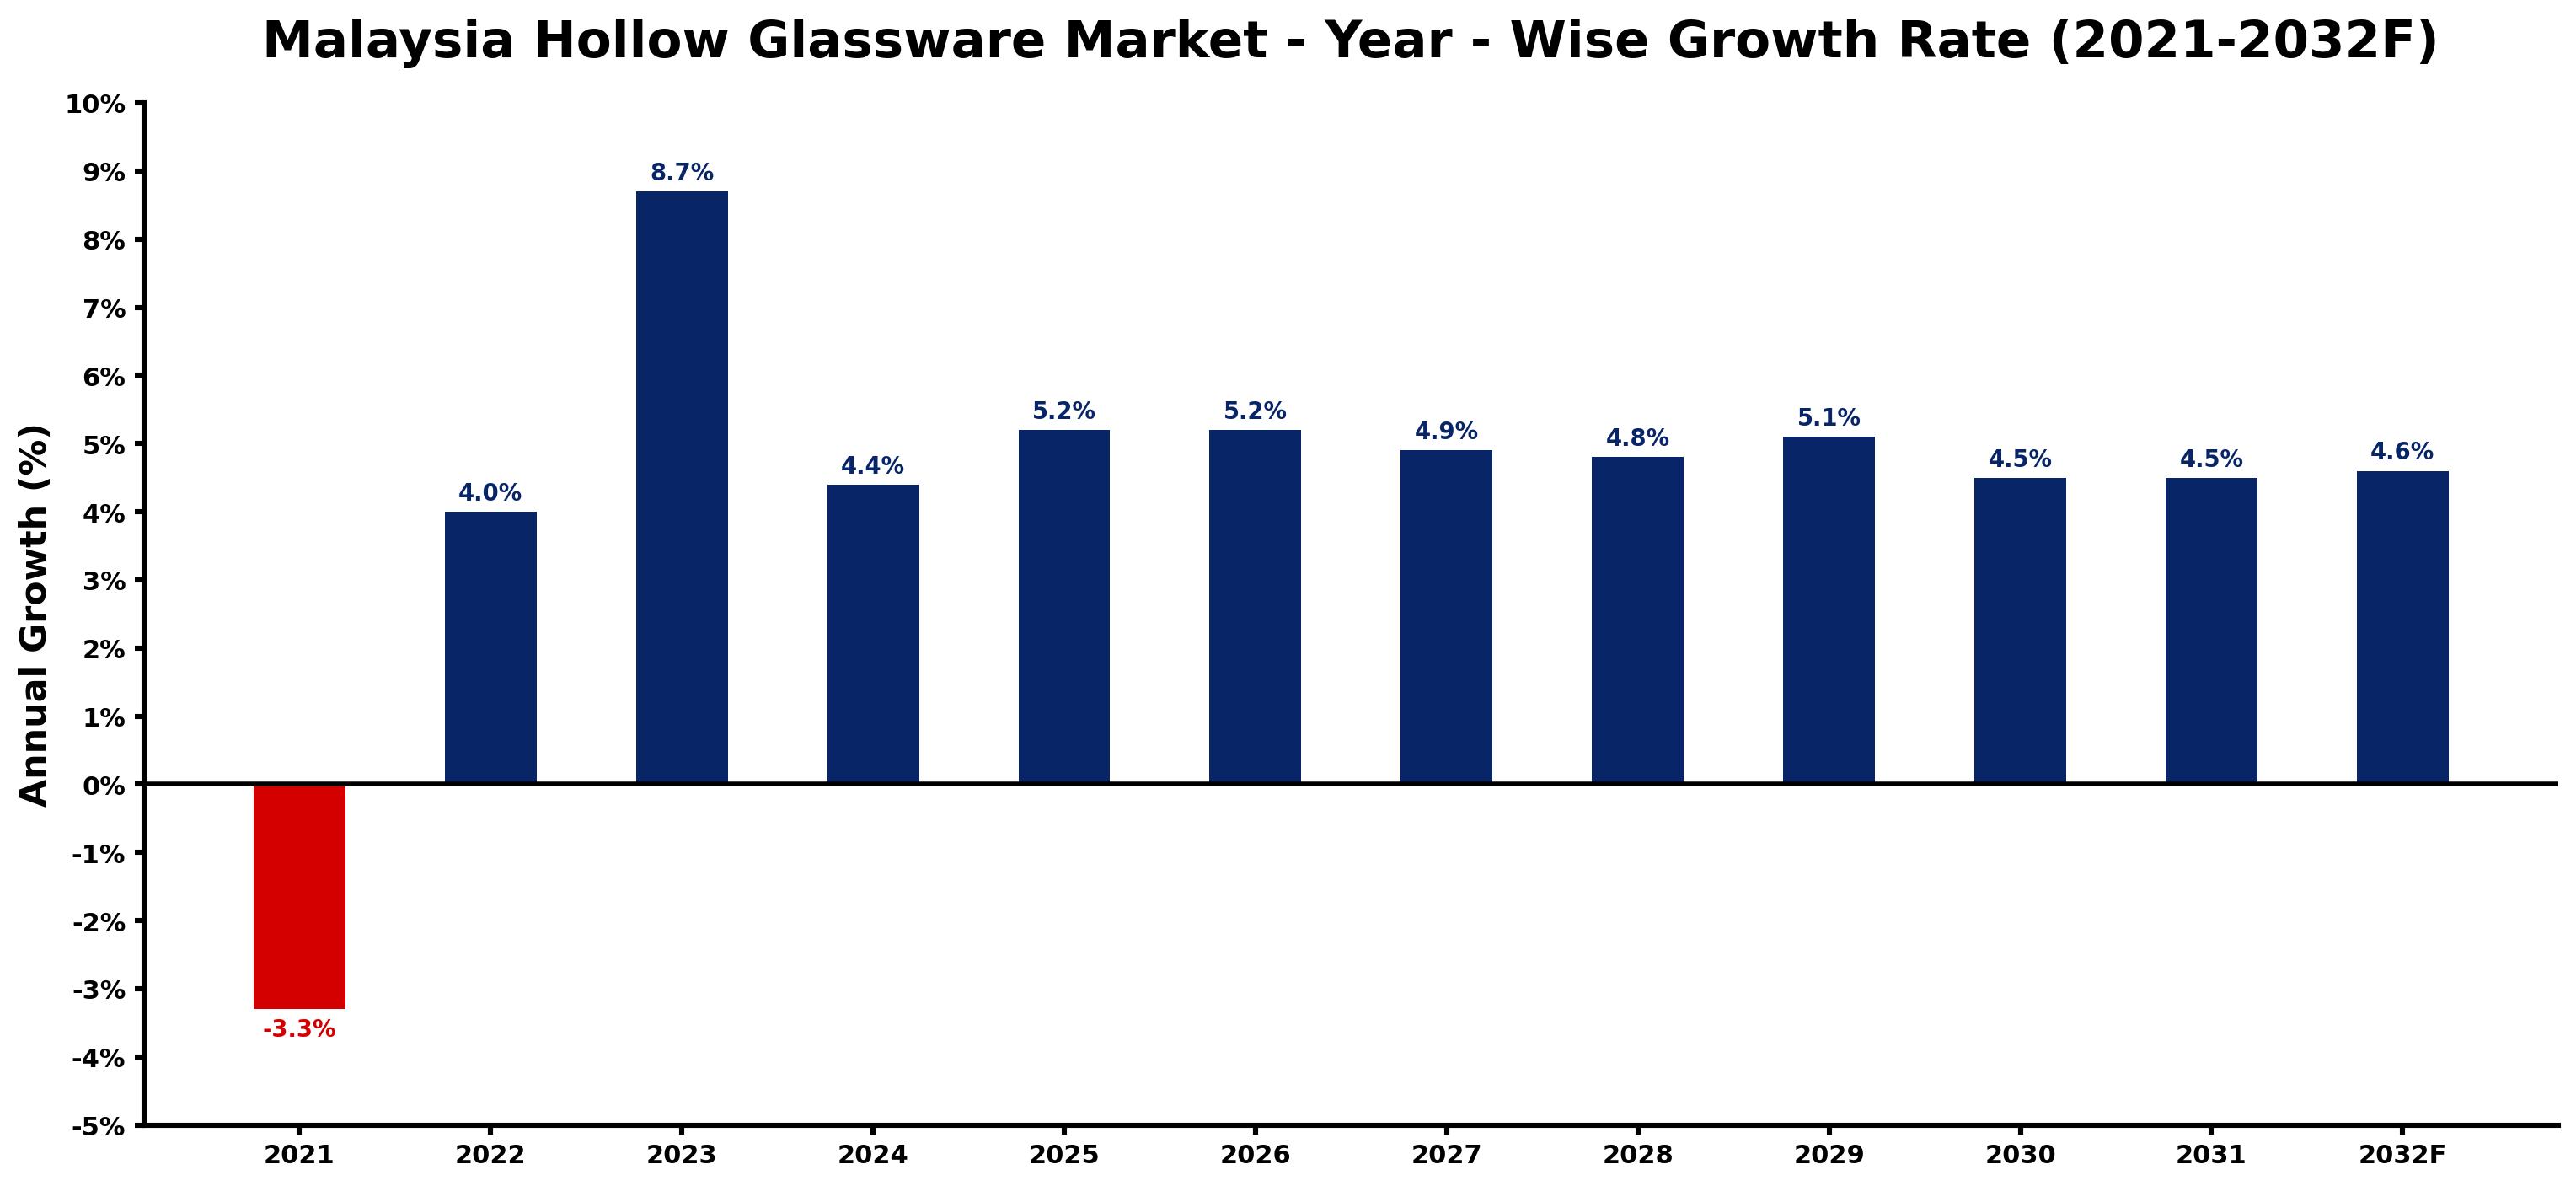
Malaysia Hollow Glassware Market Growth Rate Analysis (2021-2032)
The Malaysia hollow glassware market has shown a notable recovery post-pandemic, rebounding from a contraction of -3.3% in 2021 to an impressive growth rate of 8.7% in 2023. This upward shift can be primarily attributed to heightened consumer demand, increased investments in local manufacturing, and a surge in hospitality and foodservice sectors. Forecasts indicate sustained growth, with rates around 4.4% to 5.2% expected through 2026. The integration of digitalization in production processes and a focus on sustainable materials are also driving market dynamics. By 2032, growth is projected to stabilize near 4.6%, underlining a strong commitment to innovation and eco-friendly practices within the industry.
Malaysia Hollow Glassware Market Year-wise Growth Rate and Key Drivers
This graph highlights how the Malaysia Hollow Glassware Market has steadily grown over the past five years, supported by major growth factors.
The table below presents the year wise growth rates along with the key drivers influencing the market
| Year | Growth Rate | Major Drivers |
| 2021 | -3.3% | The resurgence of the pandemic led to widespread retail closures, sharply decreasing hollow glassware demand. |
| 2022 | 4.0% | An increase in food service establishments amplified the need for durable tableware. |
| 2023 | 8.7% | E-commerce platforms expanded, facilitating wider access to diverse glassware selections. |
| 2024 | 4.4% | Sustainable packaging trends encouraged producers to invest in eco-friendly glassware solutions. |
| 2025 | 5.2% | Local artisanal glassmakers gained popularity, enhancing market diversity and consumer choice. |
| 2026 | 5.2% | Emerging culinary tourism fortified the demand for upscale dining experiences and glassware. |
| 2027 | 4.9% | Architectural trends emphasized open-plan spaces, increasing tabletop glassware visibility. |
| 2028 | 4.8% | Consumer interest in home decor surged, prompting more decorative glassware purchases. |
| 2029 | 5.1% | Health consciousness spurred demand for high-quality glassware as safer kitchenware. |
| 2030 | 4.5% | Brand collaborations between designers and glass producers created exclusive product lines. |
| 2031 | 4.5% | Technological innovations improved glass manufacturing efficiency, reducing production costs significantly. |
| 2032 | 4.6% | Global trade agreements enhanced market access for Malaysian glassware in regional markets. |
Note - Market size estimations and growth projections presented in this report are based on 6Wresearch's advanced forecasting approach, validated with industry datasets as of June 2026.
Malaysia Hollow Glassware Market Synopsis
The Malaysia Hollow Glassware Market is projected to reach 5.2% and witness significant growth during the forecast period (2026-2032). This growth is underpinned by a variety of factors, including an increasing demand for convenient products, an upward trend in disposable incomes, and a shift among manufacturers towards more sustainable packaging solutions. The move away from plastic in favor of eco-friendly glass options reflects the rising environmental concerns among consumers, which directly influences purchasing behavior. Moreover, innovations in product design and functionality are enhancing the appeal of hollow glassware in Malaysian households and businesses.
Malaysia Hollow Glassware Market Growth Drivers
The primary growth drivers of the Malaysia Hollow Glassware Market can be attributed to several interrelated trends:
- Modern lifestyles are increasingly favoring convenience, resulting in heightened demand for ready-to-cook food items. This trend translates into a greater need for robust hollow glassware containers capable of securely packaging these products for retail and distribution.
- As disposable incomes rise in Malaysia, consumers are more inclined to invest in luxury items, including hollow glassware. This rise in purchasing power allows for more varied expenditure on home and lifestyle products, boosting market growth.
- Shifting consumer preferences towards environmentally friendly packaging solutions have prompted manufacturers to innovate in glassware design and functionality, leading to enhanced product offerings that cater to the eco-conscious market segment.
- The growing popularity of local and international cuisine, often packaged in hollow glassware, emphasizes the market's potential as restaurants and food service providers seek visually appealing and functional packaging solutions.
- Increased focus on health and safety post-pandemic has also strengthened the market, as consumers turn to glass as a safer alternative for food storage and consumption, reinforcing its role in modern living.
Malaysia Hollow Glassware Market Trends and Opportunities
Several trends are emerging within the Malaysia Hollow Glassware Market that present exciting opportunities for growth:
- The introduction of lightweight and durable glass products is gaining traction, appealing to consumers looking for practicality without compromising aesthetics.
- Technological advancements in glass production are resulting in more diverse and customized designs, which enhance consumer choice and market competitiveness.
- Growing health consciousness has led consumers to prefer glass over plastic, offering a prime opportunity for brands to promote the safety and cleanliness of hollow glassware.
- Collaborations with local artisans and designers are becoming increasingly popular, allowing for unique product lines that cater to niche markets and attract a broader consumer base.
- International trade opportunities are expanding as manufacturers explore markets beyond Malaysia, offering potential for revenue growth through exports of hollow glassware products.
Malaysia Hollow Glassware Market Government Investment and Initiatives
The Malaysian government has recognized the importance of sustainable packaging solutions and has implemented various initiatives to support the growth of the hollow glassware market. Policies promoting environmentally friendly manufacturing methods are encouraging businesses to invest in glass production. Public spending is being geared towards enhancing recycling capabilities and supporting local manufacturers through grants and incentives. Additionally, development plans focusing on innovation in the packaging sector align with national goals for sustainability and economic growth, creating a favorable environment for investments in the glassware industry.
Malaysia Hollow Glassware Market Latest Developments (May 2025 - June 2026)
Recent developments within the Malaysia Hollow Glassware Market indicate a dynamic shift towards more sustainable production practices. Over the specified timeframe, there has been a marked increase in collaboration between manufacturers and environmental organizations aimed at reducing the carbon footprint associated with glass manufacturing. Furthermore, innovative product launches featuring smart designs that enhance user experience have also gained attention, solidifying consumer interest. Retailers are adjusting their product offerings to match changing consumer preferences, combining traditional glassware aesthetics with modern functionality, which is helping to drive market performance.
Malaysia Hollow Glassware Market - Key Attractiveness of the Report
- 10 Years of Market Numbers
- Historical Data Starting from 2022 to 2025
- Base Year: 2025
- Forecast Data until 2032
- Key Performance Indicators Impacting the Market
- Major Upcoming Developments and Projects
Key Highlights of the Report:
- Malaysia Hollow Glassware Market Outlook
- Market Size of Malaysia Hollow Glassware Market, 2025
- Forecast of Malaysia Hollow Glassware Market, 2032
- Historical Data and Forecast of Malaysia Hollow Glassware Revenues & Volume for the Period 2022-2032F
- Malaysia Hollow Glassware Market Trend Evolution
- Malaysia Hollow Glassware Market Drivers and Challenges
- Malaysia Hollow Glassware Price Trends
- Malaysia Hollow Glassware Porter's Five Forces
- Malaysia Hollow Glassware Industry Life Cycle
- Historical Data and Forecast of Malaysia Hollow Glassware Market Revenues & Volume By Type for the Period 2022-2032F
- Historical Data and Forecast of Malaysia Hollow Glassware Market Revenues & Volume By Medium Borosilicate for the Period 2022-2032F
- Historical Data and Forecast of Malaysia Hollow Glassware Market Revenues & Volume By High Borosilicate for the Period 2022-2032F
- Historical Data and Forecast of Malaysia Hollow Glassware Market Revenues & Volume By Application for the Period 2022-2032F
- Historical Data and Forecast of Malaysia Hollow Glassware Market Revenues & Volume By Solar Energy Tubes for the Period 2022-2032F
- Historical Data and Forecast of Malaysia Hollow Glassware Market Revenues & Volume By Laboratory Apparatus for the Period 2022-2032F
- Historical Data and Forecast of Malaysia Hollow Glassware Market Revenues & Volume By Heat Glassware for the Period 2022-2032F
- Historical Data and Forecast of Malaysia Hollow Glassware Market Revenues & Volume By Chemical Tubes for the Period 2022-2032F
- Historical Data and Forecast of Malaysia Hollow Glassware Market Revenues & Volume By Pharmaceutical Packaging for the Period 2022-2032F
- Historical Data and Forecast of Malaysia Hollow Glassware Market Revenues & Volume By Others for the Period 2022-2032F
- Malaysia Hollow Glassware Import Export Trade Statistics
- Market Opportunity Assessment By Type
- Market Opportunity Assessment By Application
- Malaysia Hollow Glassware Top Companies Market Share
- Malaysia Hollow Glassware Competitive Benchmarking By Technical and Operational Parameters
- Malaysia Hollow Glassware Company Profiles
- Malaysia Hollow Glassware Key Strategic Recommendations
Frequently Asked Questions About the Market Study (FAQs):
The market's growth is largely fueled by rising disposable incomes, increasing demand for eco-friendly packaging, and changing consumer lifestyle preferences that favor convenience products.
The government is encouraging sustainable practices through various initiatives, providing incentives for manufacturers to adopt eco-friendly production methods and enhancing recycling capabilities.
Key trends include a shift towards lightweight and durable glass products, increased health consciousness leading to safer packaging options, and innovative collaborations with local designers.
The market is expected to see continued innovation in product design and functionality, alongside increased exports and collaborations aimed at expanding market reach.
6Wresearch actively monitors the Malaysia Hollow Glassware Market and publishes its comprehensive annual report, highlighting emerging trends, growth drivers, revenue analysis, and forecast outlook. Our insights help businesses to make data-backed strategic decisions with ongoing market dynamics. Our analysts track relevent industries related to the Malaysia Hollow Glassware Market, allowing our clients with actionable intelligence and reliable forecasts tailored to emerging regional needs.
Yes, we provide customisation as per your requirements. To learn more, feel free to contact us on sales@6wresearch.com
1 Executive Summary |
2 Introduction |
2.1 Key Highlights of the Report |
2.2 Report Description |
2.3 Market Scope & Segmentation |
2.4 Research Methodology |
2.5 Assumptions |
3 Malaysia Hollow Glassware Market Overview |
3.1 Malaysia Country Macro Economic Indicators |
3.2 Malaysia Hollow Glassware Market Revenues & Volume, 2022 & 2032F |
3.3 Malaysia Hollow Glassware Market - Industry Life Cycle |
3.4 Malaysia Hollow Glassware Market - Porter's Five Forces |
3.5 Malaysia Hollow Glassware Market Revenues & Volume Share, By Type, 2022 & 2032F |
3.6 Malaysia Hollow Glassware Market Revenues & Volume Share, By Application, 2022 & 2032F |
4 Malaysia Hollow Glassware Market Dynamics |
4.1 Impact Analysis |
4.2 Market Drivers |
4.3 Market Restraints |
5 Malaysia Hollow Glassware Market Trends |
6 Malaysia Hollow Glassware Market, By Types |
6.1 Malaysia Hollow Glassware Market, By Type |
6.1.1 Overview and Analysis |
6.1.2 Malaysia Hollow Glassware Market Revenues & Volume, By Type, 2022-2032F |
6.1.3 Malaysia Hollow Glassware Market Revenues & Volume, By Medium Borosilicate, 2022-2032F |
6.1.4 Malaysia Hollow Glassware Market Revenues & Volume, By High Borosilicate, 2022-2032F |
6.2 Malaysia Hollow Glassware Market, By Application |
6.2.1 Overview and Analysis |
6.2.2 Malaysia Hollow Glassware Market Revenues & Volume, By Solar Energy Tubes, 2022-2032F |
6.2.3 Malaysia Hollow Glassware Market Revenues & Volume, By Laboratory Apparatus, 2022-2032F |
6.2.4 Malaysia Hollow Glassware Market Revenues & Volume, By Heat Glassware, 2022-2032F |
6.2.5 Malaysia Hollow Glassware Market Revenues & Volume, By Chemical Tubes, 2022-2032F |
6.2.6 Malaysia Hollow Glassware Market Revenues & Volume, By Pharmaceutical Packaging, 2022-2032F |
6.2.7 Malaysia Hollow Glassware Market Revenues & Volume, By Others, 2022-2032F |
7 Malaysia Hollow Glassware Market Import-Export Trade Statistics |
7.1 Malaysia Hollow Glassware Market Export to Major Countries |
7.2 Malaysia Hollow Glassware Market Imports from Major Countries |
8 Malaysia Hollow Glassware Market Key Performance Indicators |
9 Malaysia Hollow Glassware Market - Opportunity Assessment |
9.1 Malaysia Hollow Glassware Market Opportunity Assessment, By Type, 2022 & 2032F |
9.2 Malaysia Hollow Glassware Market Opportunity Assessment, By Application, 2022 & 2032F |
10 Malaysia Hollow Glassware Market - Competitive Landscape |
10.1 Malaysia Hollow Glassware Market Revenue Share, By Companies, 2025 |
10.2 Malaysia Hollow Glassware Market Competitive Benchmarking, By Operating and Technical Parameters |
11 Company Profiles |
12 Recommendations |
13 Disclaimer |
Global Go To Market Strategy - 2030
Export potential enables firms to identify high-growth global markets with greater confidence by combining advanced trade intelligence with a structured quantitative methodology. The framework analyzes emerging demand trends and country-level import patterns while integrating macroeconomic and trade datasets such as GDP and population forecasts, bilateral import–export flows, tariff structures, elasticity differentials between developed and developing economies, geographic distance, and import demand projections. Using weighted trade values from 2020–2024 as the base period to project country-to-country export potential for 2030, these inputs are operationalized through calculated drivers such as gravity model parameters, tariff impact factors, and projected GDP per-capita growth. Through an analysis of hidden potentials, demand hotspots, and market conditions that are most favorable to success, this method enables firms to focus on target countries, maximize returns, and global expansion with data, backed by accuracy.
By factoring in the projected importer demand gap that is currently unmet and could be potential opportunity, it identifies the potential for the Exporter (Country) among 190 countries, against the general trade analysis, which identifies the biggest importer or exporter.
To discover high-growth global markets and optimize your business strategy:
Click Here
Pricing
- Single User License$ 1,995
- Department License$ 2,400
- Site License$ 3,120
- Global License$ 3,795

Leadership Perspectives from Industry Events
Search
Thought Leadership and Analyst Meet


Our Clients
6WResearch In News
- India Air Conditioner Market Set for Strong Rebound in 2026 After Weather-Led Correction and GST-Driven Recovery: 6Wresearch
- ADAS in India: How Automatic Emergency Braking, Blind Spot Detection & Driver Monitoring are Transforming Road Safety
- Doha a strategic location for EV manufacturing hub: IPA Qatar
- Demand for luxury TVs surging in the GCC, says Samsung
- Empowering Growth: The Thriving Journey of Bangladesh’s Cable Industry
- Demand for luxury TVs surging in the GCC, says Samsung
Latest Reports
- Nicaragua RPG Gaming Market (2026-2032)
- New Zealand RPG Gaming Market (2026-2032)
- Netherlands RPG Gaming Market (2026-2032)
- Nauru RPG Gaming Market (2026-2032)
- Namibia RPG Gaming Market (2026-2032)
- Mozambique RPG Gaming Market (2026-2032)
- Montenegro RPG Gaming Market (2026-2032)
- Mongolia RPG Gaming Market (2026-2032)
- Monaco RPG Gaming Market (2026-2032)
- Micronesia RPG Gaming Market (2026-2032)
Industry Events and Analyst Meet

HIMTEX 2026

India Refining Summit 2026

India EV Show 2026

EV tech India Expo 2026

Auto Tech Asia 2026
Whitepaper
- Middle East & Africa Commercial Security Market Click here to view more.
- Middle East & Africa Fire Safety Systems & Equipment Market Click here to view more.
- GCC Drone Market Click here to view more.
- Middle East Lighting Fixture Market Click here to view more.
- GCC Physical & Perimeter Security Market Click here to view more.