Malaysia Potassium permanganate Market (2026-2032) Outlook | Analysis, Size, Forecast, Growth, Value, Share, Trends, Companies, Revenue & Industry
Market Forecast By Grade (Free Flowing Grade, Technical Grade, Pharmaceutical Grade), By Application (Water Treatment, Waste Water Treatment, Chemicals Manufacturing, Aquaculture, Metal Processing, Air and Gas Purification, Others) And Competitive Landscape
| Product Code: ETC091185 | Publication Date: Jun 2021 | Updated Date: Jun 2026 | Product Type: Report | |
| Publisher: 6Wresearch | Author: Ravi Bhandari | No. of Pages: 70 | No. of Figures: 35 | No. of Tables: 5 |
Malaysia Potassium permanganate Market Size, Share & Growth Rate
The Malaysia Potassium permanganate Market was estimated at USD 210 Million in 2025 and is projected to reach USD 274 Million by 2032, growing at a CAGR of 3.9% from 2026 to 2032. This growth trajectory is primarily driven by the compound's extensive use in water treatment processes and its role in agricultural applications, especially in the disinfection of produce. Additionally, rising consumer preferences for effective and cost-efficient cleaning solutions are expected to further bolster market demand over the next few years.
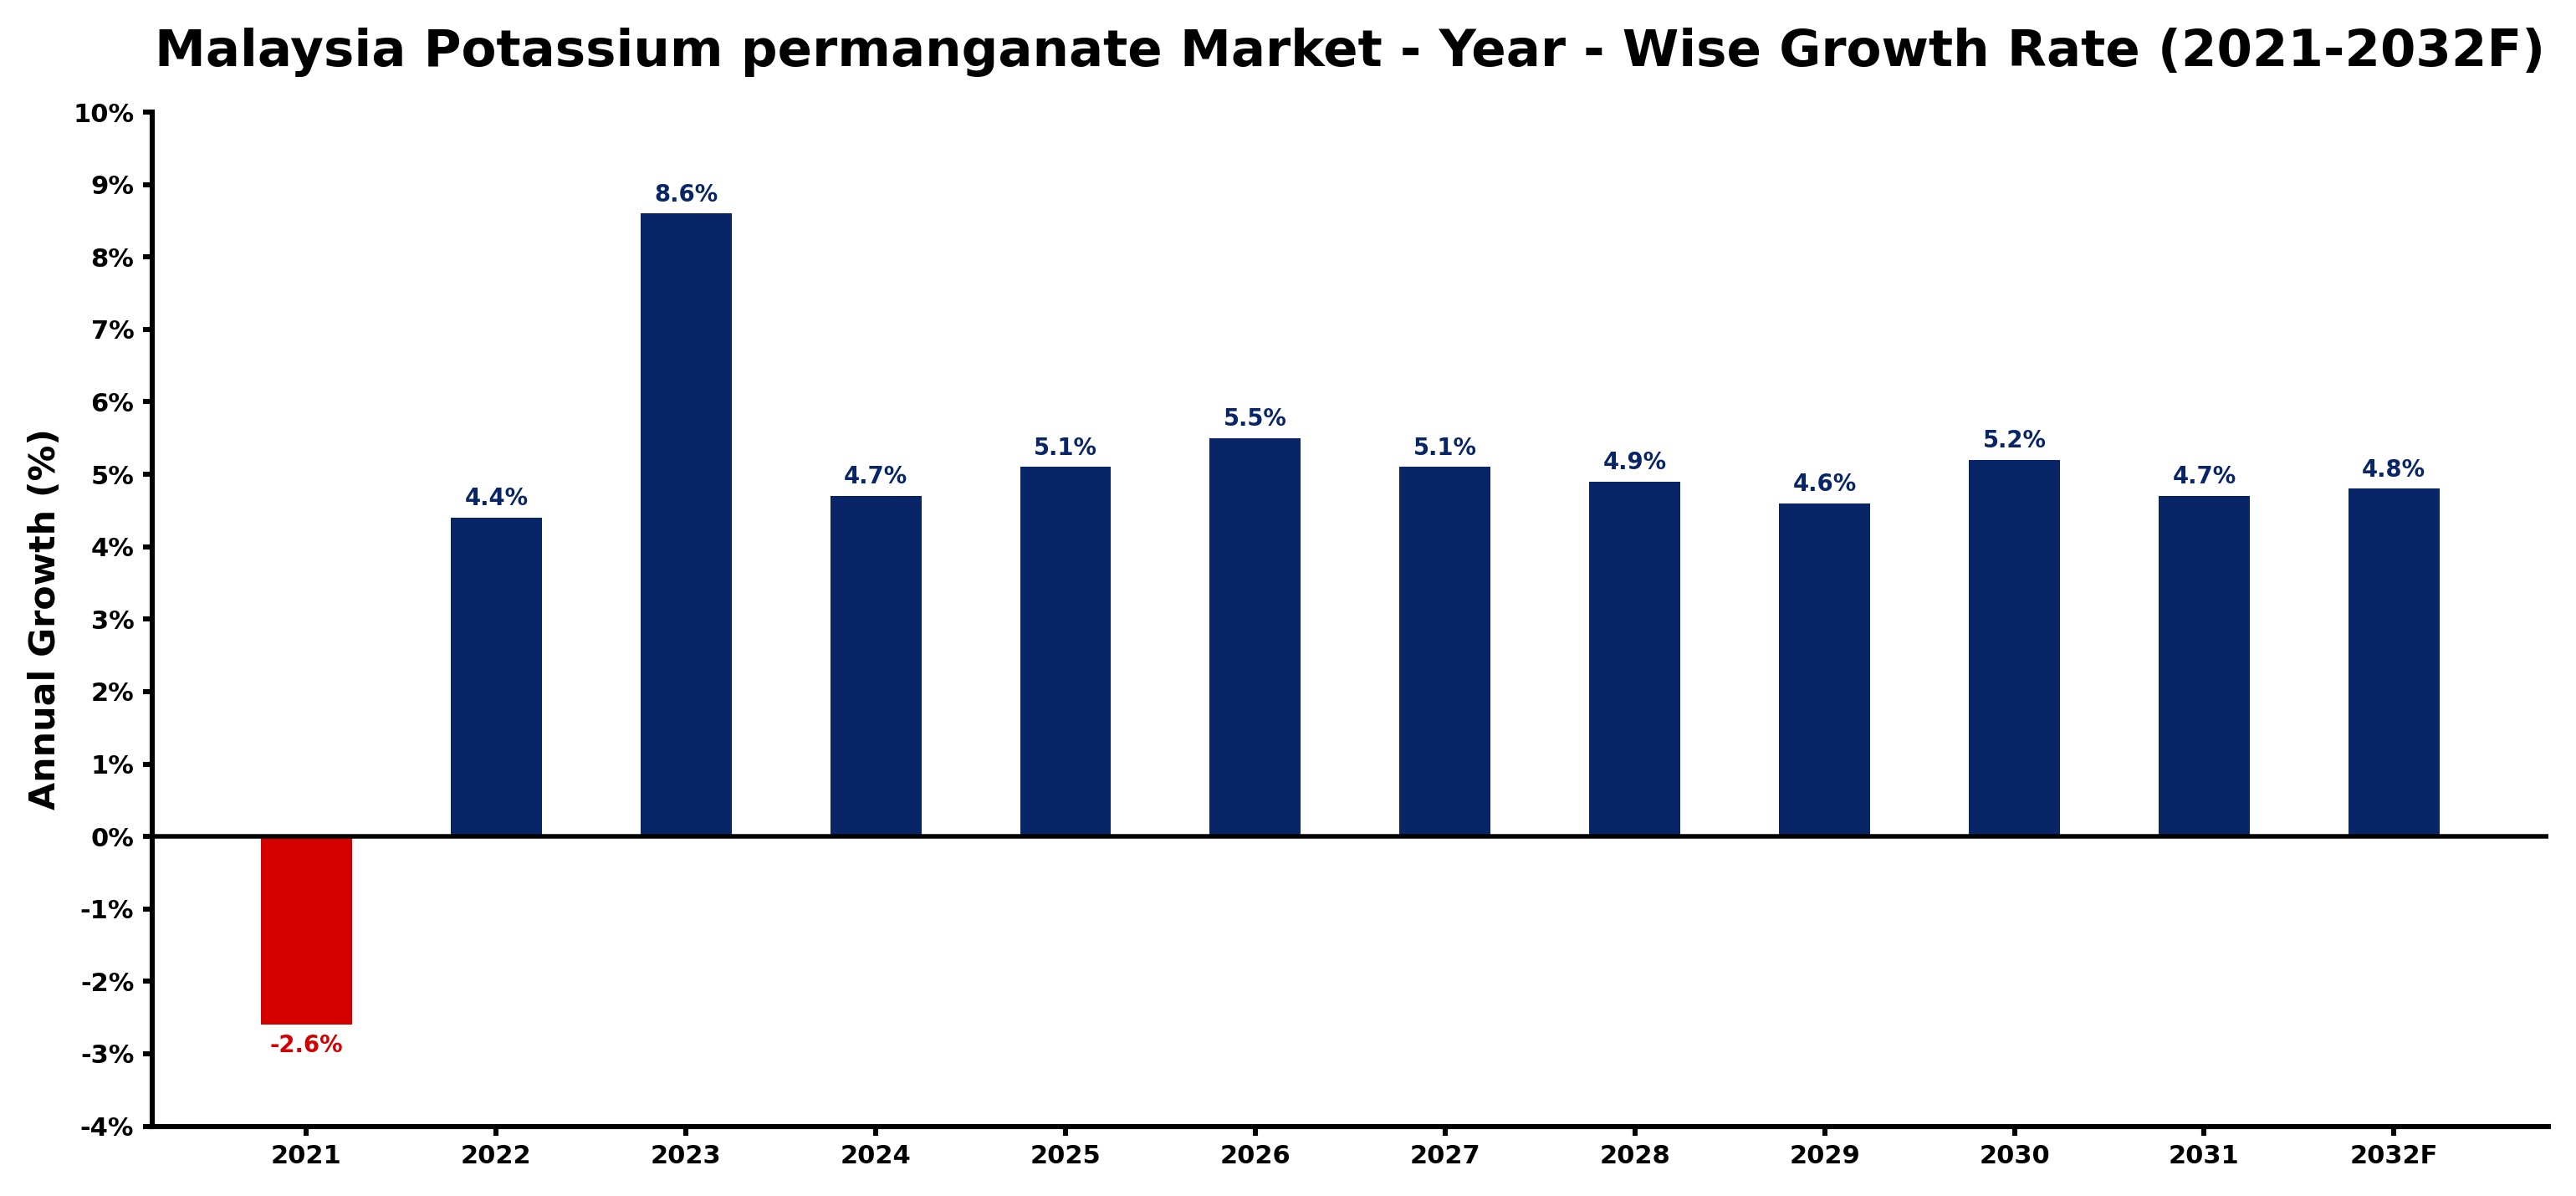
Malaysia Potassium permanganate Market Growth Rate Analysis (2021-2032)
The potassium permanganate market in Malaysia has shown a notable rebound following a decline of 2.6% in 2021, primarily due to shifts in consumer demand and supply chain disruptions caused by the pandemic. In 2022, the market grew by 4.4%, benefiting from increased investments in water treatment and industrial applications. The growth accelerated to 8.6% in 2023, driven by heightened environmental awareness and regulations promoting its use in waste treatment processes. As we look ahead, growth remains robust, projected at 4.7% in 2024 and slightly increasing to 5.5% by 2026, supported by ongoing digitalization in manufacturing and infrastructure development, aligning with Malaysia's energy transition goals.
Malaysia Potassium permanganate Market Year-wise Growth Rate and Key Drivers
This graph highlights how the Malaysia Potassium permanganate Market has steadily grown over the past five years, supported by major growth factors.
The table below presents the year‑wise growth rates along with the key drivers influencing the market
| Year | Growth Rate | Major Drivers |
| 2021 | -2.6% | Weak precision engineering demand hampered potassium permanganate market growth |
| 2022 | 4.4% | Export driven automotive demand fuels potassium permanganate production investment |
| 2023 | 8.6% | Industrial automation advancements streamline potassium permanganate production processes |
| 2024 | 4.7% | Technology integration in automotive supply chains boosts chemical usage |
| 2025 | 5.1% | OEM demand recovery drives potassium permanganate supply chain resilience |
| 2026 | 5.5% | Precision engineering investments bolstered potassium permanganate production capacity utilization |
| 2027 | 5.1% | Precision engineering investments boost potassium permanganate production capacity |
| 2028 | 4.9% | Export growth in automotive components spurred potassium permanganate demand |
| 2029 | 4.6% | Accelerated automotive supply chain upgrades boosted potassium permanganate demand |
| 2030 | 5.2% | Manufacturing investments boost precision engineering for export competitiveness |
| 2031 | 4.7% | Investment in precision engineering boosts potassium permanganate production efficiency |
| 2032 | 4.8% | Improved automotive assembly lines boosted potassium permanganate usage |
Note - Market size estimations and growth projections presented in this report are based on 6Wresearch’s advanced forecasting approach, validated with industry datasets as of June 2026.
Malaysia Potassium permanganate Market Synopsis
The Malaysian potassium permanganate market is witnessing a surge in demand due to its critical applications in water treatment and sanitation. As municipalities and industries prioritize water purification, the importance of potassium permanganate in eliminating pathogens and organic materials has become increasingly evident.
Moreover, the agricultural sector is recognizing the benefits of this compound in post-harvest treatments for fruits and vegetables, enhancing product longevity and safety. This growing awareness among farmers about the advantages of potassium permanganate is expected to create substantial market opportunities in the years to come.
Malaysia Potassium permanganate Market Key Takeaways
- Projected market growth driven by increased demand in water treatment and agriculture.
- Consumer preferences are shifting towards economical cleaning agents, boosting sales.
- Government regulations supporting environmental protection may enhance market opportunities.
- Challenges related to the sourcing of raw materials could impact production costs.
- Market fluctuations driven by industrial demand may affect stability over time.
Evaluation of Restraints in Malaysia Potassium permanganate Market
Despite the promising growth prospects, the Malaysian potassium permanganate market faces several restraints. One of the most significant challenges is the limited availability and cost fluctuations of potassium minerals essential for production. Additionally, stringent regulatory requirements surrounding the safe handling and transportation of potassium permanganate may impose operational hurdles. These factors necessitate strategic planning from industry stakeholders to navigate the complex landscape effectively.
Malaysia Potassium permanganate Market Trends
Current trends indicate an increased focus on sustainable practices, prompting industries to invest in environmentally friendly water treatment solutions. Furthermore, advancements in agricultural techniques are leading to innovative applications of potassium permanganate, particularly in pest and disease management. The rise of e-commerce platforms is also enabling easier access to these products for both commercial and residential consumers, further shaping market dynamics.
Malaysia Potassium permanganate Market Opportunities
Opportunities for growth in the Malaysian potassium permanganate market are abundant. The government’s initiatives toward improving water quality standards present avenues for increased product adoption. Additionally, emerging sectors such as aquaculture and biosecurity in agriculture are likely to drive new demand for potassium permanganate applications. Companies focusing on product innovation and sustainability may find a competitive edge in capturing market share.
Government Initiatives in the Malaysia Potassium permanganate Market
The Malaysian government has been implementing various initiatives aimed at enhancing water quality and promoting public health, which indirectly benefits the potassium permanganate market. Programs focused on improving water treatment facilities and stringent regulations around sanitation and hygiene are expected to boost the demand for potassium permanganate. These initiatives underscore the commitment to environmental protection and the well-being of citizens, creating a favorable landscape for market growth.
Future Insights of the Malaysia Potassium permanganate Market
Looking ahead to the period from 2026 to 2032, the Malaysian potassium permanganate market is poised for substantial developments driven by advancements in technology and increasing regulatory support for cleaner water solutions. As awareness of sustainable practices grows, the demand for this compound across diverse sectors is expected to rise. The anticipated growth in agricultural applications will likely contribute significantly to market expansion, suggesting a robust future ahead.
Malaysia Potassium permanganate Market Latest Developments (May 2025 - June 2026)
Recent industry developments indicate a shift towards more sustainable production practices in the potassium permanganate sector. Companies are exploring greener manufacturing methods to reduce their environmental footprint while enhancing the efficacy of their products. Additionally, collaborations between stakeholders in the agricultural and chemical sectors are emerging, aimed at innovating application techniques and expanding the market reach.
Malaysia Potassium permanganate Market - Key Attractiveness of the Report
- 10 Years of Market Numbers
- Historical Data Starting from 2022 to 2025
- Base Year: 2025
- Forecast Data until 2032
- Key Performance Indicators Impacting the Market
- Major Upcoming Developments and Projects
Key Highlights of the Report:
- Malaysia Potassium permanganate Market Outlook
- Market Size of Malaysia Potassium permanganate Market, 2025
- Forecast of Malaysia Potassium permanganate Market, 2032
- Historical Data and Forecast of Malaysia Potassium permanganate Revenues & Volume for the Period 2022-2032F
- Malaysia Potassium permanganate Market Trend Evolution
- Malaysia Potassium permanganate Market Drivers and Challenges
- Malaysia Potassium permanganate Price Trends
- Malaysia Potassium permanganate Porter's Five Forces
- Malaysia Potassium permanganate Industry Life Cycle
- Historical Data and Forecast of Malaysia Potassium permanganate Market Revenues & Volume By Grade for the Period 2022-2032F
- Historical Data and Forecast of Malaysia Potassium permanganate Market Revenues & Volume By Free Flowing Grade for the Period 2022-2032F
- Historical Data and Forecast of Malaysia Potassium permanganate Market Revenues & Volume By Technical Grade for the Period 2022-2032F
- Historical Data and Forecast of Malaysia Potassium permanganate Market Revenues & Volume By Pharmaceutical Grade for the Period 2022-2032F
- Historical Data and Forecast of Malaysia Potassium permanganate Market Revenues & Volume By Application for the Period 2022-2032F
- Historical Data and Forecast of Malaysia Potassium permanganate Market Revenues & Volume By Water Treatment for the Period 2022-2032F
- Historical Data and Forecast of Malaysia Potassium permanganate Market Revenues & Volume By Waste Water Treatment for the Period 2022-2032F
- Historical Data and Forecast of Malaysia Potassium permanganate Market Revenues & Volume By Chemicals Manufacturing for the Period 2022-2032F
- Historical Data and Forecast of Malaysia Potassium permanganate Market Revenues & Volume By Aquaculture for the Period 2022-2032F
- Historical Data and Forecast of Malaysia Potassium permanganate Market Revenues & Volume By Metal Processing for the Period 2022-2032F
- Historical Data and Forecast of Malaysia Potassium permanganate Market Revenues & Volume By Air and Gas Purification for the Period 2022-2032F
- Historical Data and Forecast of Malaysia Potassium permanganate Market Revenues & Volume By Others for the Period 2022-2032F
- Malaysia Potassium permanganate Import Export Trade Statistics
- Market Opportunity Assessment By Grade
- Market Opportunity Assessment By Application
- Malaysia Potassium permanganate Top Companies Market Share
- Malaysia Potassium permanganate Competitive Benchmarking By Technical and Operational Parameters
- Malaysia Potassium permanganate Company Profiles
- Malaysia Potassium permanganate Key Strategic Recommendations
Malaysia Potassium permanganate Market - Frequently Asked Questions
The growth is primarily driven by its extensive application in water treatment processes and increasing demand within the agricultural sector for crop safety and hygiene.
The market is projected to reach USD 274 Million by 2032, growing at a CAGR of 3.9% from 2026 to 2032, indicating strong growth prospects influenced by regulatory support and rising consumer demand.
Government regulations aimed at improving water quality and environmental standards are crucial in driving the demand for potassium permanganate in various applications, particularly in municipal and industrial settings.
Yes, challenges include fluctuations in the availability of raw materials and the stringent safety regulations that producers must adhere to, which can impact overall market dynamics.
An increasing preference for economical and effective cleaning solutions among consumers is expected to drive sales, particularly for residential applications.
6Wresearch actively monitors the Malaysia Potassium permanganate Market and publishes its comprehensive annual report, highlighting emerging trends, growth drivers, revenue analysis, and forecast outlook. Our insights help businesses to make data-backed strategic decisions with ongoing market dynamics. Our analysts track relevent industries related to the Malaysia Potassium permanganate Market, allowing our clients with actionable intelligence and reliable forecasts tailored to emerging regional needs.
Yes, we provide customisation as per your requirements. To learn more, feel free to contact us on sales@6wresearch.com
1 Executive Summary |
2 Introduction |
2.1 Key Highlights of the Report |
2.2 Report Description |
2.3 Market Scope & Segmentation |
2.4 Research Methodology |
2.5 Assumptions |
3 Malaysia Potassium permanganate Market Overview |
3.1 Malaysia Country Macro Economic Indicators |
3.2 Malaysia Potassium permanganate Market Revenues & Volume, 2022 & 2032F |
3.3 Malaysia Potassium permanganate Market - Industry Life Cycle |
3.4 Malaysia Potassium permanganate Market - Porter's Five Forces |
3.5 Malaysia Potassium permanganate Market Revenues & Volume Share, By Grade, 2022 & 2032F |
3.6 Malaysia Potassium permanganate Market Revenues & Volume Share, By Application, 2022 & 2032F |
4 Malaysia Potassium permanganate Market Dynamics |
4.1 Impact Analysis |
4.2 Market Drivers |
4.3 Market Restraints |
5 Malaysia Potassium permanganate Market Trends |
6 Malaysia Potassium permanganate Market, By Types |
6.1 Malaysia Potassium permanganate Market, By Grade |
6.1.1 Overview and Analysis |
6.1.2 Malaysia Potassium permanganate Market Revenues & Volume, By Grade, 2022-2032F |
6.1.3 Malaysia Potassium permanganate Market Revenues & Volume, By Free Flowing Grade, 2022-2032F |
6.1.4 Malaysia Potassium permanganate Market Revenues & Volume, By Technical Grade, 2022-2032F |
6.1.5 Malaysia Potassium permanganate Market Revenues & Volume, By Pharmaceutical Grade, 2022-2032F |
6.2 Malaysia Potassium permanganate Market, By Application |
6.2.1 Overview and Analysis |
6.2.2 Malaysia Potassium permanganate Market Revenues & Volume, By Water Treatment, 2022-2032F |
6.2.3 Malaysia Potassium permanganate Market Revenues & Volume, By Waste Water Treatment, 2022-2032F |
6.2.4 Malaysia Potassium permanganate Market Revenues & Volume, By Chemicals Manufacturing, 2022-2032F |
6.2.5 Malaysia Potassium permanganate Market Revenues & Volume, By Aquaculture, 2022-2032F |
6.2.6 Malaysia Potassium permanganate Market Revenues & Volume, By Metal Processing, 2022-2032F |
6.2.7 Malaysia Potassium permanganate Market Revenues & Volume, By Air and Gas Purification, 2022-2032F |
7 Malaysia Potassium permanganate Market Import-Export Trade Statistics |
7.1 Malaysia Potassium permanganate Market Export to Major Countries |
7.2 Malaysia Potassium permanganate Market Imports from Major Countries |
8 Malaysia Potassium permanganate Market Key Performance Indicators |
9 Malaysia Potassium permanganate Market - Opportunity Assessment |
9.1 Malaysia Potassium permanganate Market Opportunity Assessment, By Grade, 2022 & 2032F |
9.2 Malaysia Potassium permanganate Market Opportunity Assessment, By Application, 2022 & 2032F |
10 Malaysia Potassium permanganate Market - Competitive Landscape |
10.1 Malaysia Potassium permanganate Market Revenue Share, By Companies, 2025 |
10.2 Malaysia Potassium permanganate Market Competitive Benchmarking, By Operating and Technical Parameters |
11 Company Profiles |
12 Recommendations |
13 Disclaimer |
Global Go To Market Strategy - 2030
Export potential enables firms to identify high-growth global markets with greater confidence by combining advanced trade intelligence with a structured quantitative methodology. The framework analyzes emerging demand trends and country-level import patterns while integrating macroeconomic and trade datasets such as GDP and population forecasts, bilateral import–export flows, tariff structures, elasticity differentials between developed and developing economies, geographic distance, and import demand projections. Using weighted trade values from 2020–2024 as the base period to project country-to-country export potential for 2030, these inputs are operationalized through calculated drivers such as gravity model parameters, tariff impact factors, and projected GDP per-capita growth. Through an analysis of hidden potentials, demand hotspots, and market conditions that are most favorable to success, this method enables firms to focus on target countries, maximize returns, and global expansion with data, backed by accuracy.
By factoring in the projected importer demand gap that is currently unmet and could be potential opportunity, it identifies the potential for the Exporter (Country) among 190 countries, against the general trade analysis, which identifies the biggest importer or exporter.
To discover high-growth global markets and optimize your business strategy:
Click Here
Pricing
- Single User License$ 1,995
- Department License$ 2,400
- Site License$ 3,120
- Global License$ 3,795

Leadership Perspectives from Industry Events
Search
Thought Leadership and Analyst Meet


Our Clients
6WResearch In News
- India Air Conditioner Market Set for Strong Rebound in 2026 After Weather-Led Correction and GST-Driven Recovery: 6Wresearch
- ADAS in India: How Automatic Emergency Braking, Blind Spot Detection & Driver Monitoring are Transforming Road Safety
- Doha a strategic location for EV manufacturing hub: IPA Qatar
- Demand for luxury TVs surging in the GCC, says Samsung
- Empowering Growth: The Thriving Journey of Bangladesh’s Cable Industry
- Demand for luxury TVs surging in the GCC, says Samsung
Latest Reports
- Nicaragua RPG Gaming Market (2026-2032)
- New Zealand RPG Gaming Market (2026-2032)
- Netherlands RPG Gaming Market (2026-2032)
- Nauru RPG Gaming Market (2026-2032)
- Namibia RPG Gaming Market (2026-2032)
- Mozambique RPG Gaming Market (2026-2032)
- Montenegro RPG Gaming Market (2026-2032)
- Mongolia RPG Gaming Market (2026-2032)
- Monaco RPG Gaming Market (2026-2032)
- Micronesia RPG Gaming Market (2026-2032)
Industry Events and Analyst Meet

HIMTEX 2026

India Refining Summit 2026

India EV Show 2026

EV tech India Expo 2026

Auto Tech Asia 2026
Whitepaper
- Middle East & Africa Commercial Security Market Click here to view more.
- Middle East & Africa Fire Safety Systems & Equipment Market Click here to view more.
- GCC Drone Market Click here to view more.
- Middle East Lighting Fixture Market Click here to view more.
- GCC Physical & Perimeter Security Market Click here to view more.