Malaysia Pulleys Market (2026-2032) | Growth, Analysis, Revenue, Companies, Value, Share, Outlook, Forecast, Trends, Industry, Size
Market Forecast By Type (Steel, Cast Iron, Glass Filled Polymer), By Applications (OEM, Aftermarket) And Competitive Landscape
| Product Code: ETC045246 | Publication Date: Jun 2023 | Updated Date: Jun 2026 | Product Type: Report | |
| Publisher: 6Wresearch | Author: Ravi Bhandari | No. of Pages: 70 | No. of Figures: 35 | No. of Tables: 5 |
Malaysia Pulleys Market Summary
The malaysia pulleys market was estimated at USD 342 Million in 2025 and is projected to reach USD 442 Million by 2032, growing at a CAGR of 5.1% from 2026 to 2032.
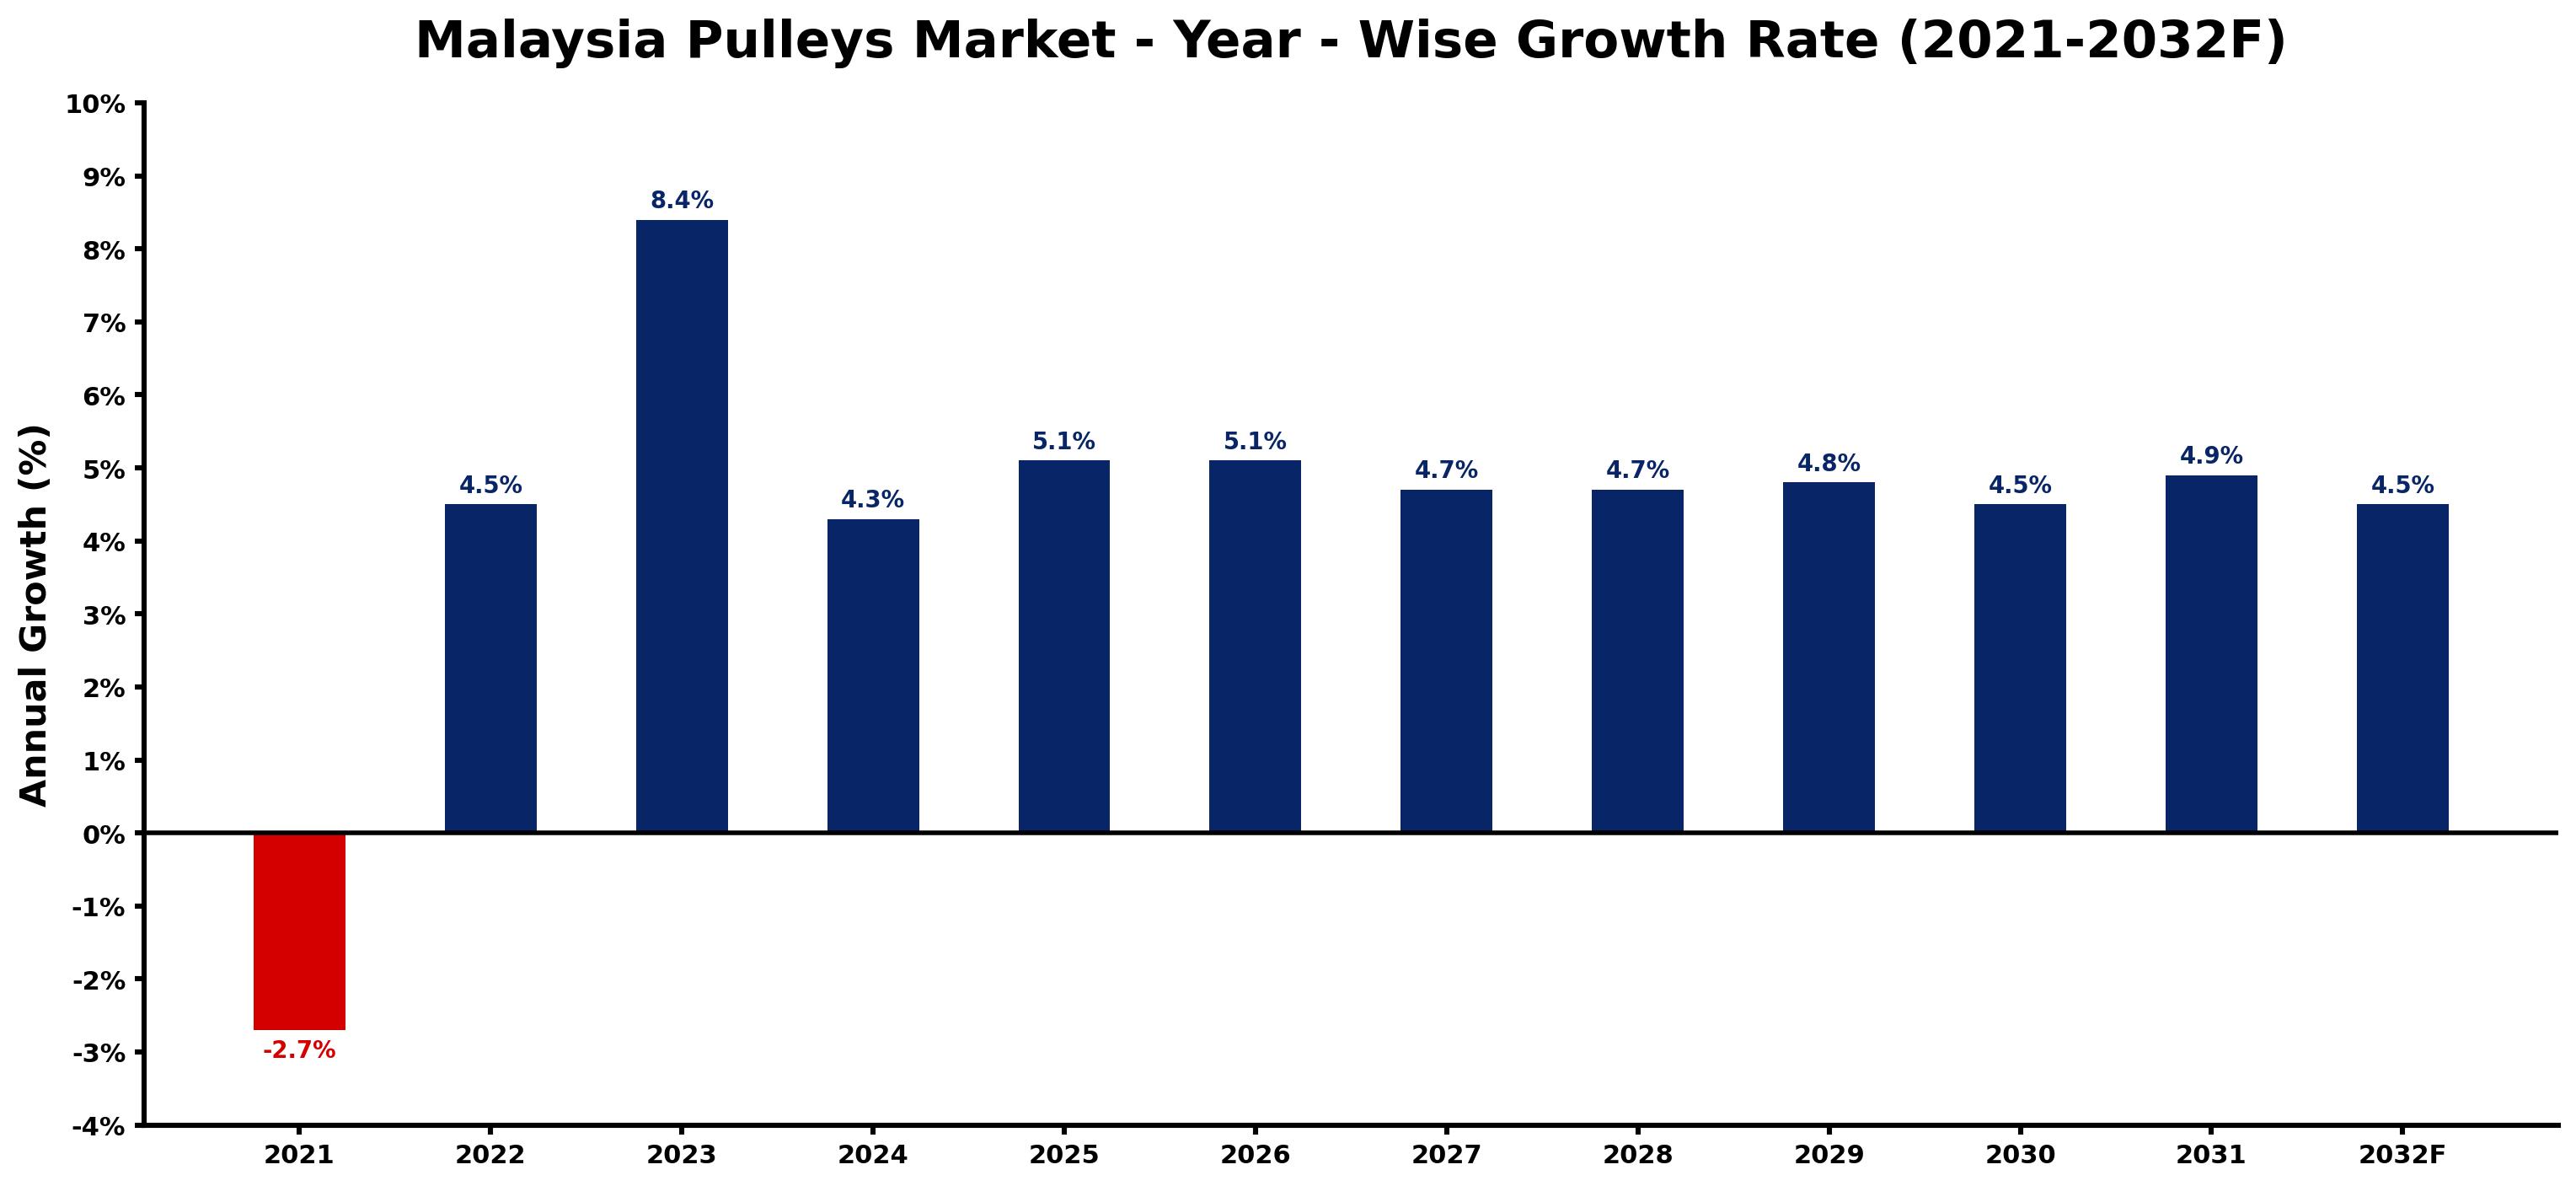
Malaysia Pulleys Market Growth Rate Analysis (2021-2032)
The Malaysia pulleys market is experiencing a notable recovery, with a 4.5% growth in 2022 following a decline of 2.7% in 2021. This resurgence is attributed to increased investments in infrastructure and industrial projects, particularly in construction and manufacturing sectors. By 2023, growth accelerated to 8.4%, driven by heightened consumer demand and a shift towards advanced pulley systems that enhance operational efficiency. The market is expected to maintain momentum, with projected annual growth rates of 4.3% in 2024 and gradually stabilizing around 4.5% to 5.1% through 2032. This upward trend reflects ongoing technological advancements and a robust energy transition, positioning Malaysia as a competitive player in the region.
Malaysia Pulleys Market Year-wise Growth Rate and Key Drivers
This graph highlights how the Malaysia Pulleys Market has steadily grown over the past five years, supported by major growth factors.
The table below presents the year wise growth rates along with the key drivers influencing the market
| Year | Growth Rate | Major Drivers |
| 2021 | -2.7% | Supply chain disruptions limited manufacturing capacities, causing delays and reduced availability of essential pulley products. |
| 2022 | 4.5% | Manufacturers increasingly seek cost-effective solutions to optimize material handling processes. |
| 2023 | 8.4% | Emerging construction projects drive demand for advanced pulley systems in infrastructure. |
| 2024 | 4.3% | Local companies are investing in automation to enhance competitive positioning globally. |
| 2025 | 5.1% | Increased focus on energy efficiency encourages innovation in pulley design and materials. |
| 2026 | 5.1% | Supply chain diversification prompts new partnerships among pulley manufacturers and suppliers. |
| 2027 | 4.7% | Rapid urbanization influences the need for robust systems in high-rise construction. |
| 2028 | 4.7% | Industrial sectors are embracing smart technologies, integrating IoT into pulley systems. |
| 2029 | 4.8% | Sustainability becomes vital, with companies prioritizing eco-friendly materials and practices. |
| 2030 | 4.5% | Regional manufacturing hubs expand, increasing the need for reliable material transport solutions. |
| 2031 | 4.9% | Technological advancements lead to lighter, stronger pulley designs appealing to various industries. |
| 2032 | 4.5% | Market consolidation creates opportunities for innovation and shared resources among manufacturers. |
Note - Market size estimations and growth projections presented in this report are based on 6Wresearch's advanced forecasting approach, validated with industry datasets as of June 2026.
Malaysia Pulleys Market Synopsis
The Malaysia Pulleys Market is projected to reach 5.1% and witness significant growth during the forecast period (2026-2032). This growth is driven by increased demand for industrial equipment across various end-use industries, substantial investments in infrastructure development, and ongoing technological advancements. Furthermore, the government's focus on promoting sustainable energy production is expected to open new avenues for future market expansion. Alongside these drivers, stringent regulations concerning safety standards are reinforcing the demand for high-efficiency products, thereby further propelling market growth.
Malaysia Pulleys Market Growth Drivers
The growth trajectory of the Malaysia Pulleys Market is influenced by several key factors:
- The rising demand for industrial equipment is a principal factor contributing to market expansion, as industries seek to enhance operational efficiency and productivity.
- Infrastructure development projects across Malaysia are stimulating the need for advanced equipment, including pulleys, which are critical in various construction and manufacturing processes.
- Technological advancements in pulley design and materials are leading to the innovation of more effective and efficient products, capturing greater market interest.
- Government initiatives aimed at sustainable energy and environmental protection are encouraging industries to adopt energy-efficient solutions, including high-performance pulleys.
- The increasing focus on safety and compliance with regulations is driving manufacturers to develop products that not only meet industry standards but also leverage energy-efficient technologies.
Malaysia Pulleys Market Challenges and Restraints
Despite the positive outlook for the Malaysia Pulleys Market, several challenges may impede its growth:
- The limited availability of raw materials necessary for pulley manufacturing could restrict production capabilities and stymie market growth.
- Higher costs associated with high-efficiency pulleys may hinder widespread adoption, particularly among small and medium enterprises (SMEs) in Malaysia.
- The need for constant technological upgrades and investments in research and development can strain smaller manufacturers financially.
- Market players may face intense competition, which could lead to price wars and affect profitability margins while pushing companies to innovate rapidly.
- Fluctuations in global supply chains and economic uncertainties can further impact the availability and cost of necessary raw materials as well as final products.
Malaysia Pulleys Market Investment Opportunities
The evolving landscape of the Malaysia Pulleys Market presents considerable investment opportunities:
- Investments in research and development for advanced materials and designs can yield innovative pulley products that meet the growing demand for energy efficiency.
- Expansion into the renewable energy sector is a promising avenue, as the shift towards sustainable practices necessitates specialized pulleys for various applications.
- Collaboration with local SMEs can create strategic partnerships that leverage strengths and improve market penetration through tailored solutions.
- Government incentives for infrastructure projects can encourage investment into manufacturing facilities, allowing businesses to capitalize on emerging opportunities.
- Exploring foreign markets can diversify revenue streams for pulley manufacturers, mitigating risks associated with domestic economic fluctuations.
Malaysia Pulleys Market Government Investment and Initiatives
The Malaysian government has implemented various initiatives aimed at fostering growth within the Malaysia Pulleys Market:
- Public spending on infrastructure development has significantly increased, which inherently boosts the demand for industrial equipment, including pulleys.
- Policies promoting sustainable energy production create a conducive environment for manufacturers to develop eco-friendly pulley solutions.
- Government incentives for safety and compliance adherence encourage manufacturers to invest in high-quality, efficient products.
- Ongoing investments in technological innovation and digitalization within the manufacturing sector are driving improvements in product offerings.
- Support for SMEs through funding and grants enables smaller companies to adopt advanced manufacturing technologies, contributing to market growth.
Malaysia Pulleys Market Latest Developments (May 2025 - June 2026)
The Malaysia Pulleys Market is witnessing several notable developments:
- Increased investment in R&D for advanced materials, resulting in more durable and efficient pulley systems.
- Growing collaboration between manufacturers and technology companies to integrate IoT solutions into pulley systems for enhanced performance and monitoring.
- Expansion of manufacturing capabilities in response to rising demand in the construction and renewable energy sectors.
- Rollout of government-backed initiatives to facilitate training and development programs aimed at enhancing workforce skills pertaining to pulley manufacturing.
- Heightened focus on regulatory compliance, with manufacturers actively updating their product lines to meet newly introduced safety and performance standards.
Malaysia Pulleys Market - Key Attractiveness of the Report
- 10 Years of Market Numbers
- Historical Data Starting from 2022 to 2025
- Base Year: 2025
- Forecast Data until 2032
- Key Performance Indicators Impacting the Market
- Major Upcoming Developments and Projects
Key Highlights of the Report:
- Malaysia Pulleys Market Outlook
- Market Size of Malaysia Pulleys Market, 2025
- Forecast of Malaysia Pulleys Market, 2032F
- Historical Data and Forecast of Malaysia Pulleys Revenues & Volume for the Period 2022-2032F
- Malaysia Pulleys Market Trend Evolution
- Malaysia Pulleys Market Drivers and Challenges
- Malaysia Pulleys Price Trends
- Malaysia Pulleys Porter's Five Forces
- Malaysia Pulleys Industry Life Cycle
- Historical Data and Forecast of Malaysia Pulleys Market Revenues & Volume By Type for the Period 2022-2032F
- Historical Data and Forecast of Malaysia Pulleys Market Revenues & Volume By Steel for the Period 2022-2032F
- Historical Data and Forecast of Malaysia Pulleys Market Revenues & Volume By Cast Iron for the Period 2022-2032F
- Historical Data and Forecast of Malaysia Pulleys Market Revenues & Volume By Glass Filled Polymer for the Period 2022-2032F
- Historical Data and Forecast of Malaysia Pulleys Market Revenues & Volume By Applications for the Period 2022-2032F
- Historical Data and Forecast of Malaysia Pulleys Market Revenues & Volume By OEM for the Period 2022-2032F
- Historical Data and Forecast of Malaysia Pulleys Market Revenues & Volume By Aftermarket for the Period 2022-2032F
- Malaysia Pulleys Import Export Trade Statistics
- Market Opportunity Assessment By Type
- Market Opportunity Assessment By Applications
- Malaysia Pulleys Top Companies Market Share
- Malaysia Pulleys Competitive Benchmarking By Technical and Operational Parameters
- Malaysia Pulleys Company Profiles
- Malaysia Pulleys Key Strategic Recommendations
Frequently Asked Questions About the Market Study (FAQs):
Growth is primarily driven by increasing industrial demand, infrastructure investments, and government initiatives towards sustainability.
Key challenges include the limited availability of raw materials and the high costs associated with advanced pulley systems, particularly for SMEs.
Government policies are promoting infrastructure development and sustainable practices, creating a favorable environment for market growth.
The forecast period for the Malaysia Pulleys Market is from 2026 to 2032.
6Wresearch actively monitors the Malaysia Pulleys Market and publishes its comprehensive annual report, highlighting emerging trends, growth drivers, revenue analysis, and forecast outlook. Our insights help businesses to make data-backed strategic decisions with ongoing market dynamics. Our analysts track relevent industries related to the Malaysia Pulleys Market, allowing our clients with actionable intelligence and reliable forecasts tailored to emerging regional needs.
Yes, we provide customisation as per your requirements. To learn more, feel free to contact us on sales@6wresearch.com
1 Executive Summary |
2 Introduction |
2.1 Key Highlights of the Report |
2.2 Report Description |
2.3 Market Scope & Segmentation |
2.4 Research Methodology |
2.5 Assumptions |
3 Malaysia Pulleys Market Overview |
3.1 Malaysia Country Macro Economic Indicators |
3.2 Malaysia Pulleys Market Revenues & Volume, 2022 & 2032F |
3.3 Malaysia Pulleys Market - Industry Life Cycle |
3.4 Malaysia Pulleys Market - Porter's Five Forces |
3.5 Malaysia Pulleys Market Revenues & Volume Share, By Type, 2022 & 2032F |
3.6 Malaysia Pulleys Market Revenues & Volume Share, By Applications, 2022 & 2032F |
4 Malaysia Pulleys Market Dynamics |
4.1 Impact Analysis |
4.2 Market Drivers |
4.3 Market Restraints |
5 Malaysia Pulleys Market Trends |
6 Malaysia Pulleys Market, By Types |
6.1 Malaysia Pulleys Market, By Type |
6.1.1 Overview and Analysis |
6.1.2 Malaysia Pulleys Market Revenues & Volume, By Type, 2022-2032F |
6.1.3 Malaysia Pulleys Market Revenues & Volume, By Steel, 2022-2032F |
6.1.4 Malaysia Pulleys Market Revenues & Volume, By Cast Iron, 2022-2032F |
6.1.5 Malaysia Pulleys Market Revenues & Volume, By Glass Filled Polymer, 2022-2032F |
6.2 Malaysia Pulleys Market, By Applications |
6.2.1 Overview and Analysis |
6.2.2 Malaysia Pulleys Market Revenues & Volume, By OEM, 2022-2032F |
6.2.3 Malaysia Pulleys Market Revenues & Volume, By Aftermarket, 2022-2032F |
7 Malaysia Pulleys Market Import-Export Trade Statistics |
7.1 Malaysia Pulleys Market Export to Major Countries |
7.2 Malaysia Pulleys Market Imports from Major Countries |
8 Malaysia Pulleys Market Key Performance Indicators |
9 Malaysia Pulleys Market - Opportunity Assessment |
9.1 Malaysia Pulleys Market Opportunity Assessment, By Type, 2022 & 2032F |
9.2 Malaysia Pulleys Market Opportunity Assessment, By Applications, 2022 & 2032F |
10 Malaysia Pulleys Market - Competitive Landscape |
10.1 Malaysia Pulleys Market Revenue Share, By Companies, 2025 |
10.2 Malaysia Pulleys Market Competitive Benchmarking, By Operating and Technical Parameters |
11 Company Profiles |
12 Recommendations |
13 Disclaimer |
Global Go To Market Strategy - 2030
Export potential enables firms to identify high-growth global markets with greater confidence by combining advanced trade intelligence with a structured quantitative methodology. The framework analyzes emerging demand trends and country-level import patterns while integrating macroeconomic and trade datasets such as GDP and population forecasts, bilateral import–export flows, tariff structures, elasticity differentials between developed and developing economies, geographic distance, and import demand projections. Using weighted trade values from 2020–2024 as the base period to project country-to-country export potential for 2030, these inputs are operationalized through calculated drivers such as gravity model parameters, tariff impact factors, and projected GDP per-capita growth. Through an analysis of hidden potentials, demand hotspots, and market conditions that are most favorable to success, this method enables firms to focus on target countries, maximize returns, and global expansion with data, backed by accuracy.
By factoring in the projected importer demand gap that is currently unmet and could be potential opportunity, it identifies the potential for the Exporter (Country) among 190 countries, against the general trade analysis, which identifies the biggest importer or exporter.
To discover high-growth global markets and optimize your business strategy:
Click Here
Pricing
- Single User License$ 1,995
- Department License$ 2,400
- Site License$ 3,120
- Global License$ 3,795

Leadership Perspectives from Industry Events
Search
Thought Leadership and Analyst Meet


Our Clients
6WResearch In News
- India Air Conditioner Market Set for Strong Rebound in 2026 After Weather-Led Correction and GST-Driven Recovery: 6Wresearch
- ADAS in India: How Automatic Emergency Braking, Blind Spot Detection & Driver Monitoring are Transforming Road Safety
- Doha a strategic location for EV manufacturing hub: IPA Qatar
- Demand for luxury TVs surging in the GCC, says Samsung
- Empowering Growth: The Thriving Journey of Bangladesh’s Cable Industry
- Demand for luxury TVs surging in the GCC, says Samsung
Latest Reports
- Nicaragua RPG Gaming Market (2026-2032)
- New Zealand RPG Gaming Market (2026-2032)
- Netherlands RPG Gaming Market (2026-2032)
- Nauru RPG Gaming Market (2026-2032)
- Namibia RPG Gaming Market (2026-2032)
- Mozambique RPG Gaming Market (2026-2032)
- Montenegro RPG Gaming Market (2026-2032)
- Mongolia RPG Gaming Market (2026-2032)
- Monaco RPG Gaming Market (2026-2032)
- Micronesia RPG Gaming Market (2026-2032)
Industry Events and Analyst Meet

HIMTEX 2026

India Refining Summit 2026

India EV Show 2026

EV tech India Expo 2026

Auto Tech Asia 2026
Whitepaper
- Middle East & Africa Commercial Security Market Click here to view more.
- Middle East & Africa Fire Safety Systems & Equipment Market Click here to view more.
- GCC Drone Market Click here to view more.
- Middle East Lighting Fixture Market Click here to view more.
- GCC Physical & Perimeter Security Market Click here to view more.