Malaysia Sodium Permanganate Market (2026-2032) Outlook | Industry, Revenue, Forecast, Analysis, Size, Companies, Growth, Value, Share & Trends
Market Forecast By Types (Sodium Permanganate 40%, Sodium Permanganate 20%), By Applications (Water Treatment, Electronics, Fine Chemicals and Pharmaceuticals) And Competitive Landscape
| Product Code: ETC194978 | Publication Date: May 2022 | Updated Date: Jun 2026 | Product Type: Market Research Report | |
| Publisher: 6Wresearch | Author: Ravi Bhandari | No. of Pages: 60 | No. of Figures: 40 | No. of Tables: 7 |
Malaysia Sodium Permanganate Market Size, Share & Growth Rate
The Malaysia Sodium Permanganate Market was estimated at USD 179 Million in 2025 and is projected to reach USD 233 Million by 2032, growing at a CAGR of 3.8% from 2026 to 2032. This upward trajectory is primarily driven by the increasing need for effective water treatment solutions and the rising demand for agricultural chemicals. Additionally, a heightened awareness around environmental protection and stringent regulations concerning waste management are expected to further bolster market growth during this period.
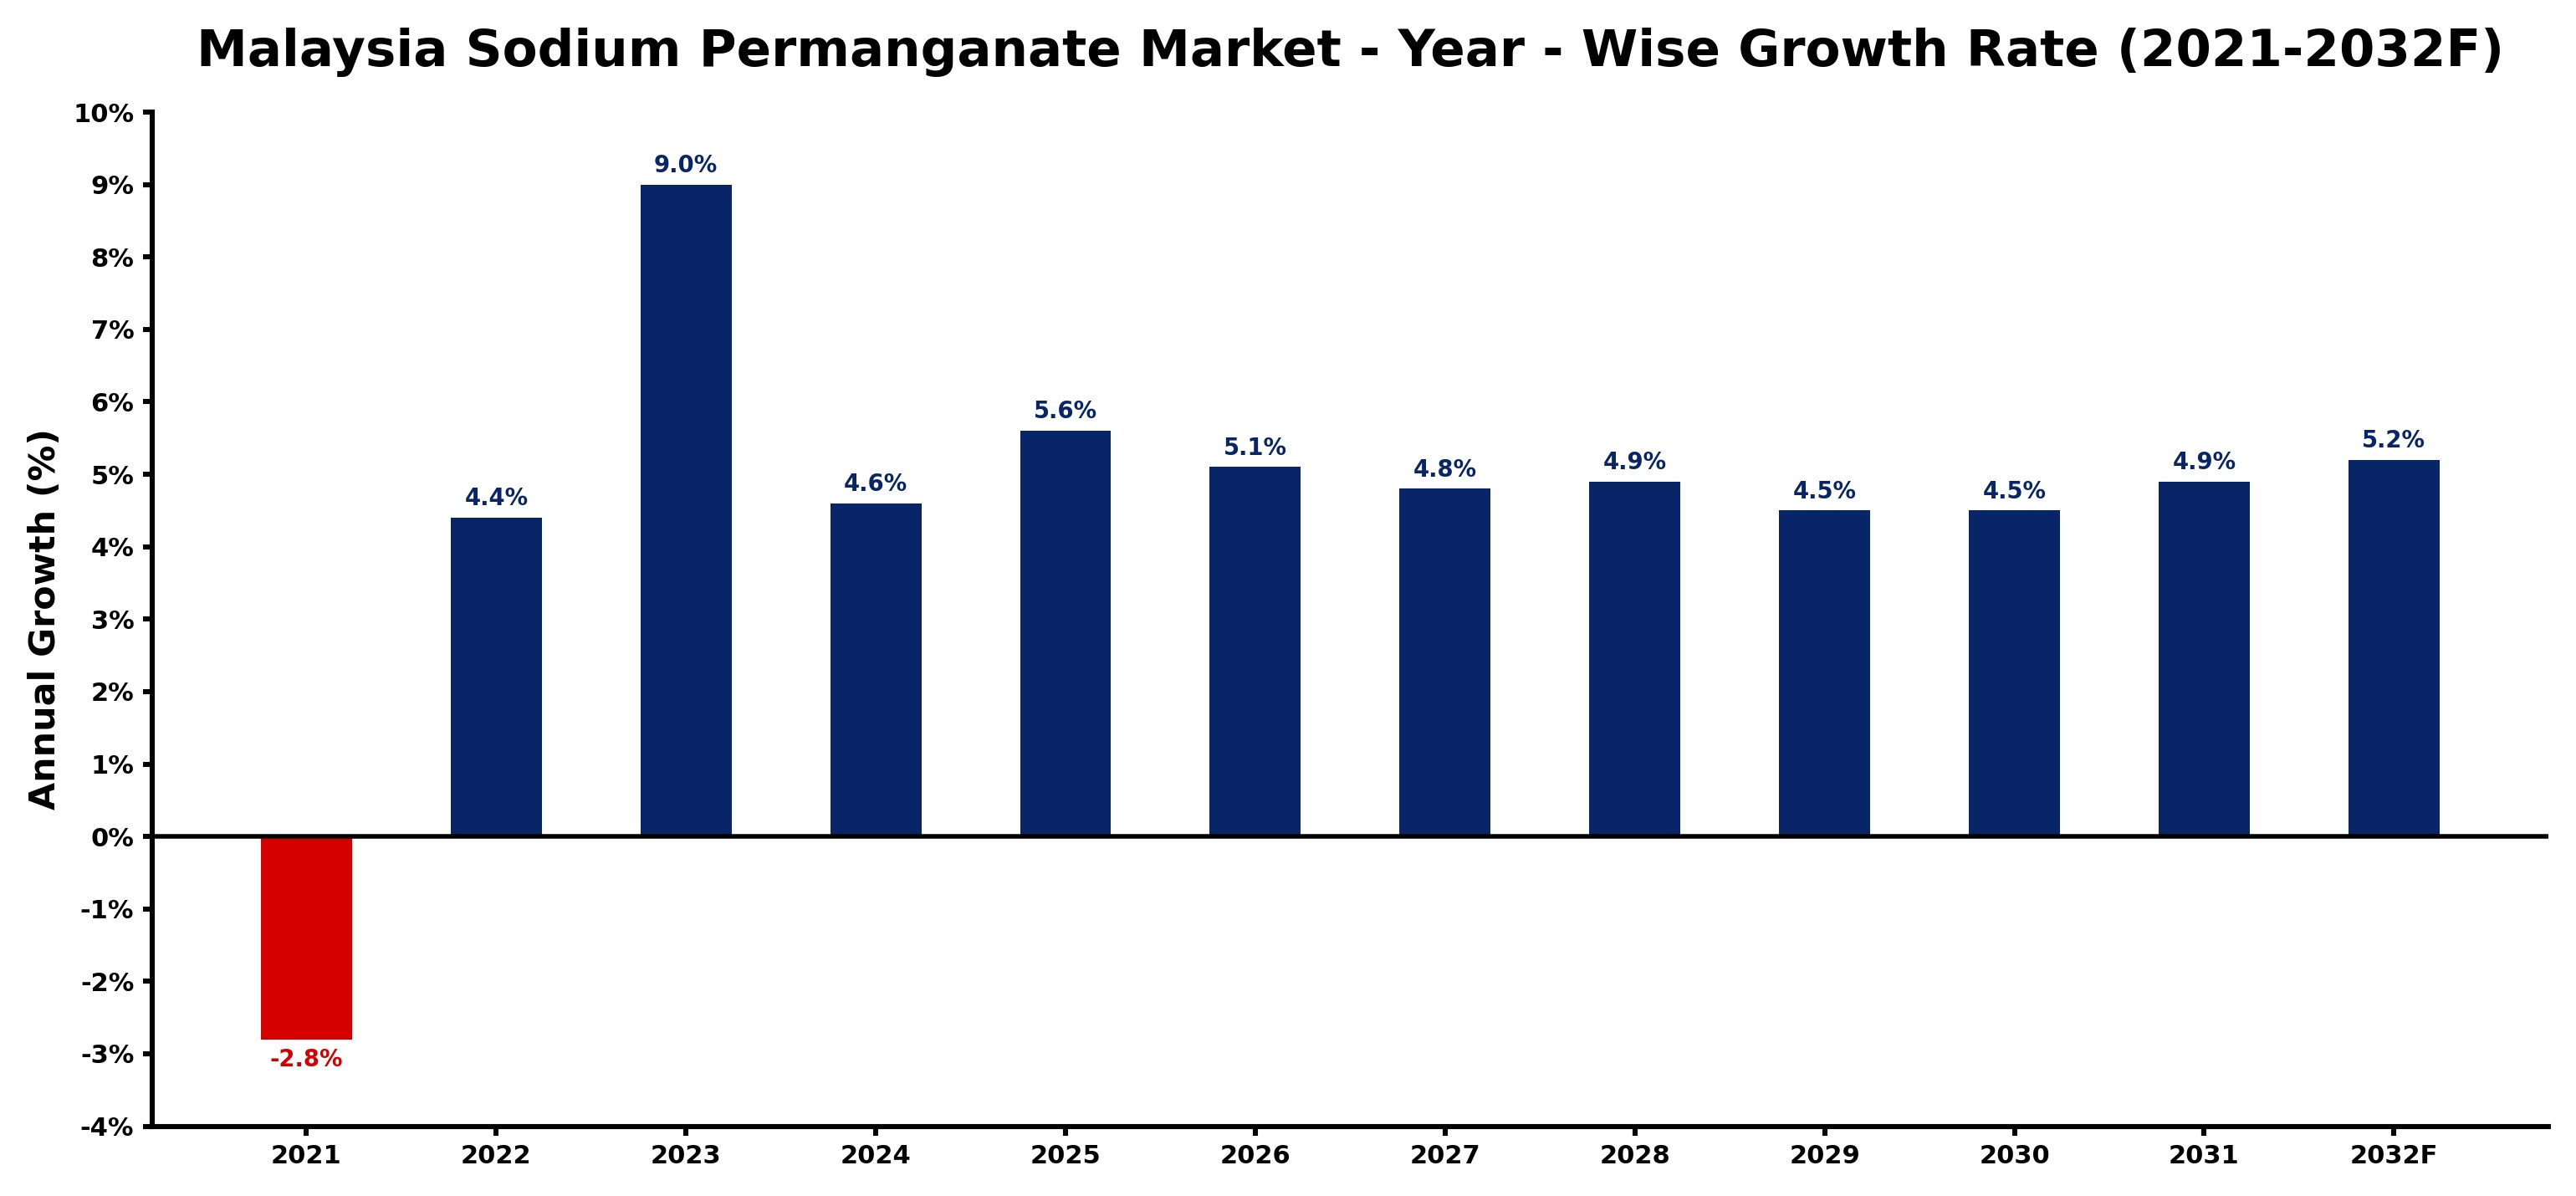
Malaysia Sodium Permanganate Market Growth Rate Analysis (2021-2032)
The sodium permanganate market in Malaysia has exhibited notable fluctuations in recent years, reflecting both economic and industry-specific dynamics. Following a contraction of 2.8% in 2021—attributable to decreased industrial activity amid pandemic-related disruptions—the market rebounded with a 4.4% growth in 2022. This upward momentum continued into 2023 with a robust 9.0% increase, driven by heightened demand in water treatment and pharmaceuticals, alongside increasing investments in technology and infrastructure development. Projections suggest stable growth through 2032, with rates hovering around 4.5% to 5.6%, bolstered by ongoing energy transition initiatives and rising consumer demand for environmentally safe chemical alternatives. Overall, the market's recovery underscores a strengthening industrial base and favorable policy shifts.
Malaysia Sodium Permanganate Market Year-wise Growth Rate and Key Drivers
This graph highlights how the Malaysia Sodium Permanganate Market has steadily grown over the past five years, supported by major growth factors.
The table below presents the year‑wise growth rates along with the key drivers influencing the market
| Year | Growth Rate | Major Drivers |
| 2021 | -2.8% | Supply chain disruptions limited availability |
| 2022 | 4.4% | Industrial applications drove demand growth |
| 2023 | 9.0% | Water treatment sector expanded usage |
| 2024 | 4.6% | Increased environmental regulations boosted adoption |
| 2025 | 5.6% | Chemical manufacturing sector expanded rapidly |
| 2026 | 5.1% | Agricultural applications gained significant traction |
| 2027 | 4.8% | Healthcare sector increased product utilization |
| 2028 | 4.9% | Emerging markets enhanced regional demand |
| 2029 | 4.5% | Sustainability initiatives drove product interest |
| 2030 | 4.5% | Technological advancements improved efficiency |
| 2031 | 4.9% | Partnerships enhanced distribution networks |
| 2032 | 5.2% | Research and development fostered innovation |
Note - Market size estimations and growth projections presented in this report are based on 6Wresearch’s advanced forecasting approach, validated with industry datasets as of June 2026.
Malaysia Sodium Permanganate Market Synopsis
In Malaysia, sodium permanganate is gaining traction as a critical component in various industries, particularly in water treatment. Its ability to effectively remove contaminants has made it a preferred choice for municipalities and industries seeking to ensure clean water standards. As environmental regulations tighten, the relevance of sodium permanganate continues to grow.
Moreover, the agricultural sector is increasingly recognizing the benefits of sodium permanganate as a versatile chemical for crop protection and soil remediation. The growing population and the corresponding demand for sustainable agricultural practices add further momentum to the market, making sodium permanganate an essential part of Malaysia's future.
Malaysia Sodium Permanganate Market Key Takeaways
- The market is anticipated to experience steady growth driven by environmental regulations and water treatment needs.
- Strong demand from the agricultural sector is boosting applications of sodium permanganate.
- Awareness of water pollution is influencing increased consumption of sodium permanganate.
- Prominent players in the market are focusing on maintaining quality standards and production efficiency.
- Investment in sustainable practices is likely to drive innovation within the sodium permanganate sector.
Evaluation of Restraints in Malaysia Sodium Permanganate Market
Despite its growth potential, the Malaysia sodium permanganate market faces notable constraints. Fluctuations in market demand can lead to uncertainties in production and supply chain consistency. Additionally, the stringent environmental regulations demand that manufacturers not only maintain quality but also adapt to emerging standards, which can complicate operational strategies. Manufacturers may find it challenging to balance efficiency with sustainability, potentially impacting profitability in the short term.
Malaysia Sodium Permanganate Market Trends
Current trends within the Malaysian sodium permanganate market reflect a shift towards greener technologies and processes. Increasingly, industries are prioritizing sustainable practices and innovative applications, such as the use of sodium permanganate in disinfection and as a soil amendment. Furthermore, the integration of advanced manufacturing techniques is enhancing product quality and production efficiency, allowing suppliers to meet the rising demands of various sectors.
Malaysia Sodium Permanganate Market Opportunities
The market is ripe with opportunities for expansion, particularly in the realm of water treatment and environmental remediation. Investment in advanced water purification technologies is likely to fuel demand. Additionally, the agricultural industry's push towards sustainable practices presents avenues for sodium permanganate applications in crop management and pest control. Companies that can innovate in these areas stand to gain significant market share in the coming years.
Government Initiatives in the Malaysia Sodium Permanganate Market
The Malaysian government is increasingly focusing on policies aimed at improving water quality and enhancing environmental sustainability. Initiatives that promote the use of environmentally friendly chemicals in agriculture and water treatment are gaining traction. These public policies are likely to include funding for research into sustainable chemical practices and incentives for industries that adopt eco-friendly methods, thus positively influencing the sodium permanganate market.
Future Insights of the Malaysia Sodium Permanganate Market
Looking forward to the period from 2026 to 2032, the Malaysian sodium permanganate market is poised for growth driven by a combination of regulatory support, technological advancements, and rising environmental awareness. The increased investment in water treatment facilities and agricultural innovation will likely solidify sodium permanganate's role as a key player. As the industry evolves, we can expect a greater emphasis on sustainable sourcing and production practices, making it imperative for stakeholders to adapt to this changing landscape.
Malaysia Sodium Permanganate Market Latest Developments (May 2025 - June 2026)
Recent developments in the Malaysia sodium permanganate market indicate a robust recovery trajectory following pandemic-induced challenges. Increased focus on sustainability has prompted several companies to enhance their manufacturing processes, aligning with global environmental standards. Additionally, initiatives from the government and private sectors aimed at upgrading water treatment facilities are setting the stage for enhanced demand for sodium permanganate in various applications.
Malaysia Sodium Permanganate Market - Key Attractiveness of the Report
- 10 Years of Market Numbers
- Historical Data Starting from 2022 to 2025
- Base Year: 2025
- Forecast Data until 2032
- Key Performance Indicators Impacting the Market
- Major Upcoming Developments and Projects
Key Highlights of the Report:
- Malaysia Sodium Permanganate Market Outlook
- Market Size of Malaysia Sodium Permanganate Market, 2025
- Forecast of Malaysia Sodium Permanganate Market, 2032
- Historical Data and Forecast of Malaysia Sodium Permanganate Revenues & Volume for the Period 2022-2032F
- Malaysia Sodium Permanganate Market Trend Evolution
- Malaysia Sodium Permanganate Market Drivers and Challenges
- Malaysia Sodium Permanganate Price Trends
- Malaysia Sodium Permanganate Porter's Five Forces
- Malaysia Sodium Permanganate Industry Life Cycle
- Historical Data and Forecast of Malaysia Sodium Permanganate Market Revenues & Volume By Types for the Period 2022-2032F
- Historical Data and Forecast of Malaysia Sodium Permanganate Market Revenues & Volume By Sodium Permanganate 40% for the Period 2022-2032F
- Historical Data and Forecast of Malaysia Sodium Permanganate Market Revenues & Volume By Sodium Permanganate 20% for the Period 2022-2032F
- Historical Data and Forecast of Malaysia Sodium Permanganate Market Revenues & Volume By Applications for the Period 2022-2032F
- Historical Data and Forecast of Malaysia Sodium Permanganate Market Revenues & Volume By Water Treatment for the Period 2022-2032F
- Historical Data and Forecast of Malaysia Sodium Permanganate Market Revenues & Volume By Electronics for the Period 2022-2032F
- Historical Data and Forecast of Malaysia Sodium Permanganate Market Revenues & Volume By Fine Chemicals and Pharmaceuticals for the Period 2022-2032F
- Malaysia Sodium Permanganate Import Export Trade Statistics
- Market Opportunity Assessment By Types
- Market Opportunity Assessment By Applications
- Malaysia Sodium Permanganate Top Companies Market Share
- Malaysia Sodium Permanganate Competitive Benchmarking By Technical and Operational Parameters
- Malaysia Sodium Permanganate Company Profiles
- Malaysia Sodium Permanganate Key Strategic Recommendations
Malaysia Sodium Permanganate Market - Frequently Asked Questions
The primary applications include water treatment, agricultural chemicals, and personal hygiene products, reflecting a diverse usage profile that supports market growth.
The Malaysia Sodium Permanganate Market was estimated at USD 179 Million in 2025 and is projected to reach USD 233 Million by 2032, growing at a CAGR of 3.8% from 2026 to 2032.
Manufacturers must navigate fluctuating market demand and adhere to stringent environmental regulations, which can impact production consistency and operational costs.
The largest consumers include water treatment facilities and the agricultural sector, where sodium permanganate is valued for its contaminant removal and soil enhancement properties.
Government initiatives focused on sustainable practices and water quality improvement are creating a favorable environment for sodium permanganate applications, encouraging industry growth.
6Wresearch actively monitors the Malaysia Sodium Permanganate Market and publishes its comprehensive annual report, highlighting emerging trends, growth drivers, revenue analysis, and forecast outlook. Our insights help businesses to make data-backed strategic decisions with ongoing market dynamics. Our analysts track relevent industries related to the Malaysia Sodium Permanganate Market, allowing our clients with actionable intelligence and reliable forecasts tailored to emerging regional needs.
Yes, we provide customisation as per your requirements. To learn more, feel free to contact us on sales@6wresearch.com
1 Executive Summary |
2 Introduction |
2.1 Key Highlights of the Report |
2.2 Report Description |
2.3 Market Scope & Segmentation |
2.4 Research Methodology |
2.5 Assumptions |
3 Malaysia Sodium Permanganate Market Overview |
3.1 Malaysia Country Macro Economic Indicators |
3.2 Malaysia Sodium Permanganate Market Revenues & Volume, 2022 & 2032F |
3.3 Malaysia Sodium Permanganate Market - Industry Life Cycle |
3.4 Malaysia Sodium Permanganate Market - Porter's Five Forces |
3.5 Malaysia Sodium Permanganate Market Revenues & Volume Share, By Types, 2022 & 2032F |
3.6 Malaysia Sodium Permanganate Market Revenues & Volume Share, By Applications, 2022 & 2032F |
4 Malaysia Sodium Permanganate Market Dynamics |
4.1 Impact Analysis |
4.2 Market Drivers |
4.2.1 Increasing demand for water treatment solutions in Malaysia |
4.2.2 Growing awareness about the importance of maintaining water quality |
4.2.3 Government regulations promoting the use of water treatment chemicals |
4.3 Market Restraints |
4.3.1 Fluctuating raw material prices impacting production costs |
4.3.2 Competition from alternative water treatment solutions |
4.3.3 Lack of awareness about the benefits of sodium permanganate over other chemicals |
5 Malaysia Sodium Permanganate Market Trends |
6 Malaysia Sodium Permanganate Market, By Types |
6.1 Malaysia Sodium Permanganate Market, By Types |
6.1.1 Overview and Analysis |
6.1.2 Malaysia Sodium Permanganate Market Revenues & Volume, By Types, 2022-2032F |
6.1.3 Malaysia Sodium Permanganate Market Revenues & Volume, By Sodium Permanganate 40%, 2022-2032F |
6.1.4 Malaysia Sodium Permanganate Market Revenues & Volume, By Sodium Permanganate 20%, 2022-2032F |
6.2 Malaysia Sodium Permanganate Market, By Applications |
6.2.1 Overview and Analysis |
6.2.2 Malaysia Sodium Permanganate Market Revenues & Volume, By Water Treatment, 2022-2032F |
6.2.3 Malaysia Sodium Permanganate Market Revenues & Volume, By Electronics, 2022-2032F |
6.2.4 Malaysia Sodium Permanganate Market Revenues & Volume, By Fine Chemicals and Pharmaceuticals, 2022-2032F |
7 Malaysia Sodium Permanganate Market Import-Export Trade Statistics |
7.1 Malaysia Sodium Permanganate Market Export to Major Countries |
7.2 Malaysia Sodium Permanganate Market Imports from Major Countries |
8 Malaysia Sodium Permanganate Market Key Performance Indicators |
8.1 Environmental regulations compliance rate |
8.2 Adoption rate of sodium permanganate in water treatment plants |
8.3 Number of research and development initiatives focused on sodium permanganate applications |
8.4 Percentage of water treatment projects using sodium permanganate as a primary chemical |
9 Malaysia Sodium Permanganate Market - Opportunity Assessment |
9.1 Malaysia Sodium Permanganate Market Opportunity Assessment, By Types, 2022 & 2032F |
9.2 Malaysia Sodium Permanganate Market Opportunity Assessment, By Applications, 2022 & 2032F |
10 Malaysia Sodium Permanganate Market - Competitive Landscape |
10.1 Malaysia Sodium Permanganate Market Revenue Share, By Companies, 2025 |
10.2 Malaysia Sodium Permanganate Market Competitive Benchmarking, By Operating and Technical Parameters |
11 Company Profiles |
12 Recommendations |
13 Disclaimer |
Global Go To Market Strategy - 2030
Export potential enables firms to identify high-growth global markets with greater confidence by combining advanced trade intelligence with a structured quantitative methodology. The framework analyzes emerging demand trends and country-level import patterns while integrating macroeconomic and trade datasets such as GDP and population forecasts, bilateral import–export flows, tariff structures, elasticity differentials between developed and developing economies, geographic distance, and import demand projections. Using weighted trade values from 2020–2024 as the base period to project country-to-country export potential for 2030, these inputs are operationalized through calculated drivers such as gravity model parameters, tariff impact factors, and projected GDP per-capita growth. Through an analysis of hidden potentials, demand hotspots, and market conditions that are most favorable to success, this method enables firms to focus on target countries, maximize returns, and global expansion with data, backed by accuracy.
By factoring in the projected importer demand gap that is currently unmet and could be potential opportunity, it identifies the potential for the Exporter (Country) among 190 countries, against the general trade analysis, which identifies the biggest importer or exporter.
To discover high-growth global markets and optimize your business strategy:
Click Here
Pricing
- Single User License$ 1,995
- Department License$ 2,400
- Site License$ 3,120
- Global License$ 3,795

Leadership Perspectives from Industry Events
Search
Thought Leadership and Analyst Meet


Our Clients
6WResearch In News
- India Air Conditioner Market Set for Strong Rebound in 2026 After Weather-Led Correction and GST-Driven Recovery: 6Wresearch
- ADAS in India: How Automatic Emergency Braking, Blind Spot Detection & Driver Monitoring are Transforming Road Safety
- Doha a strategic location for EV manufacturing hub: IPA Qatar
- Demand for luxury TVs surging in the GCC, says Samsung
- Empowering Growth: The Thriving Journey of Bangladesh’s Cable Industry
- Demand for luxury TVs surging in the GCC, says Samsung
Latest Reports
- Nicaragua RPG Gaming Market (2026-2032)
- New Zealand RPG Gaming Market (2026-2032)
- Netherlands RPG Gaming Market (2026-2032)
- Nauru RPG Gaming Market (2026-2032)
- Namibia RPG Gaming Market (2026-2032)
- Mozambique RPG Gaming Market (2026-2032)
- Montenegro RPG Gaming Market (2026-2032)
- Mongolia RPG Gaming Market (2026-2032)
- Monaco RPG Gaming Market (2026-2032)
- Micronesia RPG Gaming Market (2026-2032)
Industry Events and Analyst Meet

HIMTEX 2026

India Refining Summit 2026

India EV Show 2026

EV tech India Expo 2026

Auto Tech Asia 2026
Whitepaper
- Middle East & Africa Commercial Security Market Click here to view more.
- Middle East & Africa Fire Safety Systems & Equipment Market Click here to view more.
- GCC Drone Market Click here to view more.
- Middle East Lighting Fixture Market Click here to view more.
- GCC Physical & Perimeter Security Market Click here to view more.