Malaysia Tables Market (2026-2032) | Growth, Size, Trends, Analysis, Forecast, Revenue, Share, Outlook, Industry, Value & Companies
Market Forecast By Types (Fabric, Leather, Metal, Wooden, Others), By Applications (Family, Office, Others) And Competitive Landscape
| Product Code: ETC034666 | Publication Date: Jun 2023 | Updated Date: Jun 2026 | Product Type: Report | |
| Publisher: 6Wresearch | Author: Ravi Bhandari | No. of Pages: 70 | No. of Figures: 35 | No. of Tables: 5 |
Malaysia Tables Market Summary
The malaysia tables market was estimated at USD 286 Million in 2025 and is projected to reach USD 372 Million by 2032, growing at a CAGR of 5.3% from 2026 to 2032.
Malaysia Tables Market Growth Rate Analysis (2021-2032)
The Malaysian tables market has experienced a notable recovery following a decline of 3.4% in 2021, primarily due to pandemic-related disruptions and a decrease in consumer spending. In 2022, the market rebounded with a growth of 4.5%, fueled by a resurgence in home renovation projects as consumers sought improved living conditions. By 2023, growth accelerated to 9.1%, supported by increased investments in infrastructure and a flourishing real estate sector. The upward trend continues through 2024 to 2026, with growth rates stabilizing around 4.4% to 5.3%, as digitalization and e-commerce drive consumer demand. This trend reflects a blend of changing lifestyles and a robust economic environment conducive to further expansion.
Malaysia Tables Market Year-wise Growth Rate and Key Drivers
This graph highlights how the Malaysia Tables Market has steadily grown over the past five years, supported by major growth factors.
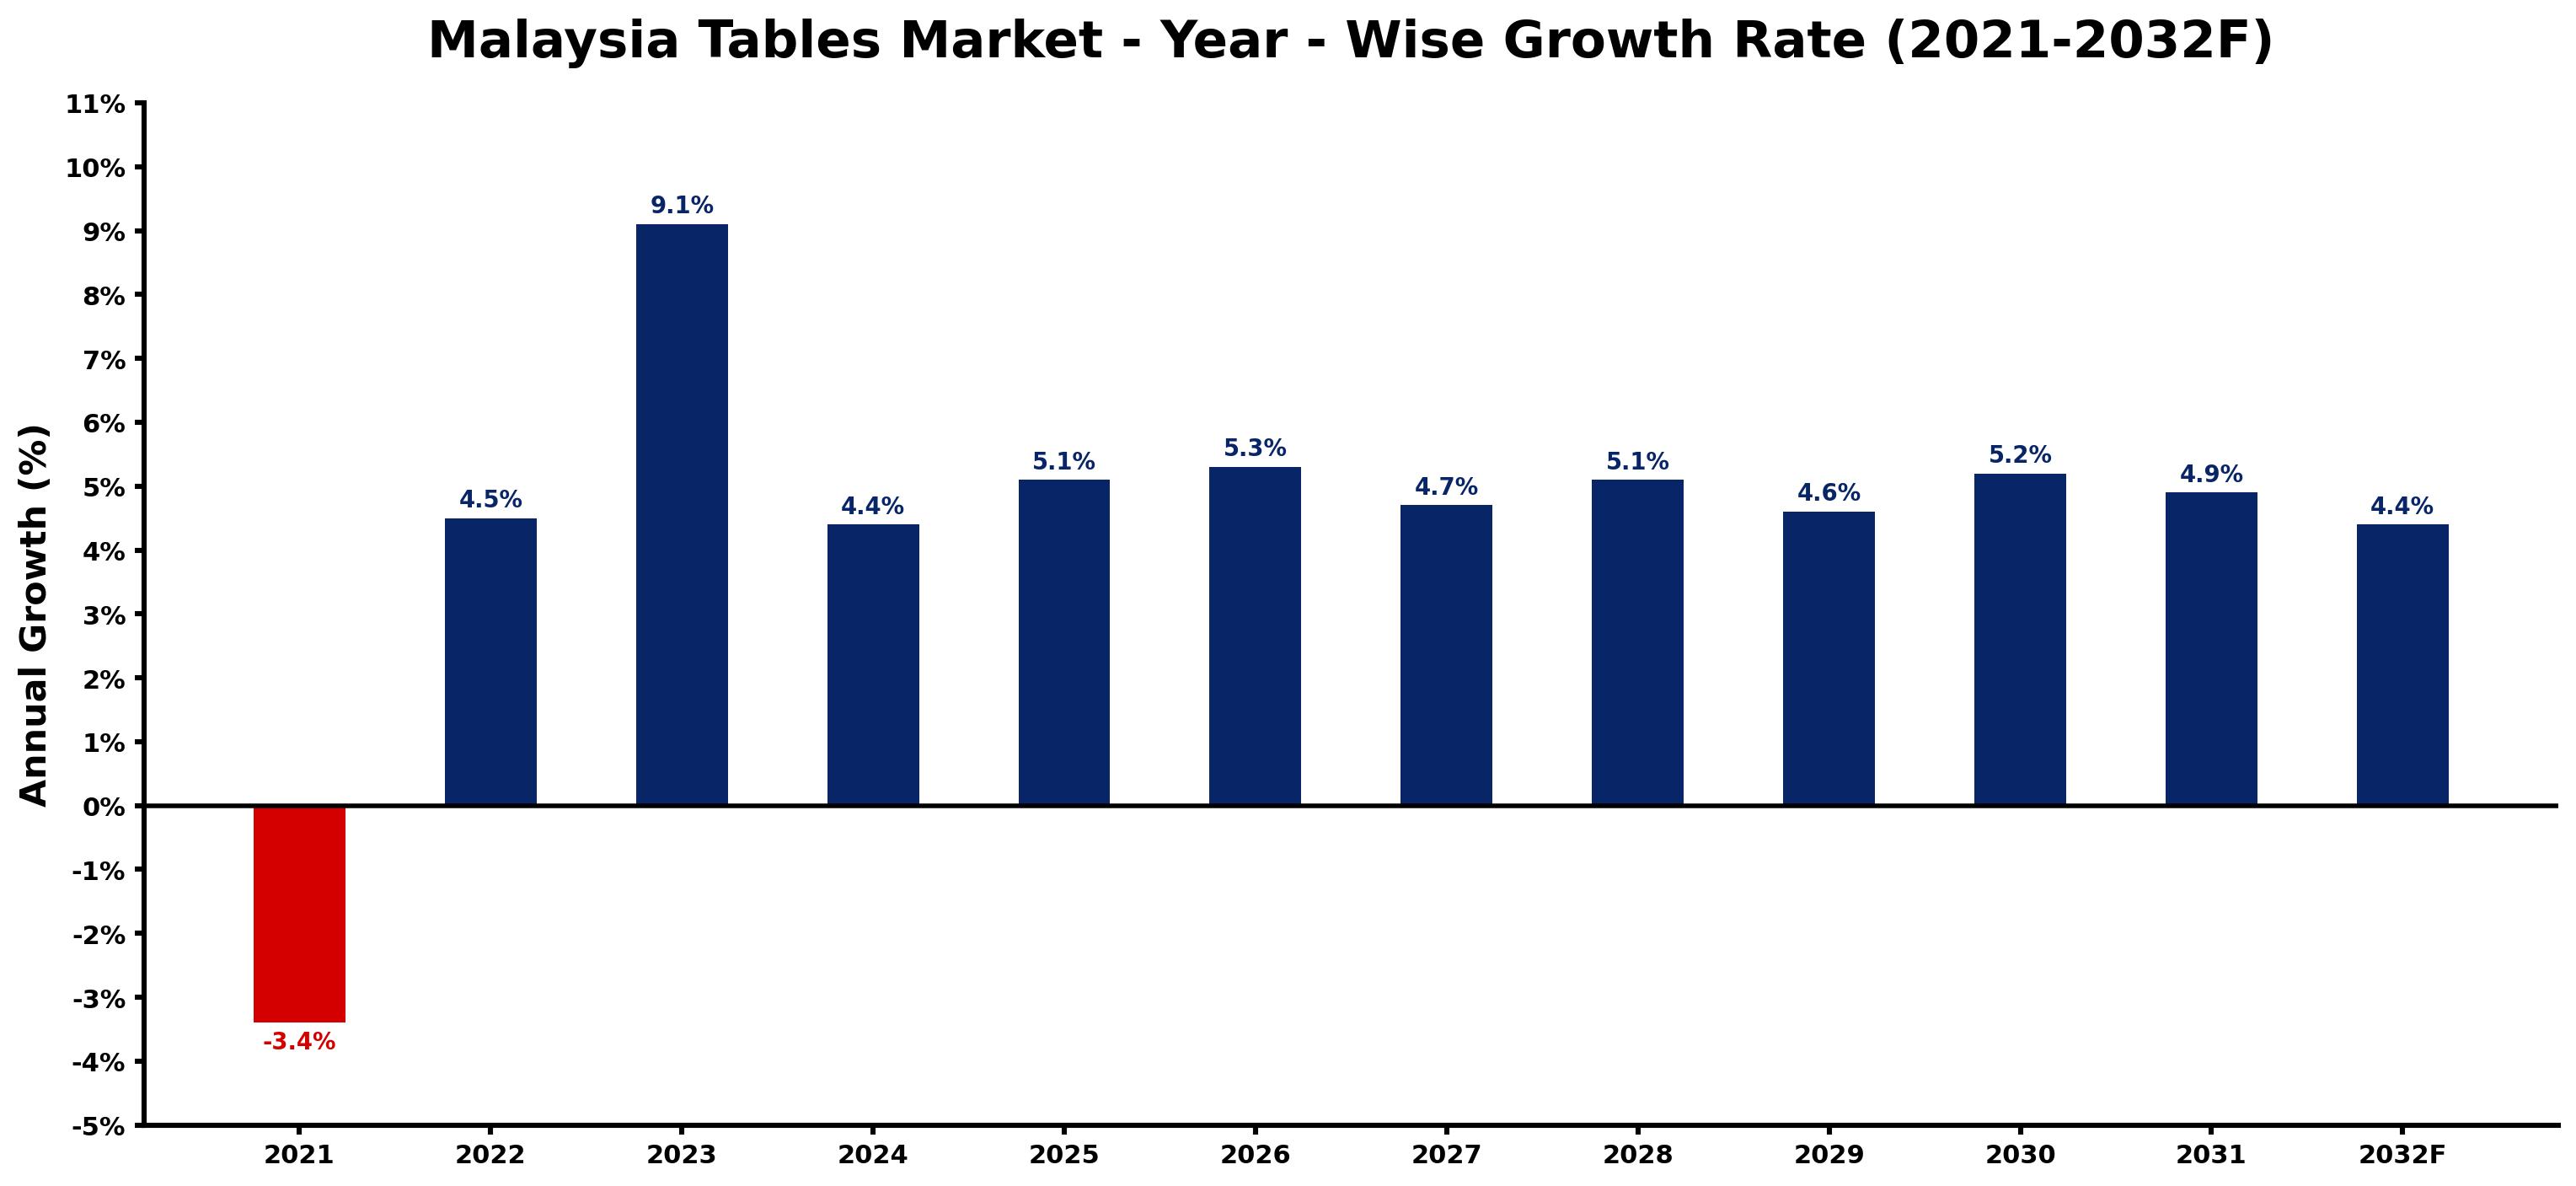
The table below presents the year wise growth rates along with the key drivers influencing the market
| Year | Growth Rate | Major Drivers |
| 2021 | -3.4% | Disruptions in supply chains due to pandemic restrictions limited available inventory and hindered sales growth. |
| 2022 | 4.5% | Local manufacturers began emphasizing sustainable materials to appeal to environmentally conscious buyers. |
| 2023 | 9.1% | Increased urbanization led to a notable demand for multifunctional and space-saving table designs. |
| 2024 | 4.4% | E-commerce platforms expanded significantly, facilitating easier access to diverse table options. |
| 2025 | 5.1% | Corporate office refurbishments prompted demand for modern office tables and collaborative spaces. |
| 2026 | 5.3% | Tourism recovery spurred hotel renovations, increasing orders for bespoke dining tables. |
| 2027 | 4.7% | Emerging trends in work-from-home arrangements highlighted the need for stylish home office tables. |
| 2028 | 5.1% | Cultural events and festivals drove demand for custom tables reflecting local craftsmanship. |
| 2029 | 4.6% | Innovations in manufacturing techniques reduced costs, enabling competitive pricing for quality tables. |
| 2030 | 5.2% | A shift towards minimalism influenced the design preferences of the younger consumer demographic. |
| 2031 | 4.9% | Sustainability certifications became essential, pushing brands to enhance eco-friendly product lines. |
| 2032 | 4.4% | Increased disposable income resulted in higher spending on premium and designer furniture. |
Note - Market size estimations and growth projections presented in this report are based on 6Wresearch's advanced forecasting approach, validated with industry datasets as of June 2026.
Malaysia Tables Market Synopsis
The Malaysia Tables Market is projected to reach 5.3% and witness significant growth during the forecast period (2026-2032). The market is anticipated to expand at a compound annual growth rate (CAGR) of 5.6%, driven by a confluence of factors that highlight the increasing demand for tables among diverse consumer segments. This growth trajectory is primarily influenced by the needs of households, educational institutions, healthcare facilities, as well as the hospitality sector, including hotels and restaurants.
Malaysia Tables Market Growth Drivers
The Malaysia Tables Market is propelled by several key growth drivers that underscore the evolving preferences of consumers and industry dynamics. The following factors are significant contributors to this market's expansion:
- An increasing trend toward premium home furnishings, as consumers invest in quality and innovation, enhances the desirability of various table types, from dining to office tables.
- The burgeoning hospitality sector, characterized by a rise in restaurant openings and hotel establishments, amplifies the demand for tables, directly impacting the market's growth.
- Growing disposable incomes among Malaysian consumers encourages expenditure on furniture, making stylish and functional tables more accessible and appealing.
- Innovative designs and materials introduced by manufacturers contribute to a diverse product offering that attracts consumers seeking aesthetics and functionality.
- The increased focus on environmentally friendly materials and sustainable production practices resonates with contemporary consumer values, further stimulating interest in table products.
Malaysia Tables Market Trends and Opportunities
With the Malaysia Tables Market gaining momentum, several trends and opportunities are shaping its future. Key developments include:
- A shift towards multifunctional furniture items, particularly in urban living spaces where maximizing utility is crucial, enabling tables to serve versatile roles.
- The emergence of e-commerce platforms facilitates convenient access to a wide range of table products, ensuring that consumers can explore various options from the comfort of their homes.
- Collaborations between designers and manufacturers lead to unique table designs that meet contemporary aesthetic requirements while addressing individual functional needs.
- Growing awareness of health and wellness promotes the demand for ergonomic table designs that enhance comfort and productivity in workspaces.
- Sustainable and eco-friendly materials are becoming a focal point for consumer purchasing decisions, leading to innovative production practices within the market.
Malaysia Tables Market Challenges and Restraints
While the Malaysia Tables Market shows promising growth potential, it is not without its challenges. Several factors may pose risks to market expansion:
- The presence of lower-cost alternatives comprising inferior materials can deter consumers from opting for higher-quality table products, affecting overall market sales.
- Economic fluctuations and shifts in consumer confidence may lead to reduced spending on furniture items, directly impacting demand for tables.
- Supply chain disruptions, often resulting from global events or regional issues, can lead to delays in product availability and increase costs for manufacturers.
- Changing consumer preferences, influenced by trends in minimalism and compact living, may affect the demand for traditional table designs.
- Regulatory challenges concerning material sourcing and environmental impacts may require manufacturers to adapt quickly, which could strain resources and innovation cycles.
Malaysia Tables Market Government Investment and Initiatives
The Malaysian government has initiated several policies aimed at enhancing the domestic furniture industry, including the tables market. Investments in infrastructure development and incentives for sustainable manufacturing practices are crucial for supporting local producers. Additionally, programs encouraging exports of Malaysian furniture products and fostering technological innovation are shaping a favorable environment for market players. Public spending in urban development and education also creates a demand for diverse furniture solutions, including tables in schools and public spaces.
Malaysia Tables Market Latest Developments (May 2025 - June 2026)
Recent developments in the Malaysia Tables Market from May 2025 to June 2026 suggest a dynamic industry landscape. Companies have begun to emphasize the launch of innovative table designs, catering to the diverse needs of consumers while aligning with contemporary trends. Collaborations between furniture manufacturers and local designers have emerged, resulting in unique product offerings that appeal to a broader demographic. Moreover, an increasing number of retailers are adopting e-commerce as a primary sales channel, enhancing market accessibility and convenience for consumers. The focus on sustainability persists, with manufacturers actively seeking eco-friendly materials to attract environmentally conscious consumers.
Malaysia Tables Market - Key Attractiveness of the Report
- 10 Years of Market Numbers
- Historical Data Starting from 2022 to 2025
- Base Year: 2025
- Forecast Data until 2032
- Key Performance Indicators Impacting the Market
- Major Upcoming Developments and Projects
Key Highlights of the Report:
- Malaysia Tables Market Outlook
- Market Size of Malaysia Tables Market, 2025
- Forecast of Malaysia Tables Market, 2032F
- Historical Data and Forecast of Malaysia Tables Revenues & Volume for the Period 2022-2032F
- Malaysia Tables Market Trend Evolution
- Malaysia Tables Market Drivers and Challenges
- Malaysia Tables Price Trends
- Malaysia Tables Porter's Five Forces
- Malaysia Tables Industry Life Cycle
- Historical Data and Forecast of Malaysia Tables Market Revenues & Volume By Types for the Period 2022-2032F
- Historical Data and Forecast of Malaysia Tables Market Revenues & Volume By Fabric for the Period 2022-2032F
- Historical Data and Forecast of Malaysia Tables Market Revenues & Volume By Leather for the Period 2022-2032F
- Historical Data and Forecast of Malaysia Tables Market Revenues & Volume By Metal for the Period 2022-2032F
- Historical Data and Forecast of Malaysia Tables Market Revenues & Volume By Wooden for the Period 2022-2032F
- Historical Data and Forecast of Malaysia Tables Market Revenues & Volume By Others for the Period 2022-2032F
- Historical Data and Forecast of Malaysia Tables Market Revenues & Volume By Applications for the Period 2022-2032F
- Historical Data and Forecast of Malaysia Tables Market Revenues & Volume By Family for the Period 2022-2032F
- Historical Data and Forecast of Malaysia Tables Market Revenues & Volume By Office for the Period 2022-2032F
- Historical Data and Forecast of Malaysia Tables Market Revenues & Volume By Others for the Period 2022-2032F
- Malaysia Tables Import Export Trade Statistics
- Market Opportunity Assessment By Types
- Market Opportunity Assessment By Applications
- Malaysia Tables Top Companies Market Share
- Malaysia Tables Competitive Benchmarking By Technical and Operational Parameters
- Malaysia Tables Company Profiles
- Malaysia Tables Key Strategic Recommendations
Frequently Asked Questions About the Market Study (FAQs):
The growth is primarily driven by increasing demand from various sectors, rising disposable incomes, and the expansion of the hospitality industry.
Manufacturers are introducing innovative designs, focusing on sustainability, and expanding their product lines to meet evolving consumer preferences.
Challenges include competition from cheaper alternatives, economic fluctuations, and supply chain issues that could impact production and availability.
The government supports the industry through various investments, infrastructure development, and initiatives aimed at promoting sustainable practices and enhancing export capabilities.
6Wresearch actively monitors the Malaysia Tables Market and publishes its comprehensive annual report, highlighting emerging trends, growth drivers, revenue analysis, and forecast outlook. Our insights help businesses to make data-backed strategic decisions with ongoing market dynamics. Our analysts track relevent industries related to the Malaysia Tables Market, allowing our clients with actionable intelligence and reliable forecasts tailored to emerging regional needs.
Yes, we provide customisation as per your requirements. To learn more, feel free to contact us on sales@6wresearch.com
1 Executive Summary |
2 Introduction |
2.1 Key Highlights of the Report |
2.2 Report Description |
2.3 Market Scope & Segmentation |
2.4 Research Methodology |
2.5 Assumptions |
3 Malaysia Tables Market Overview |
3.1 Malaysia Country Macro Economic Indicators |
3.2 Malaysia Tables Market Revenues & Volume, 2022 & 2032F |
3.3 Malaysia Tables Market - Industry Life Cycle |
3.4 Malaysia Tables Market - Porter's Five Forces |
3.5 Malaysia Tables Market Revenues & Volume Share, By Types, 2022 & 2032F |
3.6 Malaysia Tables Market Revenues & Volume Share, By Applications, 2022 & 2032F |
4 Malaysia Tables Market Dynamics |
4.1 Impact Analysis |
4.2 Market Drivers |
4.3 Market Restraints |
5 Malaysia Tables Market Trends |
6 Malaysia Tables Market, By Types |
6.1 Malaysia Tables Market, By Types |
6.1.1 Overview and Analysis |
6.1.2 Malaysia Tables Market Revenues & Volume, By Types, 2022-2032F |
6.1.3 Malaysia Tables Market Revenues & Volume, By Fabric, 2022-2032F |
6.1.4 Malaysia Tables Market Revenues & Volume, By Leather, 2022-2032F |
6.1.5 Malaysia Tables Market Revenues & Volume, By Metal, 2022-2032F |
6.1.6 Malaysia Tables Market Revenues & Volume, By Wooden, 2022-2032F |
6.1.7 Malaysia Tables Market Revenues & Volume, By Others, 2022-2032F |
6.2 Malaysia Tables Market, By Applications |
6.2.1 Overview and Analysis |
6.2.2 Malaysia Tables Market Revenues & Volume, By Family, 2022-2032F |
6.2.3 Malaysia Tables Market Revenues & Volume, By Office, 2022-2032F |
6.2.4 Malaysia Tables Market Revenues & Volume, By Others, 2022-2032F |
7 Malaysia Tables Market Import-Export Trade Statistics |
7.1 Malaysia Tables Market Export to Major Countries |
7.2 Malaysia Tables Market Imports from Major Countries |
8 Malaysia Tables Market Key Performance Indicators |
9 Malaysia Tables Market - Opportunity Assessment |
9.1 Malaysia Tables Market Opportunity Assessment, By Types, 2022 & 2032F |
9.2 Malaysia Tables Market Opportunity Assessment, By Applications, 2022 & 2032F |
10 Malaysia Tables Market - Competitive Landscape |
10.1 Malaysia Tables Market Revenue Share, By Companies, 2025 |
10.2 Malaysia Tables Market Competitive Benchmarking, By Operating and Technical Parameters |
11 Company Profiles |
12 Recommendations |
13 Disclaimer |
Global Go To Market Strategy - 2030
Export potential enables firms to identify high-growth global markets with greater confidence by combining advanced trade intelligence with a structured quantitative methodology. The framework analyzes emerging demand trends and country-level import patterns while integrating macroeconomic and trade datasets such as GDP and population forecasts, bilateral import–export flows, tariff structures, elasticity differentials between developed and developing economies, geographic distance, and import demand projections. Using weighted trade values from 2020–2024 as the base period to project country-to-country export potential for 2030, these inputs are operationalized through calculated drivers such as gravity model parameters, tariff impact factors, and projected GDP per-capita growth. Through an analysis of hidden potentials, demand hotspots, and market conditions that are most favorable to success, this method enables firms to focus on target countries, maximize returns, and global expansion with data, backed by accuracy.
By factoring in the projected importer demand gap that is currently unmet and could be potential opportunity, it identifies the potential for the Exporter (Country) among 190 countries, against the general trade analysis, which identifies the biggest importer or exporter.
To discover high-growth global markets and optimize your business strategy:
Click Here
Pricing
- Single User License$ 1,995
- Department License$ 2,400
- Site License$ 3,120
- Global License$ 3,795

Leadership Perspectives from Industry Events
Search
Thought Leadership and Analyst Meet


Our Clients
6WResearch In News
- India Air Conditioner Market Set for Strong Rebound in 2026 After Weather-Led Correction and GST-Driven Recovery: 6Wresearch
- ADAS in India: How Automatic Emergency Braking, Blind Spot Detection & Driver Monitoring are Transforming Road Safety
- Doha a strategic location for EV manufacturing hub: IPA Qatar
- Demand for luxury TVs surging in the GCC, says Samsung
- Empowering Growth: The Thriving Journey of Bangladesh’s Cable Industry
- Demand for luxury TVs surging in the GCC, says Samsung
Latest Reports
- Nicaragua RPG Gaming Market (2026-2032)
- New Zealand RPG Gaming Market (2026-2032)
- Netherlands RPG Gaming Market (2026-2032)
- Nauru RPG Gaming Market (2026-2032)
- Namibia RPG Gaming Market (2026-2032)
- Mozambique RPG Gaming Market (2026-2032)
- Montenegro RPG Gaming Market (2026-2032)
- Mongolia RPG Gaming Market (2026-2032)
- Monaco RPG Gaming Market (2026-2032)
- Micronesia RPG Gaming Market (2026-2032)
Industry Events and Analyst Meet

HIMTEX 2026

India Refining Summit 2026

India EV Show 2026

EV tech India Expo 2026

Auto Tech Asia 2026
Whitepaper
- Middle East & Africa Commercial Security Market Click here to view more.
- Middle East & Africa Fire Safety Systems & Equipment Market Click here to view more.
- GCC Drone Market Click here to view more.
- Middle East Lighting Fixture Market Click here to view more.
- GCC Physical & Perimeter Security Market Click here to view more.