Malta Automotive Crash Barriers Market (2026-2032) | Analysis, Restraints, Strategic Insights, Competitive, Strategy, Value, Growth, Segments, Share, Outlook, Investment Trends, Size, Competition, Segmentation, Industry, Revenue, Consumer Insights, Trends, Companies, Demand, Drivers, Supply, Forecast, Challenges, Opportunities, Pricing Analysis
Market Forecast By Type (Rigid Barriers, Semi-Rigid Barriers, Flexible Barriers, Smart Barriers), By Material (Concrete, Steel, Plastic Composites, IoT-Enabled Materials), By Application (Highways, Urban Roads, Race Tracks, Autonomous Zones) And Competitive Landscape
| Product Code: ETC10856256 | Publication Date: Apr 2025 | Updated Date: Apr 2026 | Product Type: Market Research Report | |
| Publisher: 6Wresearch | Author: Bhawna Singh | No. of Pages: 65 | No. of Figures: 34 | No. of Tables: 19 |
Malta Automotive Crash Barriers Market Size (2020-2030)
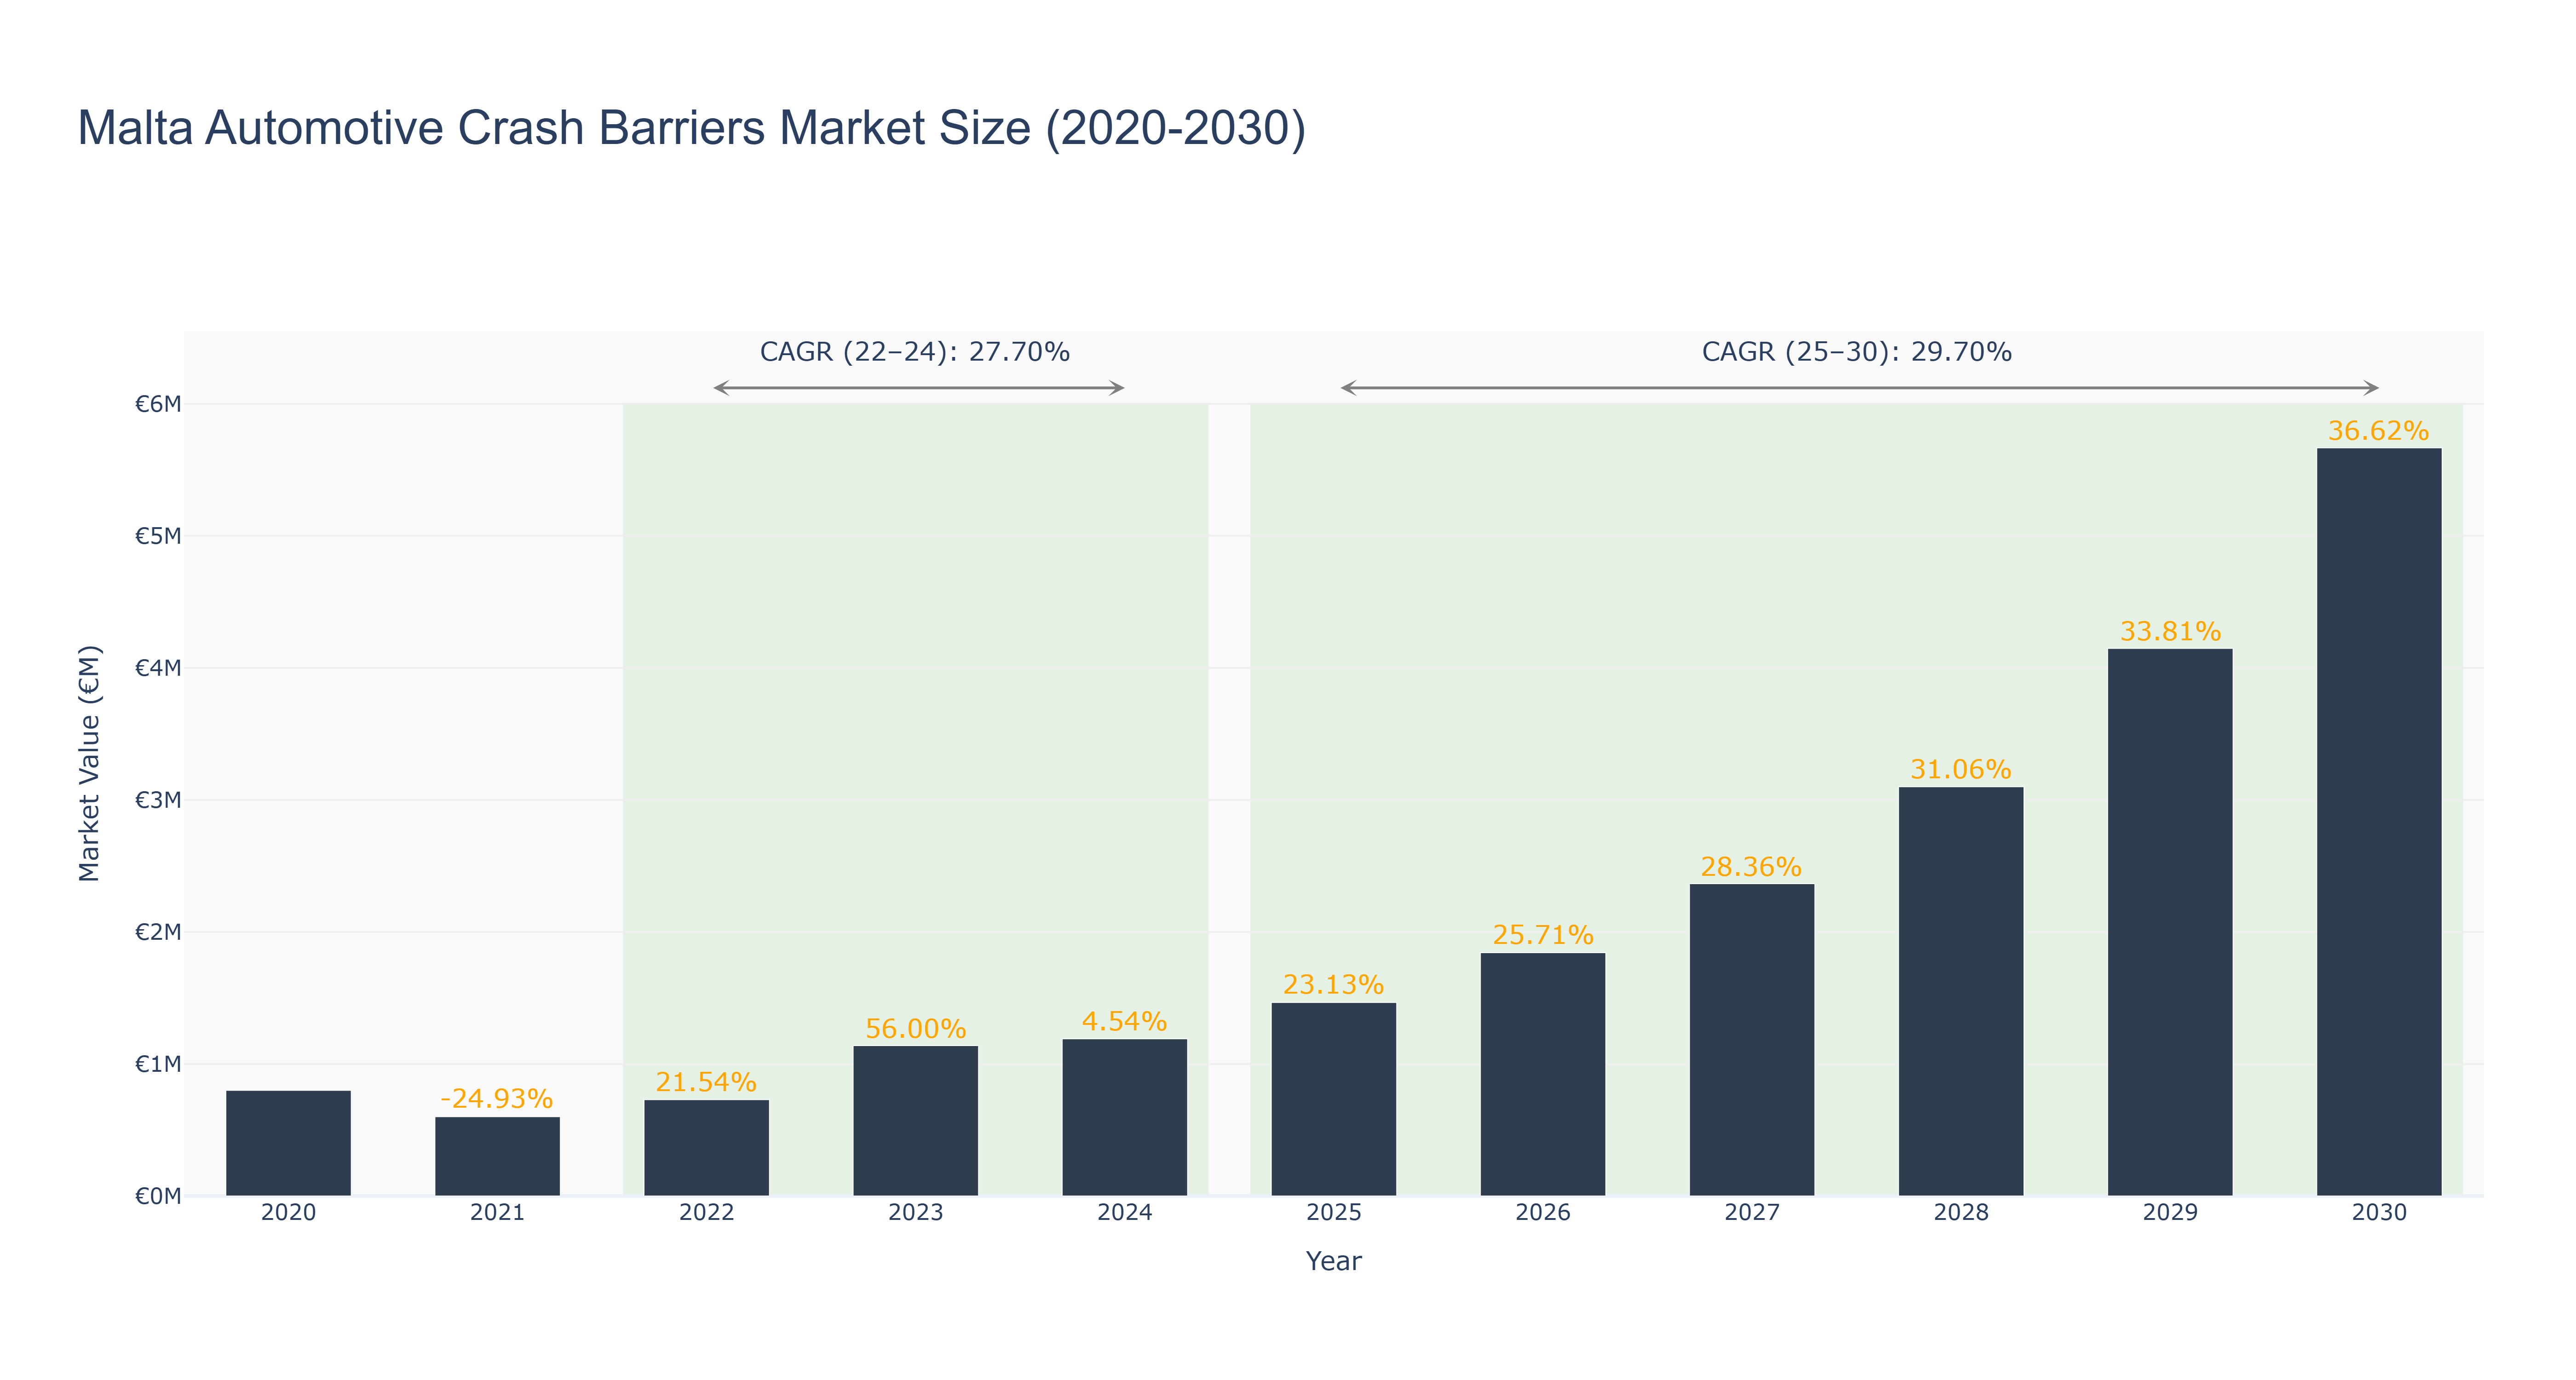
The Malta Automotive Crash Barriers Market has demonstrated significant volatility in recent years, with a peak market size of €1.14 million in 2023, following a recovery from a decline to €600.61 thousand in 2021. The actual market sizes from 2022 to 2024 illustrate a robust growth trajectory, featuring a CAGR of 27.70%, driven by increasing infrastructure investments and heightened safety regulations. Looking ahead, the forecasted period from 2025 to 2030 anticipates continued expansion, with projected market sizes reaching €5.67 million by 2030 and a CAGR of 29.70%. This growth will likely be fueled by ongoing urban development projects and a growing emphasis on road safety measures, which are critical as Malta addresses its transportation infrastructure challenges. The market's resilience highlights the industry's adaptive capabilities amid fluctuating economic conditions, positioning it for promising advancements in the coming years.
Malta Automotive Crash Barriers Market: Production & Trade Performance (2019-2025)
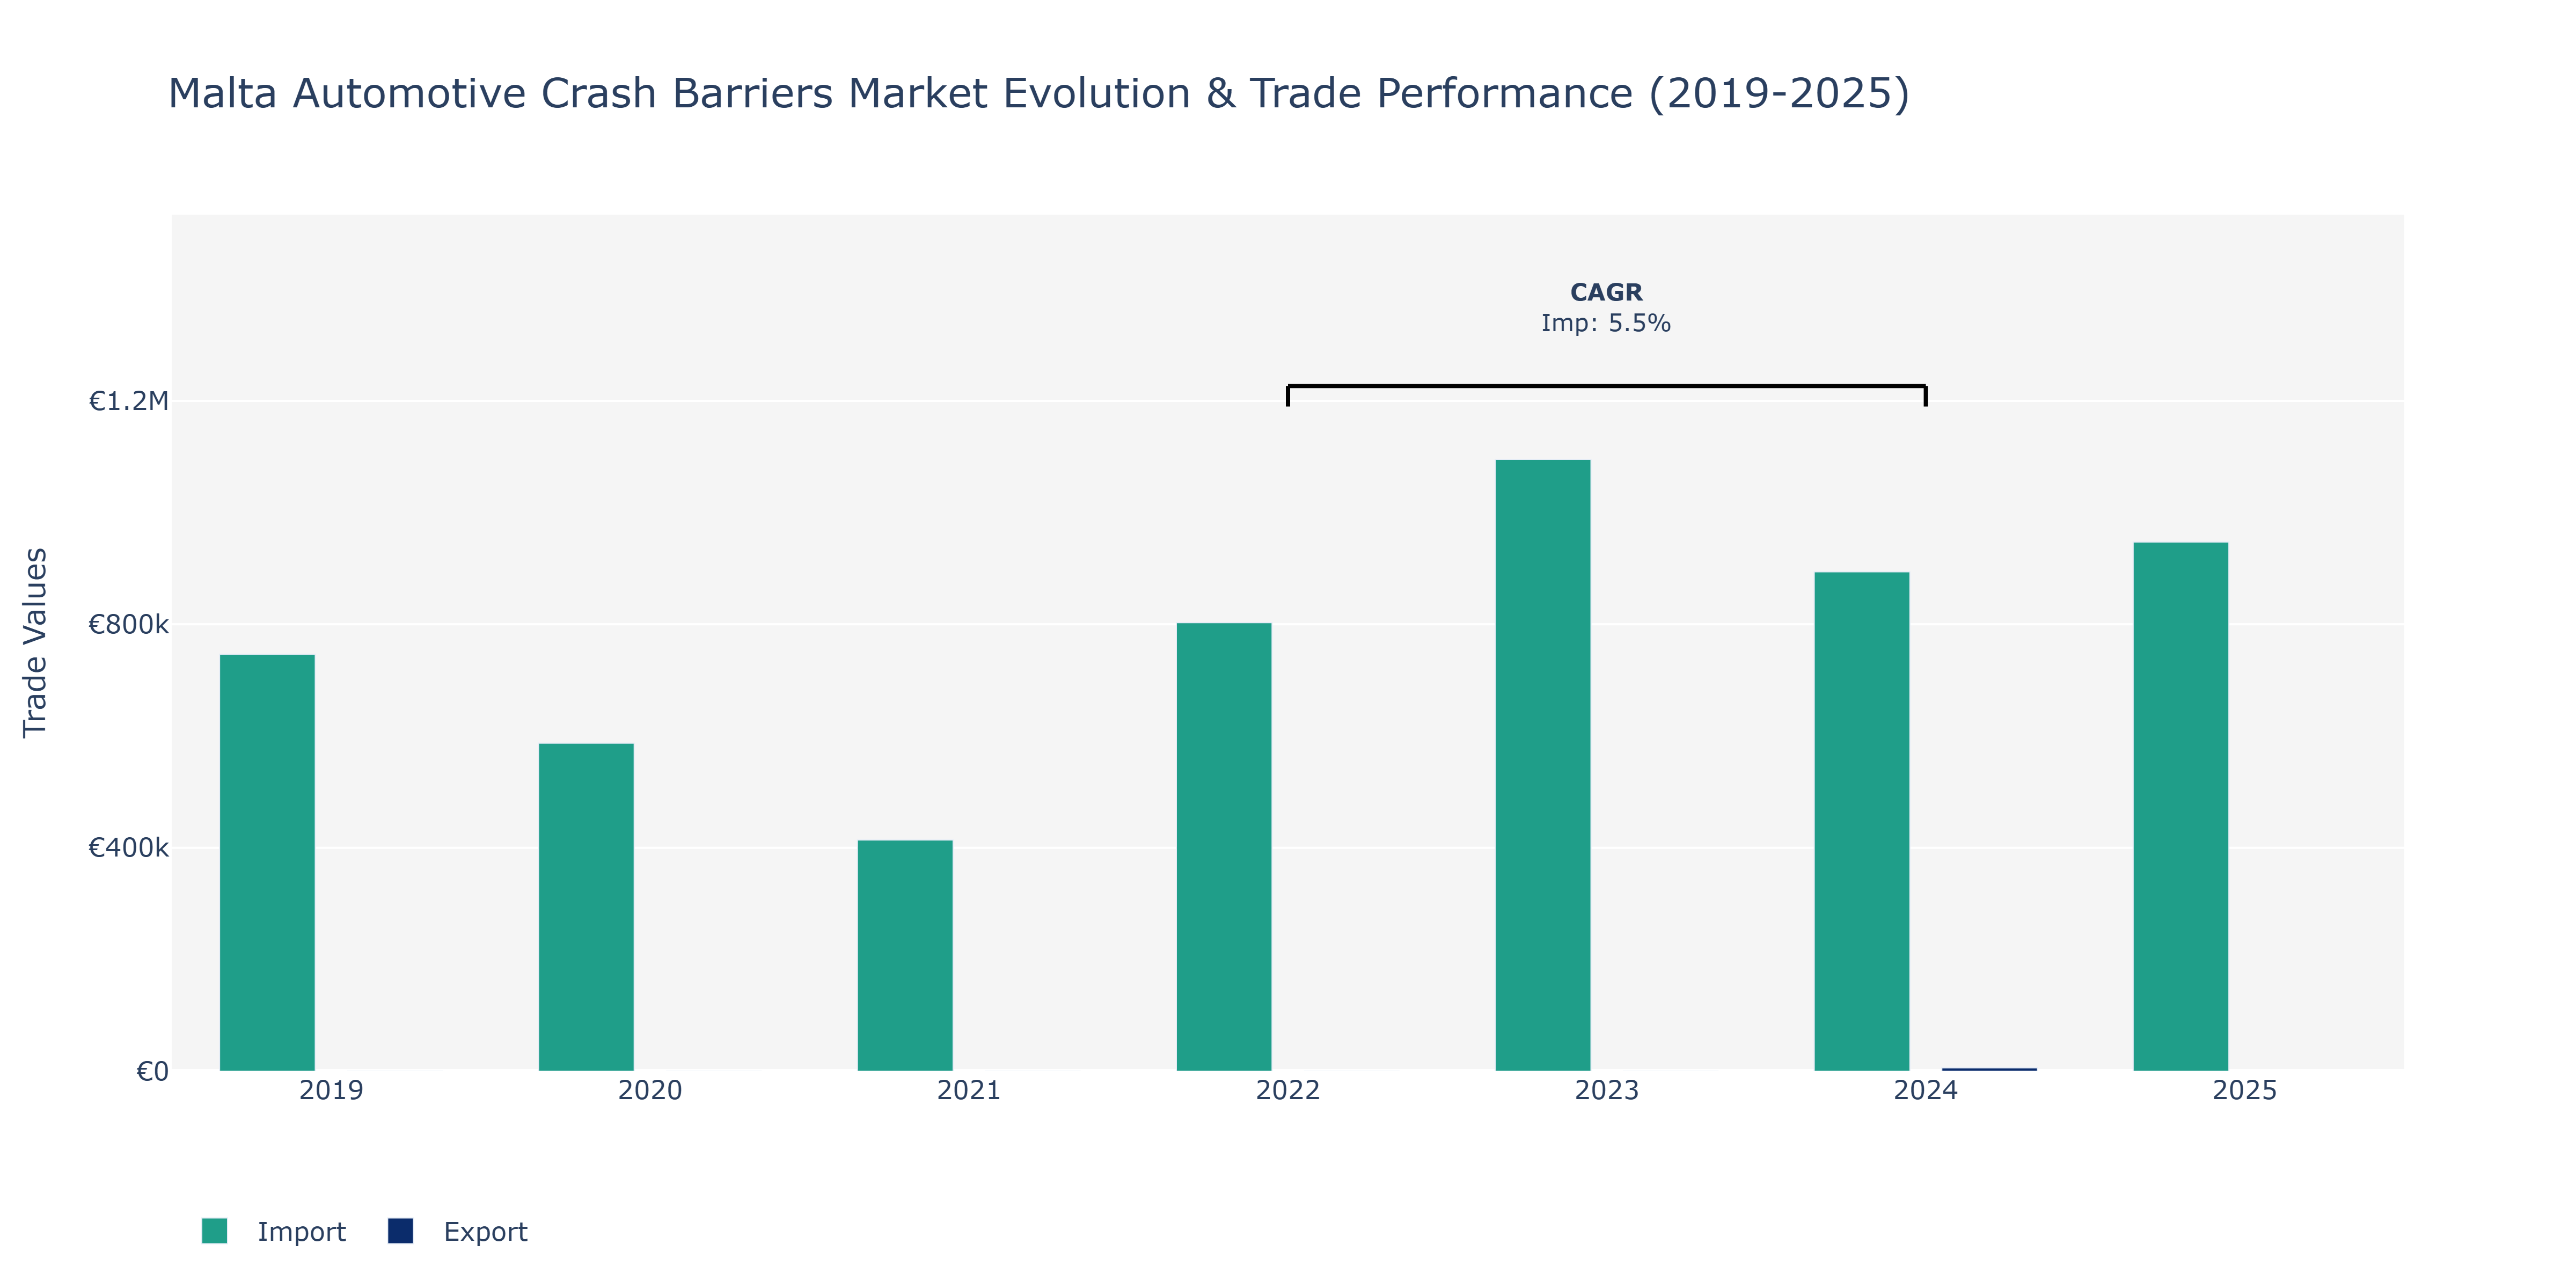
In the Malta Automotive Crash Barriers Market, Imports displayed fluctuations over the years, with a noticeable peak in 2023 at €1.1 million, following a decline in 2021 to €413.88 thousand. The year 2020 witnessed a decrease in imports to €587.14 thousand, which was further surpassed in 2022 and 2025. Notably, a substantial increase in imports was observed from 2019 to 2022, with a 5.52% CAGR during this period. The significant rise in 2022 could be attributed to infrastructure development projects requiring automotive crash barriers, aligning with Malta's focus on enhancing road safety measures and bolstering transportation networks. The surge in imports in 2023 and 2024 may be linked to increased construction activities, driven by infrastructure investments aimed at supporting economic growth and modernization efforts in Malta. This trend underscores the market's responsiveness to local development initiatives and regulatory mandates.
Key Highlights of the Report:
- Malta Automotive Crash Barriers Market Outlook
- Market Size of Malta Automotive Crash Barriers Market, 2025
- Forecast of Malta Automotive Crash Barriers Market, 2032
- Historical Data and Forecast of Malta Automotive Crash Barriers Revenues & Volume for the Period 2022 - 2032F
- Malta Automotive Crash Barriers Market Trend Evolution
- Malta Automotive Crash Barriers Market Drivers and Challenges
- Malta Automotive Crash Barriers Price Trends
- Malta Automotive Crash Barriers Porter's Five Forces
- Malta Automotive Crash Barriers Industry Life Cycle
- Historical Data and Forecast of Malta Automotive Crash Barriers Market Revenues & Volume By Type for the Period 2022 - 2032F
- Historical Data and Forecast of Malta Automotive Crash Barriers Market Revenues & Volume By Rigid Barriers for the Period 2022 - 2032F
- Historical Data and Forecast of Malta Automotive Crash Barriers Market Revenues & Volume By Semi-Rigid Barriers for the Period 2022 - 2032F
- Historical Data and Forecast of Malta Automotive Crash Barriers Market Revenues & Volume By Flexible Barriers for the Period 2022 - 2032F
- Historical Data and Forecast of Malta Automotive Crash Barriers Market Revenues & Volume By Smart Barriers for the Period 2022 - 2032F
- Historical Data and Forecast of Malta Automotive Crash Barriers Market Revenues & Volume By Material for the Period 2022 - 2032F
- Historical Data and Forecast of Malta Automotive Crash Barriers Market Revenues & Volume By Concrete for the Period 2022 - 2032F
- Historical Data and Forecast of Malta Automotive Crash Barriers Market Revenues & Volume By Steel for the Period 2022 - 2032F
- Historical Data and Forecast of Malta Automotive Crash Barriers Market Revenues & Volume By Plastic Composites for the Period 2022 - 2032F
- Historical Data and Forecast of Malta Automotive Crash Barriers Market Revenues & Volume By IoT-Enabled Materials for the Period 2022 - 2032F
- Historical Data and Forecast of Malta Automotive Crash Barriers Market Revenues & Volume By Application for the Period 2022 - 2032F
- Historical Data and Forecast of Malta Automotive Crash Barriers Market Revenues & Volume By Highways for the Period 2022 - 2032F
- Historical Data and Forecast of Malta Automotive Crash Barriers Market Revenues & Volume By Urban Roads for the Period 2022 - 2032F
- Historical Data and Forecast of Malta Automotive Crash Barriers Market Revenues & Volume By Race Tracks for the Period 2022 - 2032F
- Historical Data and Forecast of Malta Automotive Crash Barriers Market Revenues & Volume By Autonomous Zones for the Period 2022 - 2032F
- Malta Automotive Crash Barriers Import Export Trade Statistics
- Market Opportunity Assessment By Type
- Market Opportunity Assessment By Material
- Market Opportunity Assessment By Application
- Malta Automotive Crash Barriers Top Companies Market Share
- Malta Automotive Crash Barriers Competitive Benchmarking By Technical and Operational Parameters
- Malta Automotive Crash Barriers Company Profiles
- Malta Automotive Crash Barriers Key Strategic Recommendations
Frequently Asked Questions About the Market Study (FAQs):
6Wresearch actively monitors the Malta Automotive Crash Barriers Market and publishes its comprehensive annual report, highlighting emerging trends, growth drivers, revenue analysis, and forecast outlook. Our insights help businesses to make data-backed strategic decisions with ongoing market dynamics. Our analysts track relevent industries related to the Malta Automotive Crash Barriers Market, allowing our clients with actionable intelligence and reliable forecasts tailored to emerging regional needs.
Yes, we provide customisation as per your requirements. To learn more, feel free to contact us on sales@6wresearch.com
1 Executive Summary |
2 Introduction |
2.1 Key Highlights of the Report |
2.2 Report Description |
2.3 Market Scope & Segmentation |
2.4 Research Methodology |
2.5 Assumptions |
3 Malta Automotive Crash Barriers Market Overview |
3.1 Malta Country Macro Economic Indicators |
3.2 Malta Automotive Crash Barriers Market Revenues & Volume, 2022 & 2032F |
3.3 Malta Automotive Crash Barriers Market - Industry Life Cycle |
3.4 Malta Automotive Crash Barriers Market - Porter's Five Forces |
3.5 Malta Automotive Crash Barriers Market Revenues & Volume Share, By Type, 2022 & 2032F |
3.6 Malta Automotive Crash Barriers Market Revenues & Volume Share, By Material, 2022 & 2032F |
3.7 Malta Automotive Crash Barriers Market Revenues & Volume Share, By Application, 2022 & 2032F |
4 Malta Automotive Crash Barriers Market Dynamics |
4.1 Impact Analysis |
4.2 Market Drivers |
4.3 Market Restraints |
5 Malta Automotive Crash Barriers Market Trends |
6 Malta Automotive Crash Barriers Market, By Types |
6.1 Malta Automotive Crash Barriers Market, By Type |
6.1.1 Overview and Analysis |
6.1.2 Malta Automotive Crash Barriers Market Revenues & Volume, By Type, 2022 - 2032F |
6.1.3 Malta Automotive Crash Barriers Market Revenues & Volume, By Rigid Barriers, 2022 - 2032F |
6.1.4 Malta Automotive Crash Barriers Market Revenues & Volume, By Semi-Rigid Barriers, 2022 - 2032F |
6.1.5 Malta Automotive Crash Barriers Market Revenues & Volume, By Flexible Barriers, 2022 - 2032F |
6.1.6 Malta Automotive Crash Barriers Market Revenues & Volume, By Smart Barriers, 2022 - 2032F |
6.2 Malta Automotive Crash Barriers Market, By Material |
6.2.1 Overview and Analysis |
6.2.2 Malta Automotive Crash Barriers Market Revenues & Volume, By Concrete, 2022 - 2032F |
6.2.3 Malta Automotive Crash Barriers Market Revenues & Volume, By Steel, 2022 - 2032F |
6.2.4 Malta Automotive Crash Barriers Market Revenues & Volume, By Plastic Composites, 2022 - 2032F |
6.2.5 Malta Automotive Crash Barriers Market Revenues & Volume, By IoT-Enabled Materials, 2022 - 2032F |
6.3 Malta Automotive Crash Barriers Market, By Application |
6.3.1 Overview and Analysis |
6.3.2 Malta Automotive Crash Barriers Market Revenues & Volume, By Highways, 2022 - 2032F |
6.3.3 Malta Automotive Crash Barriers Market Revenues & Volume, By Urban Roads, 2022 - 2032F |
6.3.4 Malta Automotive Crash Barriers Market Revenues & Volume, By Race Tracks, 2022 - 2032F |
6.3.5 Malta Automotive Crash Barriers Market Revenues & Volume, By Autonomous Zones, 2022 - 2032F |
7 Malta Automotive Crash Barriers Market Import-Export Trade Statistics |
7.1 Malta Automotive Crash Barriers Market Export to Major Countries |
7.2 Malta Automotive Crash Barriers Market Imports from Major Countries |
8 Malta Automotive Crash Barriers Market Key Performance Indicators |
9 Malta Automotive Crash Barriers Market - Opportunity Assessment |
9.1 Malta Automotive Crash Barriers Market Opportunity Assessment, By Type, 2022 & 2032F |
9.2 Malta Automotive Crash Barriers Market Opportunity Assessment, By Material, 2022 & 2032F |
9.3 Malta Automotive Crash Barriers Market Opportunity Assessment, By Application, 2022 & 2032F |
10 Malta Automotive Crash Barriers Market - Competitive Landscape |
10.1 Malta Automotive Crash Barriers Market Revenue Share, By Companies, 2025 |
10.2 Malta Automotive Crash Barriers Market Competitive Benchmarking, By Operating and Technical Parameters |
11 Company Profiles |
12 Recommendations |
13 Disclaimer |
Export potential assessment - trade Analytics for 2030
Export potential enables firms to identify high-growth global markets with greater confidence by combining advanced trade intelligence with a structured quantitative methodology. The framework analyzes emerging demand trends and country-level import patterns while integrating macroeconomic and trade datasets such as GDP and population forecasts, bilateral import–export flows, tariff structures, elasticity differentials between developed and developing economies, geographic distance, and import demand projections. Using weighted trade values from 2020–2024 as the base period to project country-to-country export potential for 2030, these inputs are operationalized through calculated drivers such as gravity model parameters, tariff impact factors, and projected GDP per-capita growth. Through an analysis of hidden potentials, demand hotspots, and market conditions that are most favorable to success, this method enables firms to focus on target countries, maximize returns, and global expansion with data, backed by accuracy.
By factoring in the projected importer demand gap that is currently unmet and could be potential opportunity, it identifies the potential for the Exporter (Country) among 190 countries, against the general trade analysis, which identifies the biggest importer or exporter.
To discover high-growth global markets and optimize your business strategy:
Click Here
Pricing
- Single User License$ 1,995
- Department License$ 2,400
- Site License$ 3,120
- Global License$ 3,795

Search
Thought Leadership and Analyst Meet


Our Clients
Latest Reports
- France Thermally Conductive Filler Dispersants Market (2026-2032) | Challenges, Restraints, Value, Share, Size, segmentation, Analysis, Trends, Investment Opportunities, Outlook, Pricing, Demand, Forecast, Revenue, Companies, Growth, Drivers, Strategy, Insights, Competition
- Egypt Thermally Conductive Filler Dispersants Market (2026-2032) | Competition, Forecast, Strategy, Value, Insights, Outlook, Investment Opportunities, Pricing, Demand, Share, segmentation, Drivers, Size, Companies, Restraints, Growth, Trends, Revenue, Challenges, Analysis
- Czech Republic Thermally Conductive Filler Dispersants Market (2026-2032) | Forecast, Pricing, Analysis, Drivers, Insights, Size, Demand, Growth, Challenges, segmentation, Competition, Outlook, Trends, Investment Opportunities, Companies, Strategy, Revenue, Share, Value, Restraints
- Colombia Thermally Conductive Filler Dispersants Market (2026-2032) | segmentation, Trends, Share, Drivers, Strategy, Companies, Demand, Insights, Size, Challenges, Value, Competition, Analysis, Growth, Revenue, Restraints, Forecast, Pricing, Outlook, Investment Opportunities
- China Thermally Conductive Filler Dispersants Market (2026-2032) | Restraints, Investment Opportunities, Pricing, Companies, Share, Size, Challenges, Trends, Outlook, Value, Analysis, Competition, Revenue, Drivers, Forecast, Demand, Insights, Growth, Strategy, segmentation
- Chile Thermally Conductive Filler Dispersants Market (2026-2032) | Investment Opportunities, Trends, Value, Restraints, Share, Companies, Forecast, segmentation, Pricing, Challenges, Demand, Size, Analysis, Drivers, Outlook, Growth, Competition, Strategy, Revenue, Insights
- Cambodia Thermally Conductive Filler Dispersants Market (2026-2032) | Analysis, Share, Outlook, Strategy, Pricing, Demand, Size, Growth, segmentation, Insights, Revenue, Forecast, Challenges, Competition, Companies, Investment Opportunities, Trends, Restraints, Value, Drivers
- Brazil Thermally Conductive Filler Dispersants Market (2026-2032) | Restraints, Forecast, Competition, Size, Revenue, Value, Investment Opportunities, Trends, Insights, Outlook, Growth, Analysis, Drivers, segmentation, Pricing, Challenges, Strategy, Share, Companies, Demand
- Bangladesh Thermally Conductive Filler Dispersants Market (2026-2032) | Restraints, Trends, Analysis, Competition, Insights, Forecast, Value, Investment Opportunities, Pricing, Share, Demand, Outlook, Revenue, segmentation, Companies, Drivers, Growth, Size, Challenges, Strategy
- Bahrain Thermally Conductive Filler Dispersants Market (2026-2032) | Trends, Outlook, Pricing, Demand, Value, Competition, Forecast, Growth, segmentation, Revenue, Companies, Analysis, Insights, Size, Drivers, Challenges, Strategy, Investment Opportunities, Share, Restraints
Industry Events and Analyst Meet

HIMTEX 2026

India Refining Summit 2026

India EV Show 2026

EV tech India Expo 2026

Auto Tech Asia 2026
Whitepaper
- Middle East & Africa Commercial Security Market Click here to view more.
- Middle East & Africa Fire Safety Systems & Equipment Market Click here to view more.
- GCC Drone Market Click here to view more.
- Middle East Lighting Fixture Market Click here to view more.
- GCC Physical & Perimeter Security Market Click here to view more.
6WResearch In News
- Doha a strategic location for EV manufacturing hub: IPA Qatar
- Demand for luxury TVs surging in the GCC, says Samsung
- Empowering Growth: The Thriving Journey of Bangladesh’s Cable Industry
- Demand for luxury TVs surging in the GCC, says Samsung
- Video call with a traditional healer? Once unthinkable, it’s now common in South Africa
- Intelligent Buildings To Smooth GCC’s Path To Net Zero