Malta Bio Plasticizer Market (2026-2032) | Industry, Growth, Analysis, Trends, Size, Segmentation, Companies, Value, Share, Revenue, Outlook & Forecast
Market Forecast By Type (Sebacates, Succinic Acid, Citrates, Glycerol Esters, Others, Epoxides), By Application (Flooring and Walls, Film and Sheet Coverings, Wires and Cables, Coated Fabrics, Consumer Goods, Others) And Competitive Landscape
| Product Code: ETC5667309 | Publication Date: Nov 2023 | Updated Date: Apr 2026 | Product Type: Market Research Report | |
| Publisher: 6Wresearch | Author: Ravi Bhandari | No. of Pages: 60 | No. of Figures: 30 | No. of Tables: 5 |
Malta Bio Plasticizer Market Size (2020-2030)
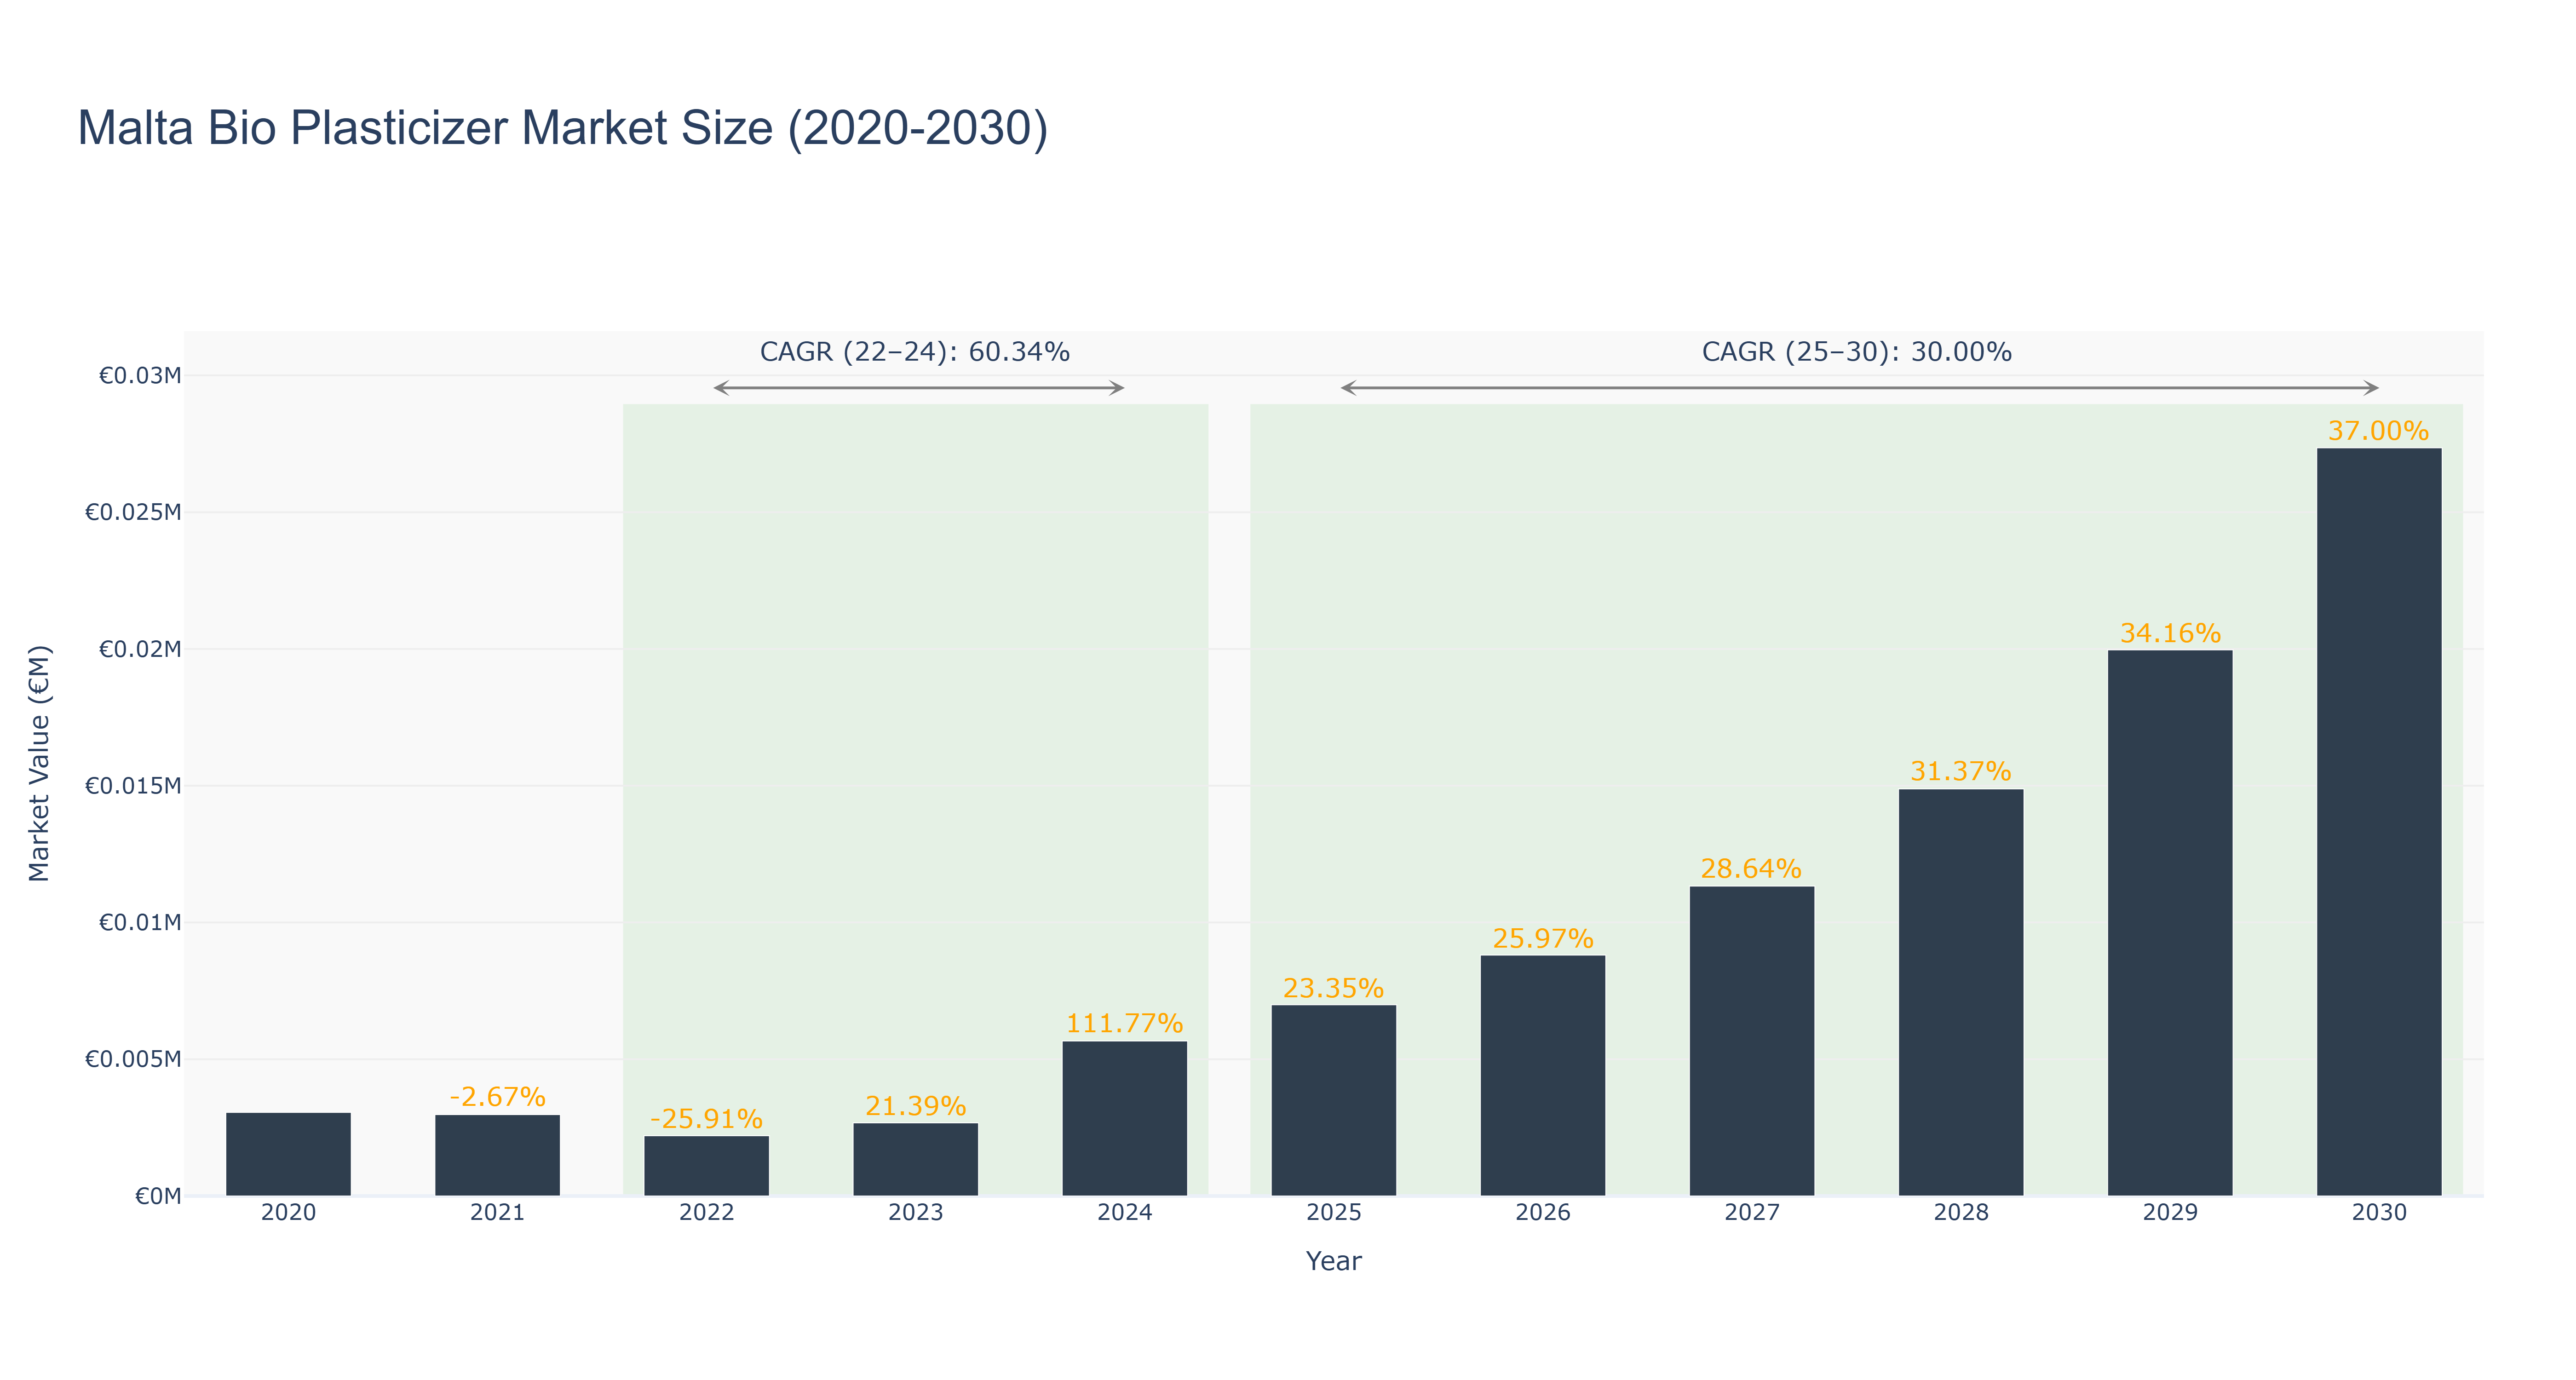
The Malta Bio Plasticizer Market is experiencing a significant recovery and growth trajectory following a challenging period. The actual market size peaked at €3.06 thousand in 2020 but faced a decline, dropping to €2.20 thousand in 2022, before rebounding to €2.68 thousand in 2023 and reaching €5.67 thousand in 2024, reflecting a remarkable CAGR of 60.34% from 2022 to 2024. The forecasted period from 2025 to 2030 indicates continued robust growth, with projected market sizes increasing from €6.99 thousand in 2025 to €27.35 thousand by 2030, translating to a CAGR of 30.00%. This resurgence is driven by a growing emphasis on sustainable materials and regulatory support for eco-friendly alternatives. As industries increasingly pivot towards sustainability, the Malta Bio Plasticizer Market is poised for expansion, bolstered by innovations and investments in bioplastics that align with global environmental goals.
Malta Bio Plasticizer Market: Production & Trade Performance (2019-2025)
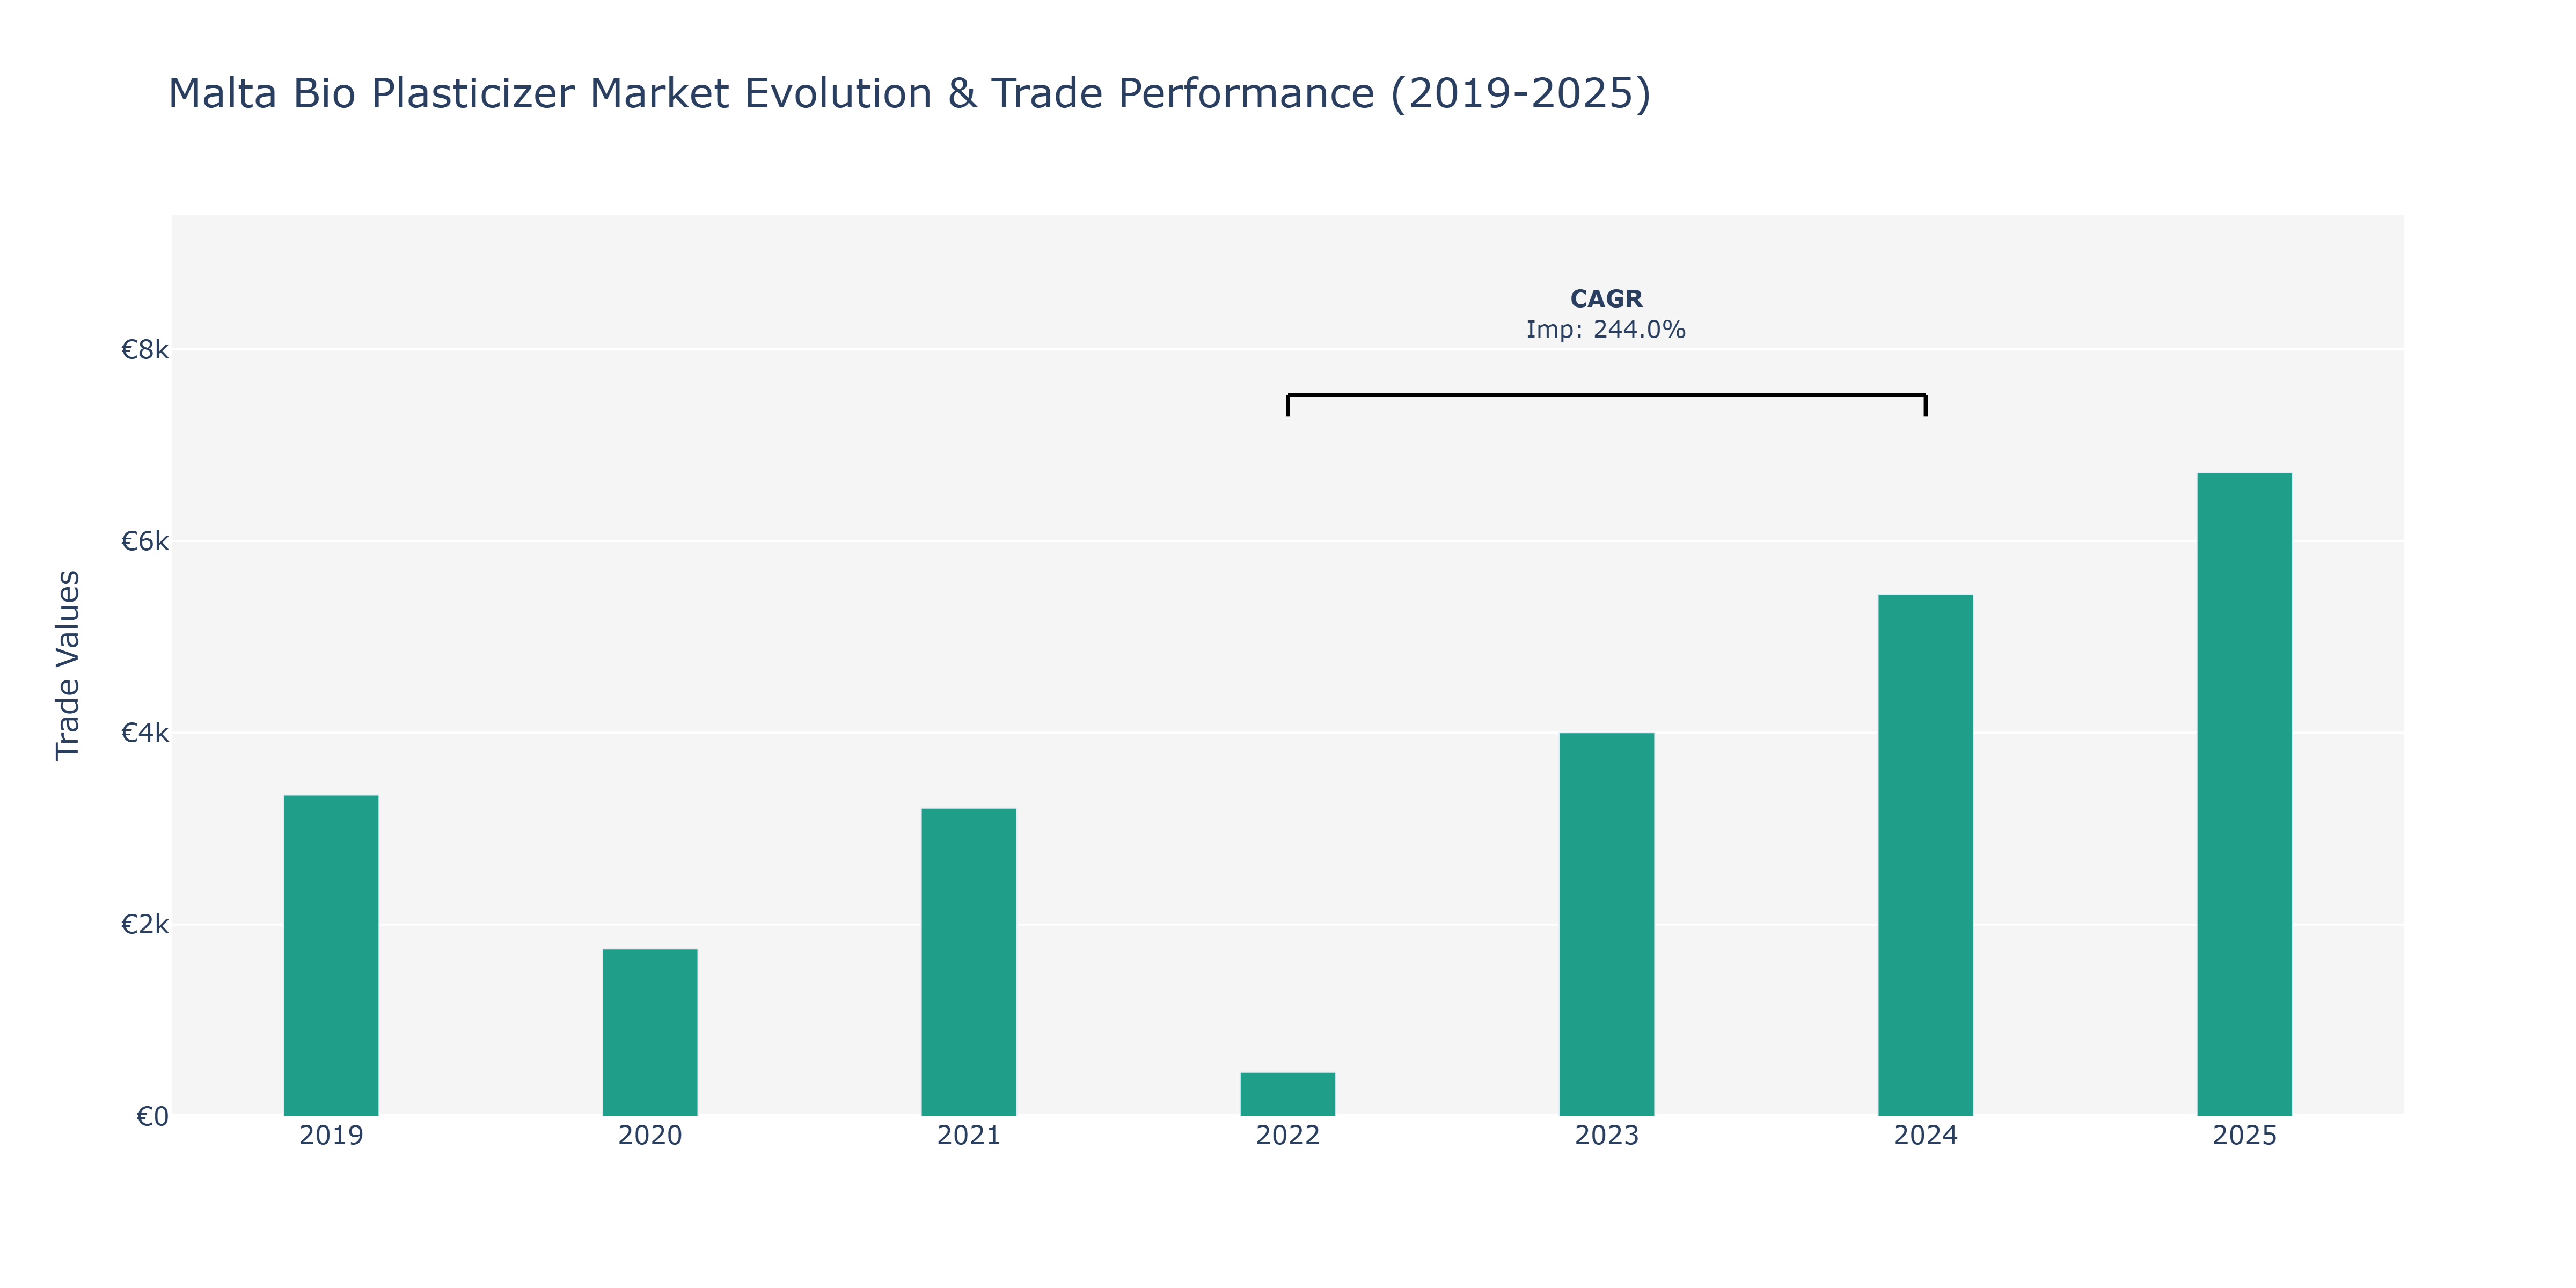
Imports in the Malta Bio Plasticizer Market exhibited notable fluctuations over the specified years. In 2019, imports stood at €3.35 thousand, showcasing the market's initial strength. A substantial decline was witnessed in 2020, dropping to €1.75 thousand, potentially attributed to global economic challenges. The market rebounded in 2021, reaching €3.21 thousand, indicating a recovery phase. However, a sharp decrease was observed in 2022, falling to €460. The following years saw a positive trend, with imports reaching €4.0 thousand in 2023, further climbing to €5.45 thousand in 2024, and finally peaking at €6.72 thousand in 2025. This impressive growth could be linked to increased demand for sustainable plasticizer solutions in response to environmental concerns and regulatory pressures. Such a robust upward trajectory aligns with the reported CAGR of 244.05% for the period between 2022 and 2024, reflecting a promising outlook for the market's future expansion.
Key Highlights of the Report:
- Malta Bio Plasticizer Market Outlook
- Market Size of Malta Bio Plasticizer Market, 2025
- Forecast of Malta Bio Plasticizer Market, 2032
- Historical Data and Forecast of Malta Bio Plasticizer Revenues & Volume for the Period 2022 - 2032F
- Malta Bio Plasticizer Market Trend Evolution
- Malta Bio Plasticizer Market Drivers and Challenges
- Malta Bio Plasticizer Price Trends
- Malta Bio Plasticizer Porter`s Five Forces
- Malta Bio Plasticizer Industry Life Cycle
- Historical Data and Forecast of Malta Bio Plasticizer Market Revenues & Volume By Type for the Period 2022 - 2032F
- Historical Data and Forecast of Malta Bio Plasticizer Market Revenues & Volume By Sebacates for the Period 2022 - 2032F
- Historical Data and Forecast of Malta Bio Plasticizer Market Revenues & Volume By Succinic Acid for the Period 2022 - 2032F
- Historical Data and Forecast of Malta Bio Plasticizer Market Revenues & Volume By Citrates for the Period 2022 - 2032F
- Historical Data and Forecast of Malta Bio Plasticizer Market Revenues & Volume By Glycerol Esters for the Period 2022 - 2032F
- Historical Data and Forecast of Malta Bio Plasticizer Market Revenues & Volume By Others for the Period 2022 - 2032F
- Historical Data and Forecast of Malta Bio Plasticizer Market Revenues & Volume By Epoxides for the Period 2022 - 2032F
- Historical Data and Forecast of Malta Bio Plasticizer Market Revenues & Volume By Application for the Period 2022 - 2032F
- Historical Data and Forecast of Malta Bio Plasticizer Market Revenues & Volume By Flooring and Walls for the Period 2022 - 2032F
- Historical Data and Forecast of Malta Bio Plasticizer Market Revenues & Volume By Film and Sheet Coverings for the Period 2022 - 2032F
- Historical Data and Forecast of Malta Bio Plasticizer Market Revenues & Volume By Wires and Cables for the Period 2022 - 2032F
- Historical Data and Forecast of Malta Bio Plasticizer Market Revenues & Volume By Coated Fabrics for the Period 2022 - 2032F
- Historical Data and Forecast of Malta Bio Plasticizer Market Revenues & Volume By Consumer Goods for the Period 2022 - 2032F
- Historical Data and Forecast of Malta Bio Plasticizer Market Revenues & Volume By Others for the Period 2022 - 2032F
- Malta Bio Plasticizer Import Export Trade Statistics
- Market Opportunity Assessment By Type
- Market Opportunity Assessment By Application
- Malta Bio Plasticizer Top Companies Market Share
- Malta Bio Plasticizer Competitive Benchmarking By Technical and Operational Parameters
- Malta Bio Plasticizer Company Profiles
- Malta Bio Plasticizer Key Strategic Recommendations
Frequently Asked Questions About the Market Study (FAQs):
6Wresearch actively monitors the Malta Bio Plasticizer Market and publishes its comprehensive annual report, highlighting emerging trends, growth drivers, revenue analysis, and forecast outlook. Our insights help businesses to make data-backed strategic decisions with ongoing market dynamics. Our analysts track relevent industries related to the Malta Bio Plasticizer Market, allowing our clients with actionable intelligence and reliable forecasts tailored to emerging regional needs.
Yes, we provide customisation as per your requirements. To learn more, feel free to contact us on sales@6wresearch.com
1 Executive Summary |
2 Introduction |
2.1 Key Highlights of the Report |
2.2 Report Description |
2.3 Market Scope & Segmentation |
2.4 Research Methodology |
2.5 Assumptions |
3 Malta Bio Plasticizer Market Overview |
3.1 Malta Country Macro Economic Indicators |
3.2 Malta Bio Plasticizer Market Revenues & Volume, 2022 & 2032F |
3.3 Malta Bio Plasticizer Market - Industry Life Cycle |
3.4 Malta Bio Plasticizer Market - Porter's Five Forces |
3.5 Malta Bio Plasticizer Market Revenues & Volume Share, By Type, 2022 & 2032F |
3.6 Malta Bio Plasticizer Market Revenues & Volume Share, By Application, 2022 & 2032F |
4 Malta Bio Plasticizer Market Dynamics |
4.1 Impact Analysis |
4.2 Market Drivers |
4.2.1 Increasing consumer awareness towards sustainable and eco-friendly products |
4.2.2 Stringent government regulations promoting the use of bio-based materials |
4.2.3 Growing demand for bio plasticizers in various industries such as packaging, automotive, and construction |
4.3 Market Restraints |
4.3.1 Higher production costs associated with bio plasticizers compared to conventional plasticizers |
4.3.2 Lack of awareness and understanding among end-users about the benefits of bio plasticizers |
4.3.3 Limited availability of raw materials for bio plasticizer production |
5 Malta Bio Plasticizer Market Trends |
6 Malta Bio Plasticizer Market Segmentations |
6.1 Malta Bio Plasticizer Market, By Type |
6.1.1 Overview and Analysis |
6.1.2 Malta Bio Plasticizer Market Revenues & Volume, By Sebacates, 2022 - 2032F |
6.1.3 Malta Bio Plasticizer Market Revenues & Volume, By Succinic Acid, 2022 - 2032F |
6.1.4 Malta Bio Plasticizer Market Revenues & Volume, By Citrates, 2022 - 2032F |
6.1.5 Malta Bio Plasticizer Market Revenues & Volume, By Glycerol Esters, 2022 - 2032F |
6.1.6 Malta Bio Plasticizer Market Revenues & Volume, By Others, 2022 - 2032F |
6.1.7 Malta Bio Plasticizer Market Revenues & Volume, By Epoxides, 2022 - 2032F |
6.2 Malta Bio Plasticizer Market, By Application |
6.2.1 Overview and Analysis |
6.2.2 Malta Bio Plasticizer Market Revenues & Volume, By Flooring and Walls, 2022 - 2032F |
6.2.3 Malta Bio Plasticizer Market Revenues & Volume, By Film and Sheet Coverings, 2022 - 2032F |
6.2.4 Malta Bio Plasticizer Market Revenues & Volume, By Wires and Cables, 2022 - 2032F |
6.2.5 Malta Bio Plasticizer Market Revenues & Volume, By Coated Fabrics, 2022 - 2032F |
6.2.6 Malta Bio Plasticizer Market Revenues & Volume, By Consumer Goods, 2022 - 2032F |
6.2.7 Malta Bio Plasticizer Market Revenues & Volume, By Others, 2022 - 2032F |
7 Malta Bio Plasticizer Market Import-Export Trade Statistics |
7.1 Malta Bio Plasticizer Market Export to Major Countries |
7.2 Malta Bio Plasticizer Market Imports from Major Countries |
8 Malta Bio Plasticizer Market Key Performance Indicators |
8.1 Percentage of companies adopting bio plasticizers in their products |
8.2 Research and development investment in bio plasticizer technology |
8.3 Number of new applications using bio plasticizers |
8.4 Environmental impact assessment of bio plasticizer production and usage |
8.5 Adoption rate of bio plasticizers in key industries |
9 Malta Bio Plasticizer Market - Opportunity Assessment |
9.1 Malta Bio Plasticizer Market Opportunity Assessment, By Type, 2022 & 2032F |
9.2 Malta Bio Plasticizer Market Opportunity Assessment, By Application, 2022 & 2032F |
10 Malta Bio Plasticizer Market - Competitive Landscape |
10.1 Malta Bio Plasticizer Market Revenue Share, By Companies, 2025 |
10.2 Malta Bio Plasticizer Market Competitive Benchmarking, By Operating and Technical Parameters |
11 Company Profiles |
12 Recommendations | 13 Disclaimer |
Global Go To Market Strategy - 2030
Export potential enables firms to identify high-growth global markets with greater confidence by combining advanced trade intelligence with a structured quantitative methodology. The framework analyzes emerging demand trends and country-level import patterns while integrating macroeconomic and trade datasets such as GDP and population forecasts, bilateral import–export flows, tariff structures, elasticity differentials between developed and developing economies, geographic distance, and import demand projections. Using weighted trade values from 2020–2024 as the base period to project country-to-country export potential for 2030, these inputs are operationalized through calculated drivers such as gravity model parameters, tariff impact factors, and projected GDP per-capita growth. Through an analysis of hidden potentials, demand hotspots, and market conditions that are most favorable to success, this method enables firms to focus on target countries, maximize returns, and global expansion with data, backed by accuracy.
By factoring in the projected importer demand gap that is currently unmet and could be potential opportunity, it identifies the potential for the Exporter (Country) among 190 countries, against the general trade analysis, which identifies the biggest importer or exporter.
To discover high-growth global markets and optimize your business strategy:
Click Here
Pricing
- Single User License$ 1,995
- Department License$ 2,400
- Site License$ 3,120
- Global License$ 3,795

Leadership Perspectives from Industry Events
Search
Thought Leadership and Analyst Meet


Our Clients
6WResearch In News
- Doha a strategic location for EV manufacturing hub: IPA Qatar
- Demand for luxury TVs surging in the GCC, says Samsung
- Empowering Growth: The Thriving Journey of Bangladesh’s Cable Industry
- Demand for luxury TVs surging in the GCC, says Samsung
- Video call with a traditional healer? Once unthinkable, it’s now common in South Africa
- Intelligent Buildings To Smooth GCC’s Path To Net Zero
Latest Reports
- New Zealand Aseptic Manufacturing Market (2026-2032)
- Netherlands Aseptic Manufacturing Market (2026-2032)
- Nauru Aseptic Manufacturing Market (2026-2032)
- Namibia Aseptic Manufacturing Market (2026-2032)
- Mozambique Aseptic Manufacturing Market (2026-2032)
- Montenegro Aseptic Manufacturing Market (2026-2032)
- Mongolia Aseptic Manufacturing Market (2026-2032)
- Monaco Aseptic Manufacturing Market (2026-2032)
- Micronesia Aseptic Manufacturing Market (2026-2032)
- Mauritius Aseptic Manufacturing Market (2026-2032)
Industry Events and Analyst Meet

HIMTEX 2026

India Refining Summit 2026

India EV Show 2026

EV tech India Expo 2026

Auto Tech Asia 2026
Whitepaper
- Middle East & Africa Commercial Security Market Click here to view more.
- Middle East & Africa Fire Safety Systems & Equipment Market Click here to view more.
- GCC Drone Market Click here to view more.
- Middle East Lighting Fixture Market Click here to view more.
- GCC Physical & Perimeter Security Market Click here to view more.