Malta Direct Thermal Paper Market (2026-2032) | Value, Size & Revenue, Outlook, Segmentation, Forecast, Share, Industry, Growth, Trends, Analysis, Companies, Competitive Landscape
Market Forecast By Product Type (Top Coated, Non-Top Coated) And Competitive Landscape
| Product Code: ETC8190674 | Publication Date: Sep 2024 | Updated Date: Apr 2026 | Product Type: Market Research Report | |
| Publisher: 6Wresearch | Author: Sumit Sagar | No. of Pages: 75 | No. of Figures: 35 | No. of Tables: 20 |
Malta Direct Thermal Paper Market Size (2020-2030)
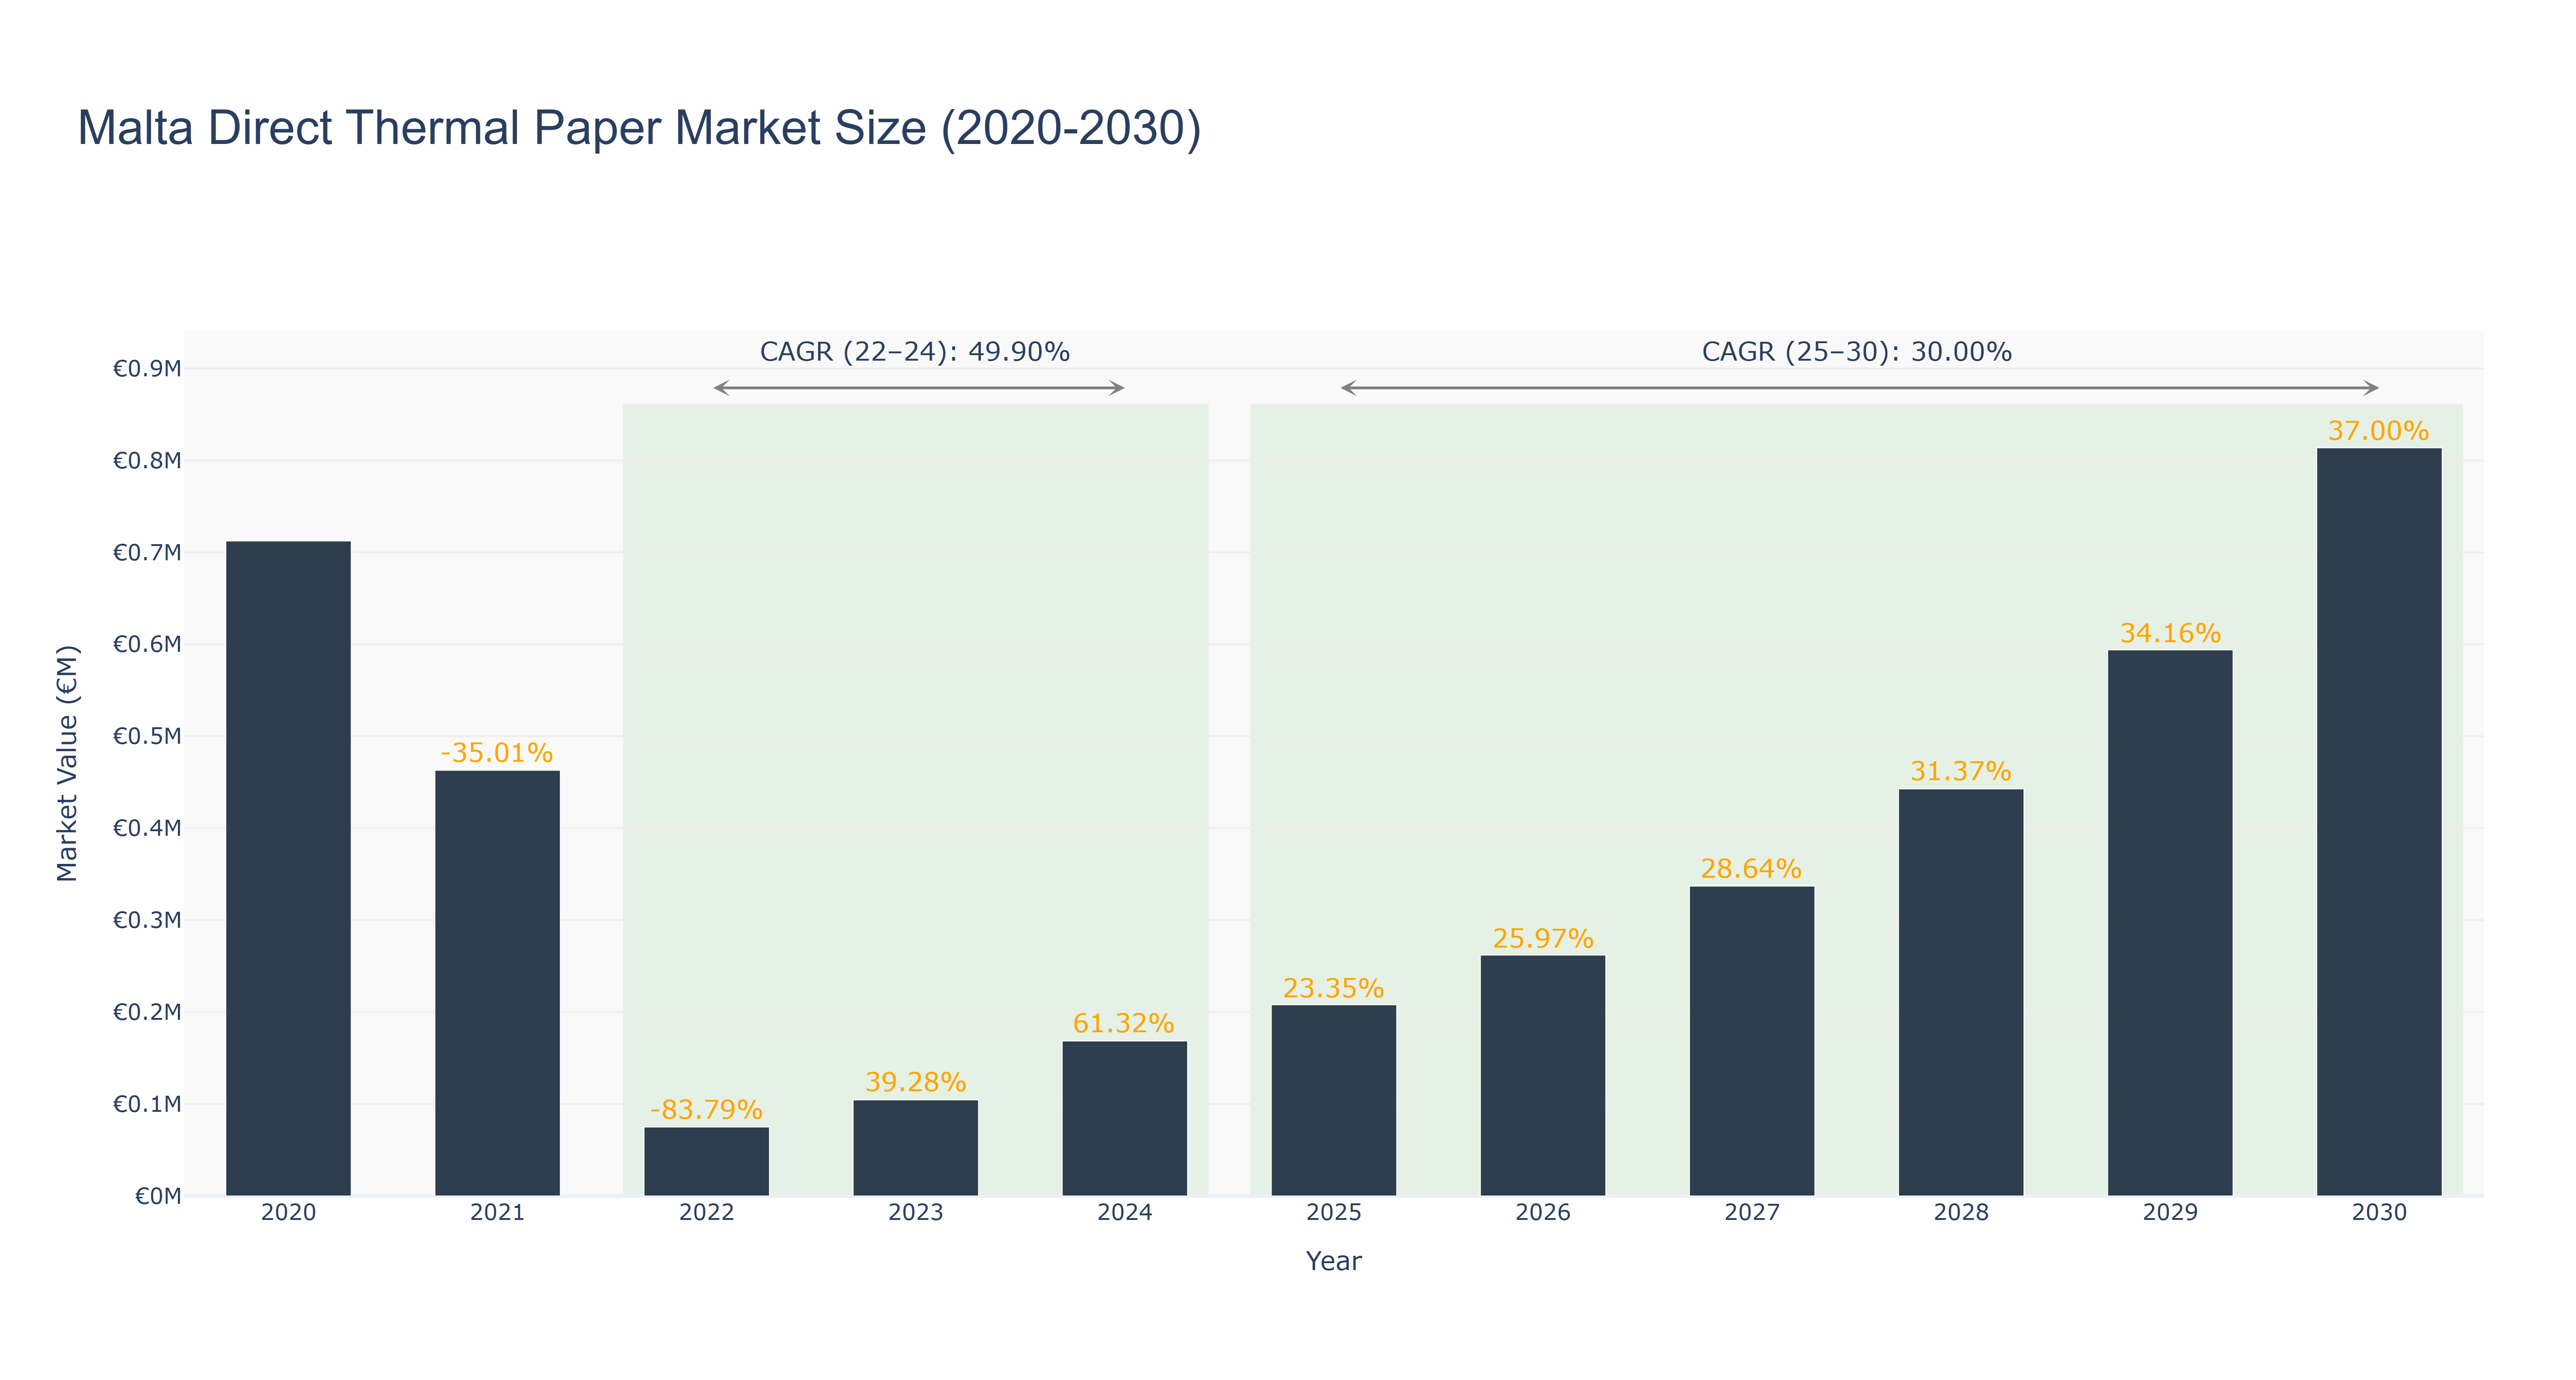
Malta Direct Thermal Paper Market has shown a fluctuating trend over the past decade. The peak market size of €0.81 million is projected for 2030, reflecting a steady growth trajectory. Actual market sizes decreased from €0.71 million in 2020 to €0.17 million in 2024 due to factors like economic downturn and technological shifts. However, there was a notable recovery post-2024 with market sizes forecasted to reach €0.59 million by 2029 and €0.81 million by 2030, driven by increased demand for eco-friendly paper solutions. The CAGR for 2022-24 stands at 49.90%, while for 2025-30, it is expected to stabilize at 30.0%. The industry is poised for further growth with upcoming initiatives to promote sustainable paper production methods and expand market reach through digital integration.
Malta Direct Thermal Paper Market: Production & Trade Performance (2019-2025)
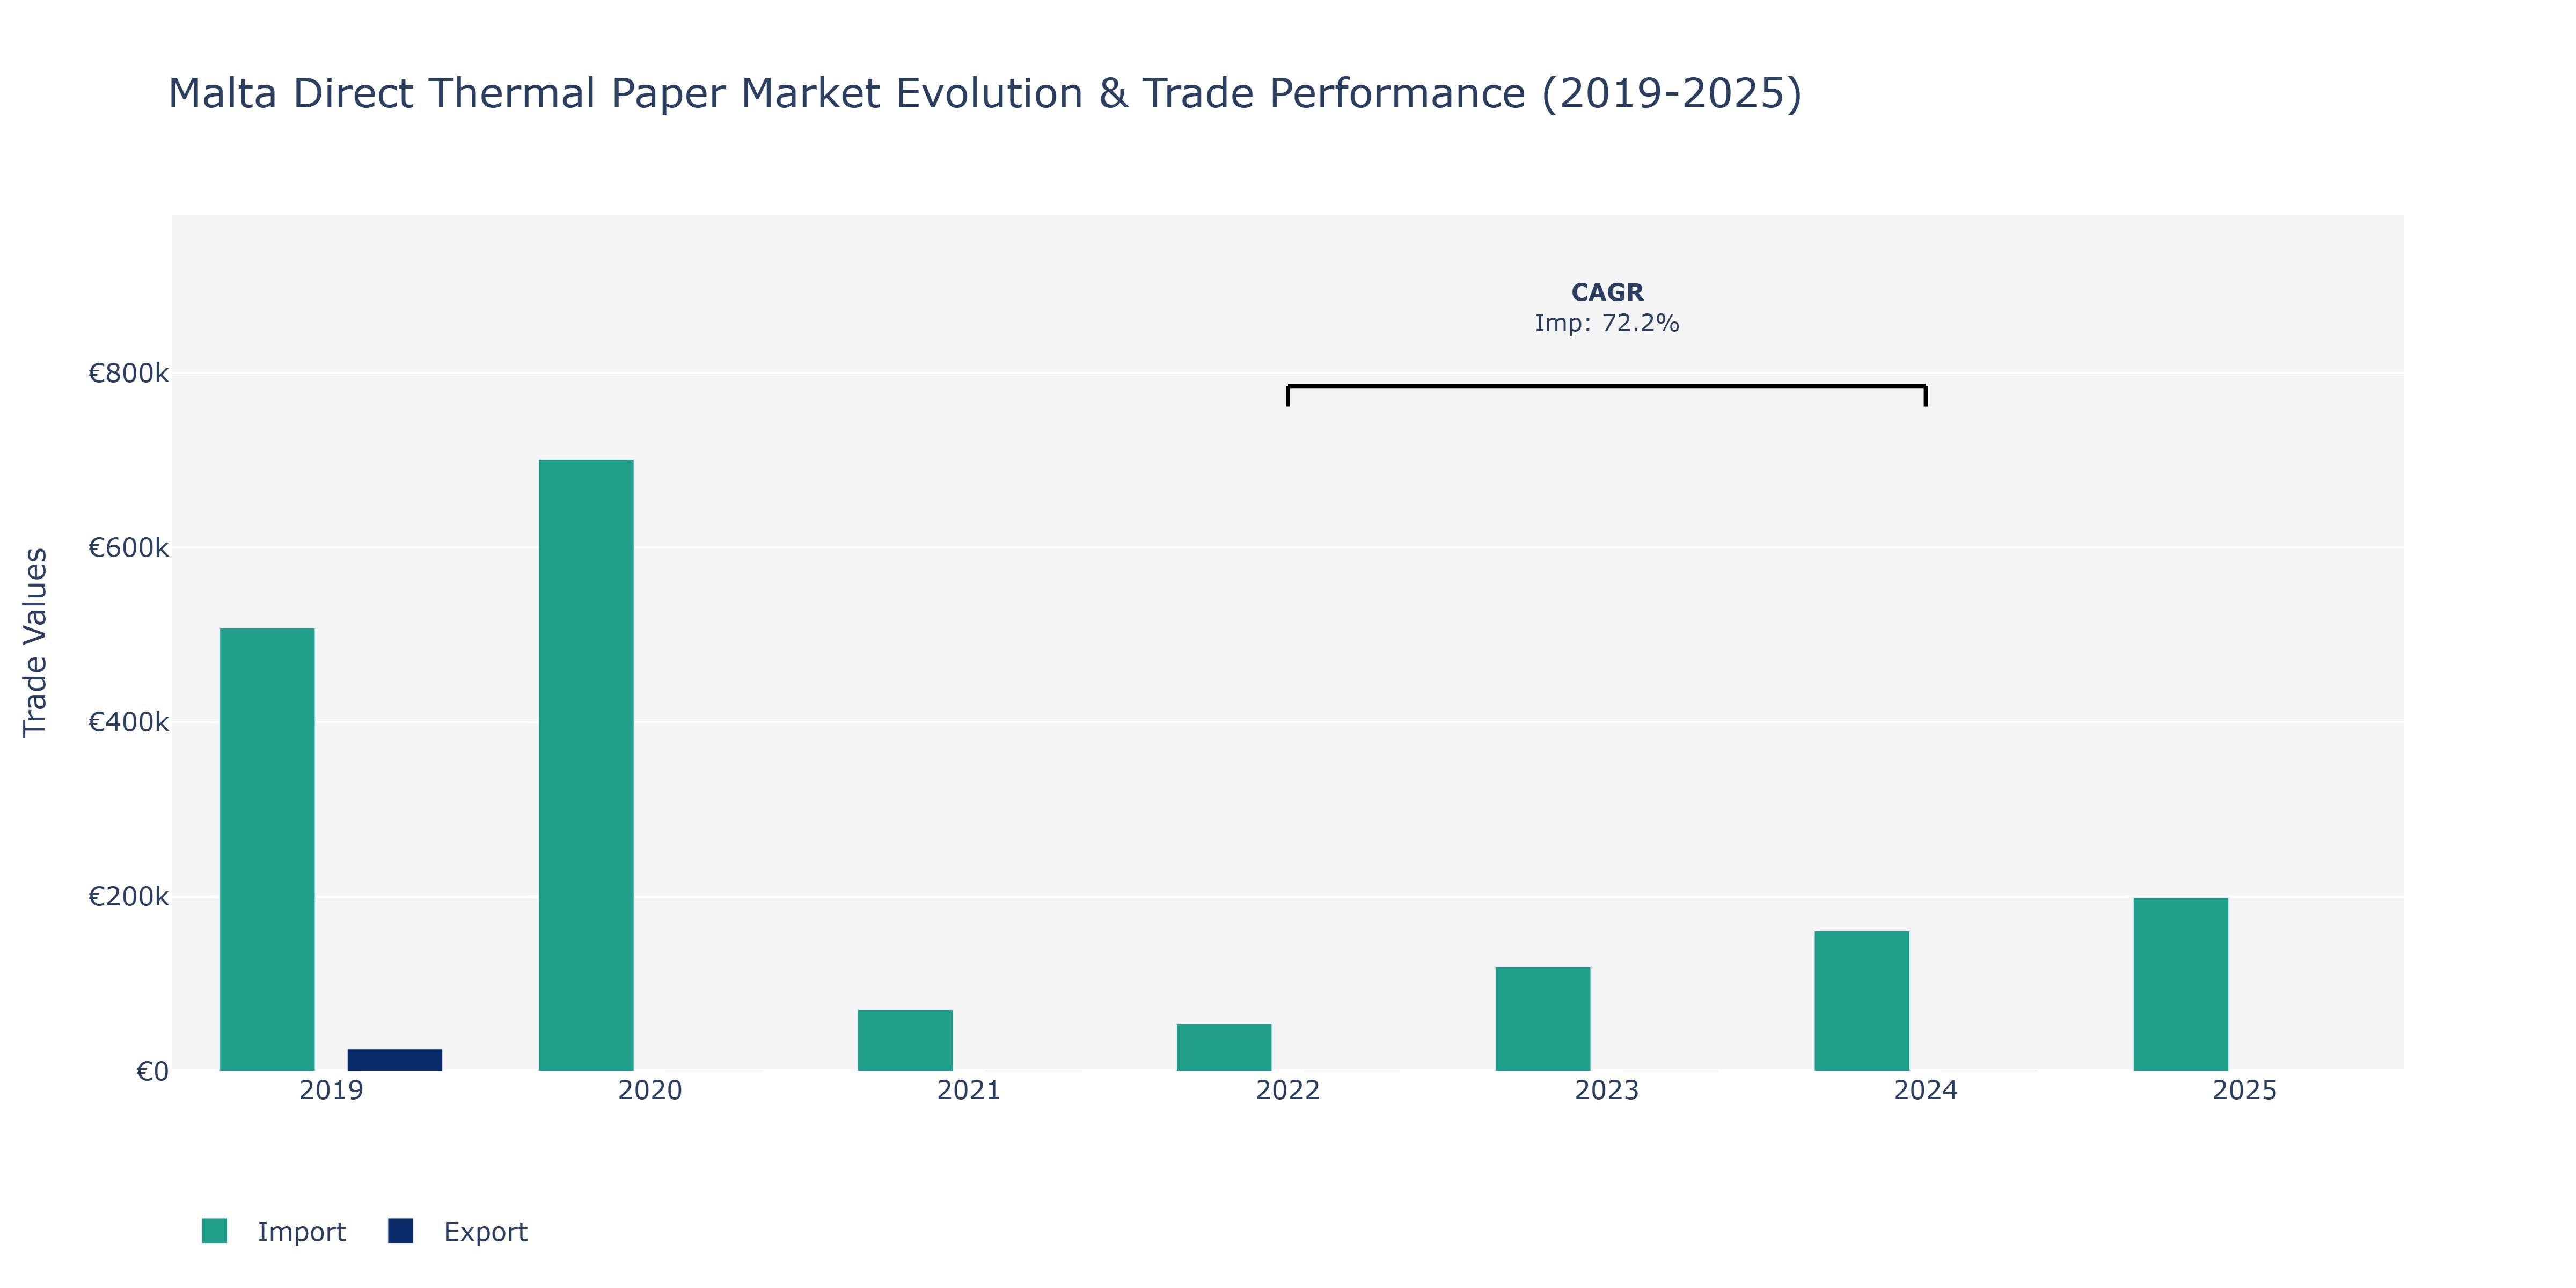
In the Malta Direct Thermal Paper Market, imports and exports play a pivotal role in shaping the industry landscape. In 2019, exports stood at €25.67 thousand, while imports were significantly higher at €507.84 thousand, indicating a strong reliance on foreign goods. The year 2020 saw a substantial surge in imports to €700.86 thousand, reflecting increased demand or supply chain adjustments. Despite a slight decline in 2021 to €70.75 thousand, imports rebounded in the following years, with figures reaching €161.10 thousand in 2024 and €198.72 thousand in 2025. This upward trend in imports from 2022 to 2024, with a remarkable CAGR of 72.24%, could be attributed to growing domestic consumption or strategic trade partnerships. The notable fluctuations in Import value underscore the market's sensitivity to global economic conditions and trade policies, highlighting the need for players in the industry to adapt to evolving market dynamics to ensure competitiveness and sustainability.
Key Highlights of the Report:
- Malta Direct Thermal Paper Market Outlook
- Market Size of Malta Direct Thermal Paper Market, 2025
- Forecast of Malta Direct Thermal Paper Market, 2032
- Historical Data and Forecast of Malta Direct Thermal Paper Revenues & Volume for the Period 2022 - 2032
- Malta Direct Thermal Paper Market Trend Evolution
- Malta Direct Thermal Paper Market Drivers and Challenges
- Malta Direct Thermal Paper Price Trends
- Malta Direct Thermal Paper Porter's Five Forces
- Malta Direct Thermal Paper Industry Life Cycle
- Historical Data and Forecast of Malta Direct Thermal Paper Market Revenues & Volume By Product Type for the Period 2022 - 2032
- Historical Data and Forecast of Malta Direct Thermal Paper Market Revenues & Volume By Top Coated for the Period 2022 - 2032
- Historical Data and Forecast of Malta Direct Thermal Paper Market Revenues & Volume By Non-Top Coated for the Period 2022 - 2032
- Malta Direct Thermal Paper Import Export Trade Statistics
- Market Opportunity Assessment By Product Type
- Malta Direct Thermal Paper Top Companies Market Share
- Malta Direct Thermal Paper Competitive Benchmarking By Technical and Operational Parameters
- Malta Direct Thermal Paper Company Profiles
- Malta Direct Thermal Paper Key Strategic Recommendations
Frequently Asked Questions About the Market Study (FAQs):
6Wresearch actively monitors the Malta Direct Thermal Paper Market and publishes its comprehensive annual report, highlighting emerging trends, growth drivers, revenue analysis, and forecast outlook. Our insights help businesses to make data-backed strategic decisions with ongoing market dynamics. Our analysts track relevent industries related to the Malta Direct Thermal Paper Market, allowing our clients with actionable intelligence and reliable forecasts tailored to emerging regional needs.
Yes, we provide customisation as per your requirements. To learn more, feel free to contact us on sales@6wresearch.com
1 Executive Summary |
2 Introduction |
2.1 Key Highlights of the Report |
2.2 Report Description |
2.3 Market Scope & Segmentation |
2.4 Research Methodology |
2.5 Assumptions |
3 Malta Direct Thermal Paper Market Overview |
3.1 Malta Country Macro Economic Indicators |
3.2 Malta Direct Thermal Paper Market Revenues & Volume, 2022 & 2032F |
3.3 Malta Direct Thermal Paper Market - Industry Life Cycle |
3.4 Malta Direct Thermal Paper Market - Porter's Five Forces |
3.5 Malta Direct Thermal Paper Market Revenues & Volume Share, By Product Type, 2022 & 2032F |
4 Malta Direct Thermal Paper Market Dynamics |
4.1 Impact Analysis |
4.2 Market Drivers |
4.2.1 Increasing demand for eco-friendly and recyclable direct thermal paper products |
4.2.2 Growth in the retail and logistics sectors which heavily rely on direct thermal paper for printing labels and receipts |
4.2.3 Technological advancements in direct thermal printing leading to improved quality and efficiency |
4.3 Market Restraints |
4.3.1 Volatility in raw material prices, such as leuco dye and developers, impacting the production cost of direct thermal paper |
4.3.2 Competition from digital solutions and electronic receipts reducing the demand for direct thermal paper |
4.3.3 Environmental concerns regarding the use of chemicals in direct thermal paper production affecting consumer preferences |
5 Malta Direct Thermal Paper Market Trends |
6 Malta Direct Thermal Paper Market, By Types |
6.1 Malta Direct Thermal Paper Market, By Product Type |
6.1.1 Overview and Analysis |
6.1.2 Malta Direct Thermal Paper Market Revenues & Volume, By Product Type, 2022 - 2032F |
6.1.3 Malta Direct Thermal Paper Market Revenues & Volume, By Top Coated, 2022 - 2032F |
6.1.4 Malta Direct Thermal Paper Market Revenues & Volume, By Non-Top Coated, 2022 - 2032F |
7 Malta Direct Thermal Paper Market Import-Export Trade Statistics |
7.1 Malta Direct Thermal Paper Market Export to Major Countries |
7.2 Malta Direct Thermal Paper Market Imports from Major Countries |
8 Malta Direct Thermal Paper Market Key Performance Indicators |
8.1 Adoption rate of eco-friendly direct thermal paper products |
8.2 Efficiency improvements in direct thermal printing technology |
8.3 Percentage of market share captured by direct thermal paper compared to alternative solutions |
8.4 Customer satisfaction with the quality and durability of direct thermal paper products |
8.5 Investment in research and development for innovative direct thermal paper solutions |
9 Malta Direct Thermal Paper Market - Opportunity Assessment |
9.1 Malta Direct Thermal Paper Market Opportunity Assessment, By Product Type, 2022 & 2032F |
10 Malta Direct Thermal Paper Market - Competitive Landscape |
10.1 Malta Direct Thermal Paper Market Revenue Share, By Companies, 2025 |
10.2 Malta Direct Thermal Paper Market Competitive Benchmarking, By Operating and Technical Parameters |
11 Company Profiles |
12 Recommendations |
13 Disclaimer |
Global Go To Market Strategy - 2030
Export potential enables firms to identify high-growth global markets with greater confidence by combining advanced trade intelligence with a structured quantitative methodology. The framework analyzes emerging demand trends and country-level import patterns while integrating macroeconomic and trade datasets such as GDP and population forecasts, bilateral import–export flows, tariff structures, elasticity differentials between developed and developing economies, geographic distance, and import demand projections. Using weighted trade values from 2020–2024 as the base period to project country-to-country export potential for 2030, these inputs are operationalized through calculated drivers such as gravity model parameters, tariff impact factors, and projected GDP per-capita growth. Through an analysis of hidden potentials, demand hotspots, and market conditions that are most favorable to success, this method enables firms to focus on target countries, maximize returns, and global expansion with data, backed by accuracy.
By factoring in the projected importer demand gap that is currently unmet and could be potential opportunity, it identifies the potential for the Exporter (Country) among 190 countries, against the general trade analysis, which identifies the biggest importer or exporter.
To discover high-growth global markets and optimize your business strategy:
Click Here
Pricing
- Single User License$ 1,995
- Department License$ 2,400
- Site License$ 3,120
- Global License$ 3,795

Leadership Perspectives from Industry Events
Search
Thought Leadership and Analyst Meet


Our Clients
6WResearch In News
- India Export Attractiveness Tracker 2026
- India Air Conditioner Market Set for Strong Rebound in 2026 After Weather-Led Correction and GST-Driven Recovery: 6Wresearch
- ADAS in India: How Automatic Emergency Braking, Blind Spot Detection & Driver Monitoring are Transforming Road Safety
- Doha a strategic location for EV manufacturing hub: IPA Qatar
- Demand for luxury TVs surging in the GCC, says Samsung
- Empowering Growth: The Thriving Journey of Bangladesh’s Cable Industry
Latest Reports
- Nicaragua RPG Gaming Market (2026-2032)
- New Zealand RPG Gaming Market (2026-2032)
- Netherlands RPG Gaming Market (2026-2032)
- Nauru RPG Gaming Market (2026-2032)
- Namibia RPG Gaming Market (2026-2032)
- Mozambique RPG Gaming Market (2026-2032)
- Montenegro RPG Gaming Market (2026-2032)
- Mongolia RPG Gaming Market (2026-2032)
- Monaco RPG Gaming Market (2026-2032)
- Micronesia RPG Gaming Market (2026-2032)
Industry Events and Analyst Meet

EV India Expo 2026

HIMTEX 2026

India Refining Summit 2026

India EV Show 2026

EV tech India Expo 2026
Whitepaper
- Middle East & Africa Commercial Security Market Click here to view more.
- Middle East & Africa Fire Safety Systems & Equipment Market Click here to view more.
- GCC Drone Market Click here to view more.
- Middle East Lighting Fixture Market Click here to view more.
- GCC Physical & Perimeter Security Market Click here to view more.