Malta Hydroquinone Market (2025-2031) | Companies, Forecast, Analysis, Revenue, Segmentation, Size, Value, Share, Outlook, Industry, Trends & Growth
Market Forecast By Application (Intermediate, Antioxidant, Polymerization Inhibitor, Photosensitive Chemical, Others), By End-Use (Cosmetics, Polymers, Paints & Adhesives, Rubber, Others) And Competitive Landscape
| Product Code: ETC5354246 | Publication Date: Nov 2023 | Updated Date: Apr 2026 | Product Type: Market Research Report | |
| Publisher: 6Wresearch | Author: Ravi Bhandari | No. of Pages: 60 | No. of Figures: 30 | No. of Tables: 5 |
Malta Hydroquinone Market Size (2020-2030)
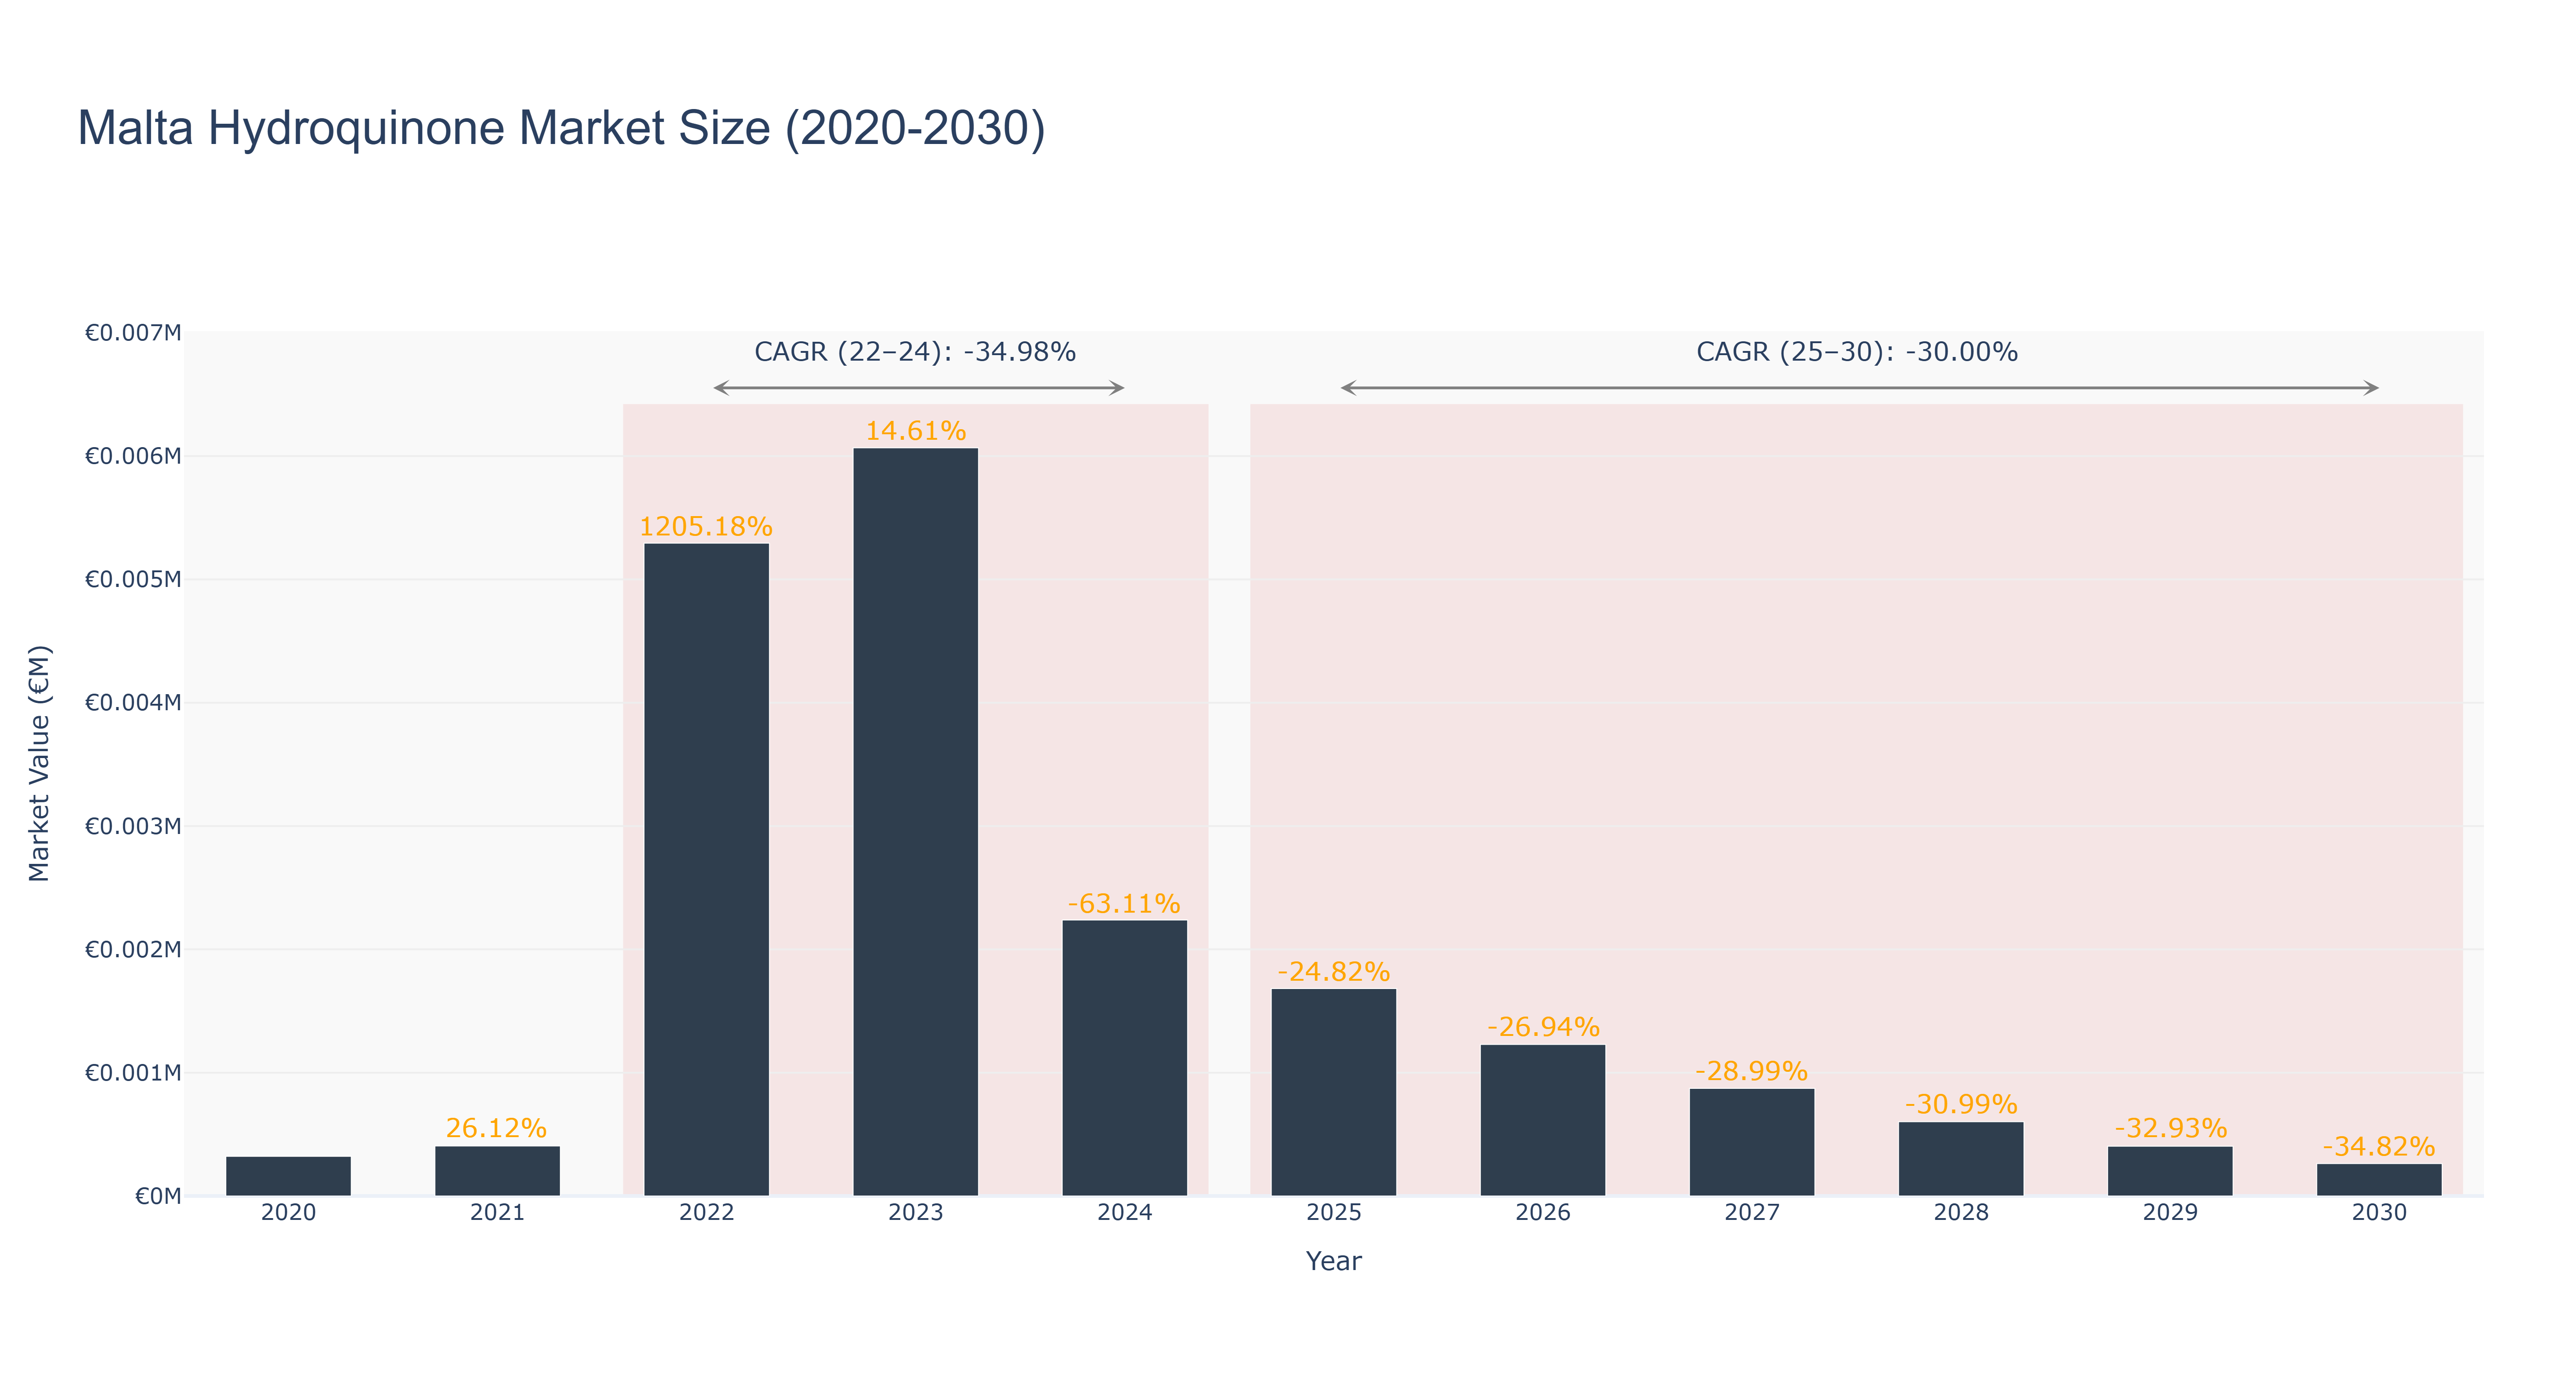
The Malta Hydroquinone Market has experienced a volatile trajectory, peaking in 2022 with a market size of €5.29 thousand, following a remarkable growth rate of 1205.18% from 2021. The actual market size grew from €321.60 in 2020 to €6.07 thousand in 2023, but it is projected to decline sharply, with a CAGR of -34.98% from 2022 to 2024, and a further decline anticipated with a CAGR of -30.00% from 2025 to 2030. Factors contributing to this downturn include regulatory challenges, shifts in consumer preferences, and increased competition from alternative products. As the market contracts, there are currently no significant upcoming projects or developments that could reverse this trend, indicating a challenging environment for stakeholders in the hydroquinone sector moving forward.
Malta Hydroquinone Market: Production & Trade Performance (2019-2025)
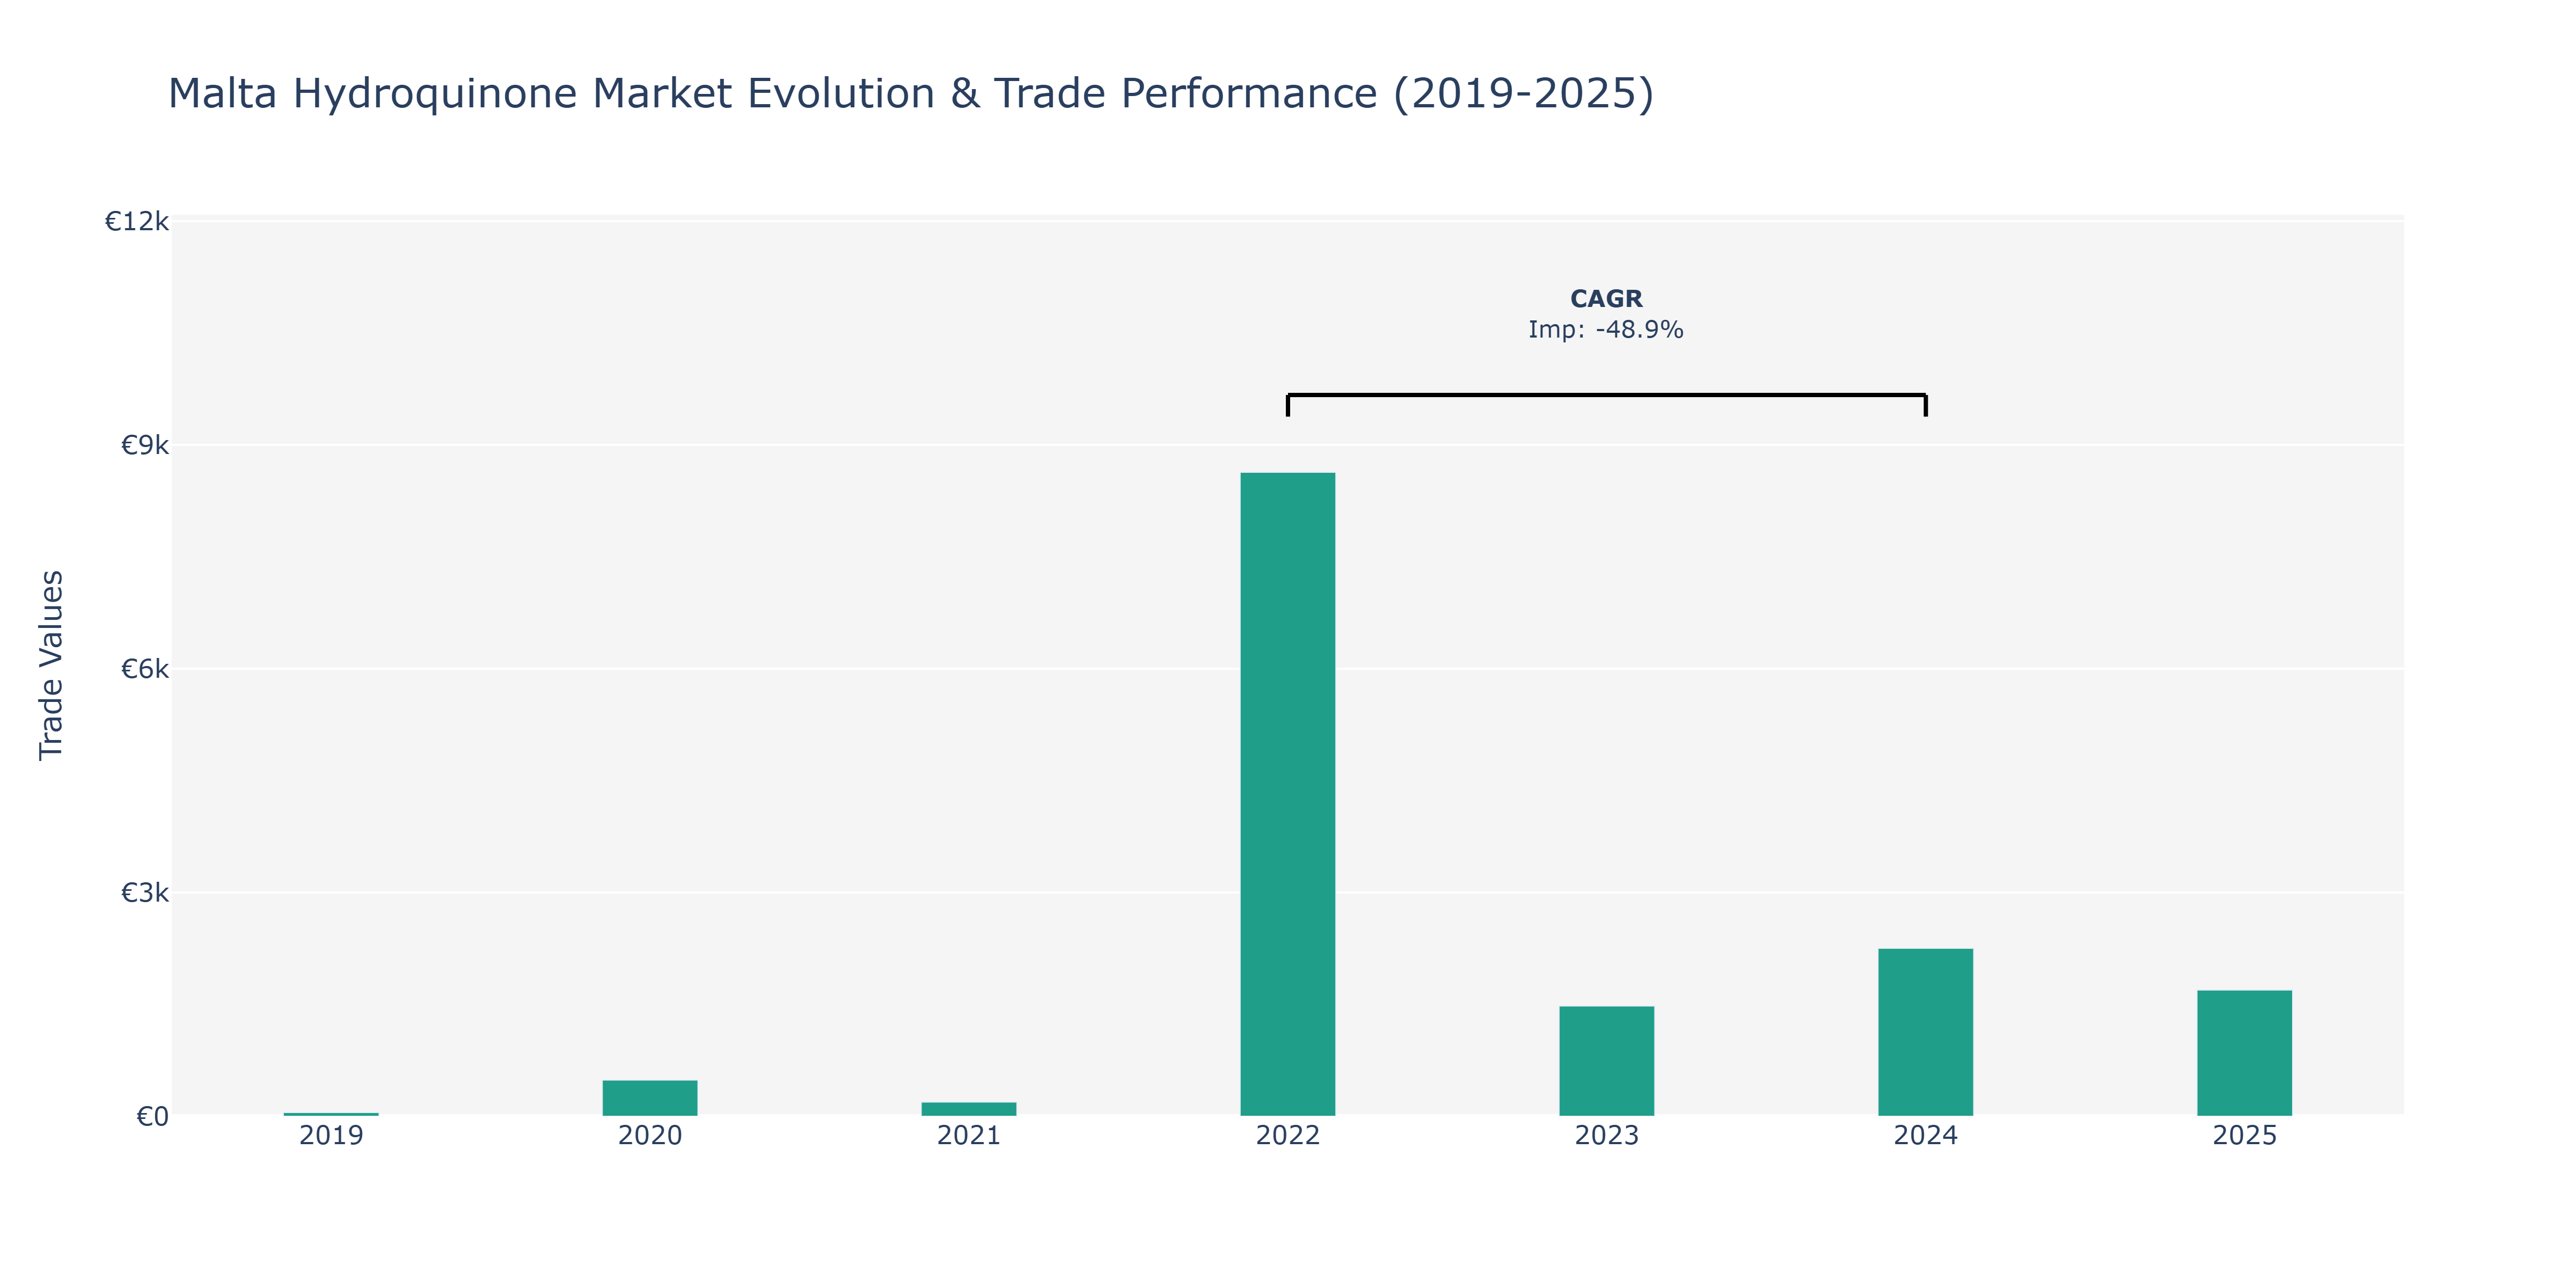
Imports of hydroquinone in the Malta market showed substantial fluctuations from 2019 to 2025. The data indicates a remarkable growth from 2019 to 2020, reaching €486 million, highlighting a significant surge in demand. However, the market experienced a stark decline in 2021 to €190 million, marking a significant drop in imports. The year 2022 saw a dramatic spike to €8.63 thousand, showcasing an unprecedented peak likely driven by increased industrial requirements or regulatory changes. Subsequently, imports decreased in 2023 to €1.48 thousand before a slight recovery in 2024 to €2.25 thousand. Interestingly, by 2025, imports settled at around €1.69 thousand, indicating a relatively stable phase. These fluctuations could be influenced by factors like changing consumer preferences, regulatory reforms, or shifts in manufacturing practices in the cosmetics and pharmaceutical industries, driving the demand for hydroquinone in Malta.
Key Highlights of the Report:
- Malta Hydroquinone Market Outlook
- Market Size of Malta Hydroquinone Market, 2024
- Forecast of Malta Hydroquinone Market, 2031
- Historical Data and Forecast of Malta Hydroquinone Revenues & Volume for the Period 2021-2031
- Malta Hydroquinone Market Trend Evolution
- Malta Hydroquinone Market Drivers and Challenges
- Malta Hydroquinone Price Trends
- Malta Hydroquinone Porter`s Five Forces
- Malta Hydroquinone Industry Life Cycle
- Historical Data and Forecast of Malta Hydroquinone Market Revenues & Volume By Application for the Period 2021-2031
- Historical Data and Forecast of Malta Hydroquinone Market Revenues & Volume By Intermediate for the Period 2021-2031
- Historical Data and Forecast of Malta Hydroquinone Market Revenues & Volume By Antioxidant for the Period 2021-2031
- Historical Data and Forecast of Malta Hydroquinone Market Revenues & Volume By Polymerization Inhibitor for the Period 2021-2031
- Historical Data and Forecast of Malta Hydroquinone Market Revenues & Volume By Photosensitive Chemical for the Period 2021-2031
- Historical Data and Forecast of Malta Hydroquinone Market Revenues & Volume By Others for the Period 2021-2031
- Historical Data and Forecast of Malta Hydroquinone Market Revenues & Volume By End-Use for the Period 2021-2031
- Historical Data and Forecast of Malta Hydroquinone Market Revenues & Volume By Cosmetics for the Period 2021-2031
- Historical Data and Forecast of Malta Hydroquinone Market Revenues & Volume By Polymers for the Period 2021-2031
- Historical Data and Forecast of Malta Hydroquinone Market Revenues & Volume By Paints & Adhesives for the Period 2021-2031
- Historical Data and Forecast of Malta Hydroquinone Market Revenues & Volume By Rubber for the Period 2021-2031
- Historical Data and Forecast of Malta Hydroquinone Market Revenues & Volume By Others for the Period 2021-2031
- Malta Hydroquinone Import Export Trade Statistics
- Market Opportunity Assessment By Application
- Market Opportunity Assessment By End-Use
- Malta Hydroquinone Top Companies Market Share
- Malta Hydroquinone Competitive Benchmarking By Technical and Operational Parameters
- Malta Hydroquinone Company Profiles
- Malta Hydroquinone Key Strategic Recommendations
Frequently Asked Questions About the Market Study (FAQs):
6Wresearch actively monitors the Malta Hydroquinone Market and publishes its comprehensive annual report, highlighting emerging trends, growth drivers, revenue analysis, and forecast outlook. Our insights help businesses to make data-backed strategic decisions with ongoing market dynamics. Our analysts track relevent industries related to the Malta Hydroquinone Market, allowing our clients with actionable intelligence and reliable forecasts tailored to emerging regional needs.
Yes, we provide customisation as per your requirements. To learn more, feel free to contact us on sales@6wresearch.com
1 Executive Summary |
2 Introduction |
2.1 Key Highlights of the Report |
2.2 Report Description |
2.3 Market Scope & Segmentation |
2.4 Research Methodology |
2.5 Assumptions |
3 Malta Hydroquinone Market Overview |
3.1 Malta Country Macro Economic Indicators |
3.2 Malta Hydroquinone Market Revenues & Volume, 2021 & 2031F |
3.3 Malta Hydroquinone Market - Industry Life Cycle |
3.4 Malta Hydroquinone Market - Porter's Five Forces |
3.5 Malta Hydroquinone Market Revenues & Volume Share, By Application? , 2021 & 2031F |
3.6 Malta Hydroquinone Market Revenues & Volume Share, By End-Use? , 2021 & 2031F |
4 Malta Hydroquinone Market Dynamics |
4.1 Impact Analysis |
4.2 Market Drivers |
4.2.1 Increasing demand for skin lightening products in the beauty and cosmetic industry |
4.2.2 Growing awareness about the benefits of hydroquinone in treating hyperpigmentation |
4.2.3 Rise in disposable income leading to higher spending on skincare products |
4.3 Market Restraints |
4.3.1 Stringent regulations and restrictions on the use of hydroquinone in certain regions |
4.3.2 Concerns regarding potential side effects and long-term health risks associated with hydroquinone usage |
4.3.3 Competition from alternative skin lightening ingredients and products |
5 Malta Hydroquinone Market Trends |
6 Malta Hydroquinone Market Segmentations |
6.1 Malta Hydroquinone Market, By Application? |
6.1.1 Overview and Analysis |
6.1.2 Malta Hydroquinone Market Revenues & Volume, By Intermediate, 2021-2031F |
6.1.3 Malta Hydroquinone Market Revenues & Volume, By Antioxidant, 2021-2031F |
6.1.4 Malta Hydroquinone Market Revenues & Volume, By Polymerization Inhibitor, 2021-2031F |
6.1.5 Malta Hydroquinone Market Revenues & Volume, By Photosensitive Chemical, 2021-2031F |
6.1.6 Malta Hydroquinone Market Revenues & Volume, By Others? , 2021-2031F |
6.2 Malta Hydroquinone Market, By End-Use? |
6.2.1 Overview and Analysis |
6.2.2 Malta Hydroquinone Market Revenues & Volume, By Cosmetics, 2021-2031F |
6.2.3 Malta Hydroquinone Market Revenues & Volume, By Polymers, 2021-2031F |
6.2.4 Malta Hydroquinone Market Revenues & Volume, By Paints & Adhesives, 2021-2031F |
6.2.5 Malta Hydroquinone Market Revenues & Volume, By Rubber, 2021-2031F |
6.2.6 Malta Hydroquinone Market Revenues & Volume, By Others, 2021-2031F |
7 Malta Hydroquinone Market Import-Export Trade Statistics |
7.1 Malta Hydroquinone Market Export to Major Countries |
7.2 Malta Hydroquinone Market Imports from Major Countries |
8 Malta Hydroquinone Market Key Performance Indicators |
8.1 Number of new product launches containing hydroquinone |
8.2 Frequency of regulatory approvals for hydroquinone-based products |
8.3 Consumer sentiment and perception towards hydroquinone in the skincare market |
9 Malta Hydroquinone Market - Opportunity Assessment |
9.1 Malta Hydroquinone Market Opportunity Assessment, By Application? , 2021 & 2031F |
9.2 Malta Hydroquinone Market Opportunity Assessment, By End-Use? , 2021 & 2031F |
10 Malta Hydroquinone Market - Competitive Landscape |
10.1 Malta Hydroquinone Market Revenue Share, By Companies, 2024 |
10.2 Malta Hydroquinone Market Competitive Benchmarking, By Operating and Technical Parameters |
11 Company Profiles |
12 Recommendations | 13 Disclaimer |
Export potential assessment - trade Analytics for 2030
Export potential enables firms to identify high-growth global markets with greater confidence by combining advanced trade intelligence with a structured quantitative methodology. The framework analyzes emerging demand trends and country-level import patterns while integrating macroeconomic and trade datasets such as GDP and population forecasts, bilateral import–export flows, tariff structures, elasticity differentials between developed and developing economies, geographic distance, and import demand projections. Using weighted trade values from 2020–2024 as the base period to project country-to-country export potential for 2030, these inputs are operationalized through calculated drivers such as gravity model parameters, tariff impact factors, and projected GDP per-capita growth. Through an analysis of hidden potentials, demand hotspots, and market conditions that are most favorable to success, this method enables firms to focus on target countries, maximize returns, and global expansion with data, backed by accuracy.
By factoring in the projected importer demand gap that is currently unmet and could be potential opportunity, it identifies the potential for the Exporter (Country) among 190 countries, against the general trade analysis, which identifies the biggest importer or exporter.
To discover high-growth global markets and optimize your business strategy:
Click Here
Pricing
- Single User License$ 1,995
- Department License$ 2,400
- Site License$ 3,120
- Global License$ 3,795

Search
Thought Leadership and Analyst Meet


Our Clients
Latest Reports
- Canada Cloud CFD Market (2026-2032) | Size & Revenue, Industry, Growth, Competitive Landscape, Forecast, Segmentation, Value, Outlook, Trends, Share, Analysis, Companies
- Taiwan Food Delivery Platform Market (2026-2032) | Companies, Outlook, Analysis, Trends, Value, Revenue, Segmentation, Share, Forecast, Competitive Landscape, Growth, Size & Forecast
- United Kingdom (UK) Long-term Care Insurance Market (2026-2032) | Growth, Share, Consumer Insights, Drivers, Opportunities, Competition, Pricing Analysis, Segments, Restraints, Companies, Competitive, Value, Outlook, Size, Demand, Analysis, Challenges, Strategic Insights, Investment Trends, Revenue, Trends, Supply, Forecast
- United Kingdom (UK) Long Term Care Market (2026-2032) | Companies, Outlook, Analysis, Trends, Value, Revenue, Segmentation, Share, Forecast, Competitive Landscape, Growth, Size & Forecast
- Iraq Insulation and Waterproofing Market (2026-2032) | Outlook, Drivers, Growth, Size, Share, Industry, Revenue, Trends, Demand, Competitive, Strategic Insights, Opportunities, Segments, Companies, Challenges, Strategy, Consumer Insights, Analysis, Investment Trends, Value, Segmentation, Forecast, Restraints
- India Switchgear Market Outlook (2026-2032) | Size, Share, Trends, Growth, Revenue, Forecast, Analysis, Value, Outlook
- Pakistan Contraceptive Implants Market (2025-2031) | Demand, Growth, Size, Share, Industry, Pricing Analysis, Competitive, Strategic Insights, Strategy, Consumer Insights, Analysis, Investment Trends, Opportunities, Revenue, Segments, Value, Segmentation, Supply, Forecast, Restraints, Outlook, Competition, Drivers, Trends, Companies, Challenges
- Sri Lanka Packaging Market (2026-2032) | Outlook, Competition, Drivers, Trends, Demand, Pricing Analysis, Competitive, Strategic Insights, Companies, Challenges, Strategy, Consumer Insights, Analysis, Investment Trends, Opportunities, Growth, Size, Share, Industry, Revenue, Segments, Value, Segmentation, Supply, Forecast, Restraints
- India Kids Watches Market (2026-2032) | Strategy, Consumer Insights, Analysis, Investment Trends, Opportunities, Growth, Size, Share, Industry, Revenue, Segments, Value, Segmentation, Supply, Forecast, Restraints, Outlook, Competition, Drivers, Trends, Demand, Pricing Analysis, Competitive, Strategic Insights, Companies, Challenges
- Saudi Arabia Core Assurance Service Market (2025-2031) | Strategy, Consumer Insights, Analysis, Investment Trends, Opportunities, Growth, Size, Share, Industry, Revenue, Segments, Value, Segmentation, Supply, Forecast, Restraints, Outlook, Competition, Drivers, Trends, Demand, Pricing Analysis, Competitive, Strategic Insights, Companies, Challenges
Industry Events and Analyst Meet

India EV Show 2026

EV tech India Expo 2026

Auto Tech Asia 2026

Battery Tech India 2026

Smart Production Solutions Guangzhou 2026
Whitepaper
- Middle East & Africa Commercial Security Market Click here to view more.
- Middle East & Africa Fire Safety Systems & Equipment Market Click here to view more.
- GCC Drone Market Click here to view more.
- Middle East Lighting Fixture Market Click here to view more.
- GCC Physical & Perimeter Security Market Click here to view more.
6WResearch In News
- Doha a strategic location for EV manufacturing hub: IPA Qatar
- Demand for luxury TVs surging in the GCC, says Samsung
- Empowering Growth: The Thriving Journey of Bangladesh’s Cable Industry
- Demand for luxury TVs surging in the GCC, says Samsung
- Video call with a traditional healer? Once unthinkable, it’s now common in South Africa
- Intelligent Buildings To Smooth GCC’s Path To Net Zero