Malta In-Line Process Viscometer Market (2026-2032) | Value, Pricing Analysis, Restraints, Segments, Size, Trends, Share, Growth, Opportunities, Analysis, Revenue, Supply, Demand, Competition, Companies, Outlook, Investment Trends, Challenges, Forecast, Strategy, Competitive, Drivers, Industry, Consumer Insights, Strategic Insights, Segmentation
Market Forecast By Technology Type (Rotational, Torsional Oscillation, Vibration, Moving Piston), By Application (Industrial, Pharmaceutical, Food Processing, Chemical), By End User (Manufacturing Plants, Pharmaceutical Companies, Food and Beverage Manufacturers, Chemical Industries), By Product Type (Rotational Viscometers, Torsional Oscillation Viscometers, Vibration Viscometers, Moving Piston Viscometers) And Competitive Landscape
| Product Code: ETC12537984 | Publication Date: Apr 2025 | Updated Date: Apr 2026 | Product Type: Market Research Report | |
| Publisher: 6Wresearch | Author: Sachin Kumar Rai | No. of Pages: 65 | No. of Figures: 34 | No. of Tables: 19 |
Malta In-Line Process Viscometer Market Size (2020-2030)
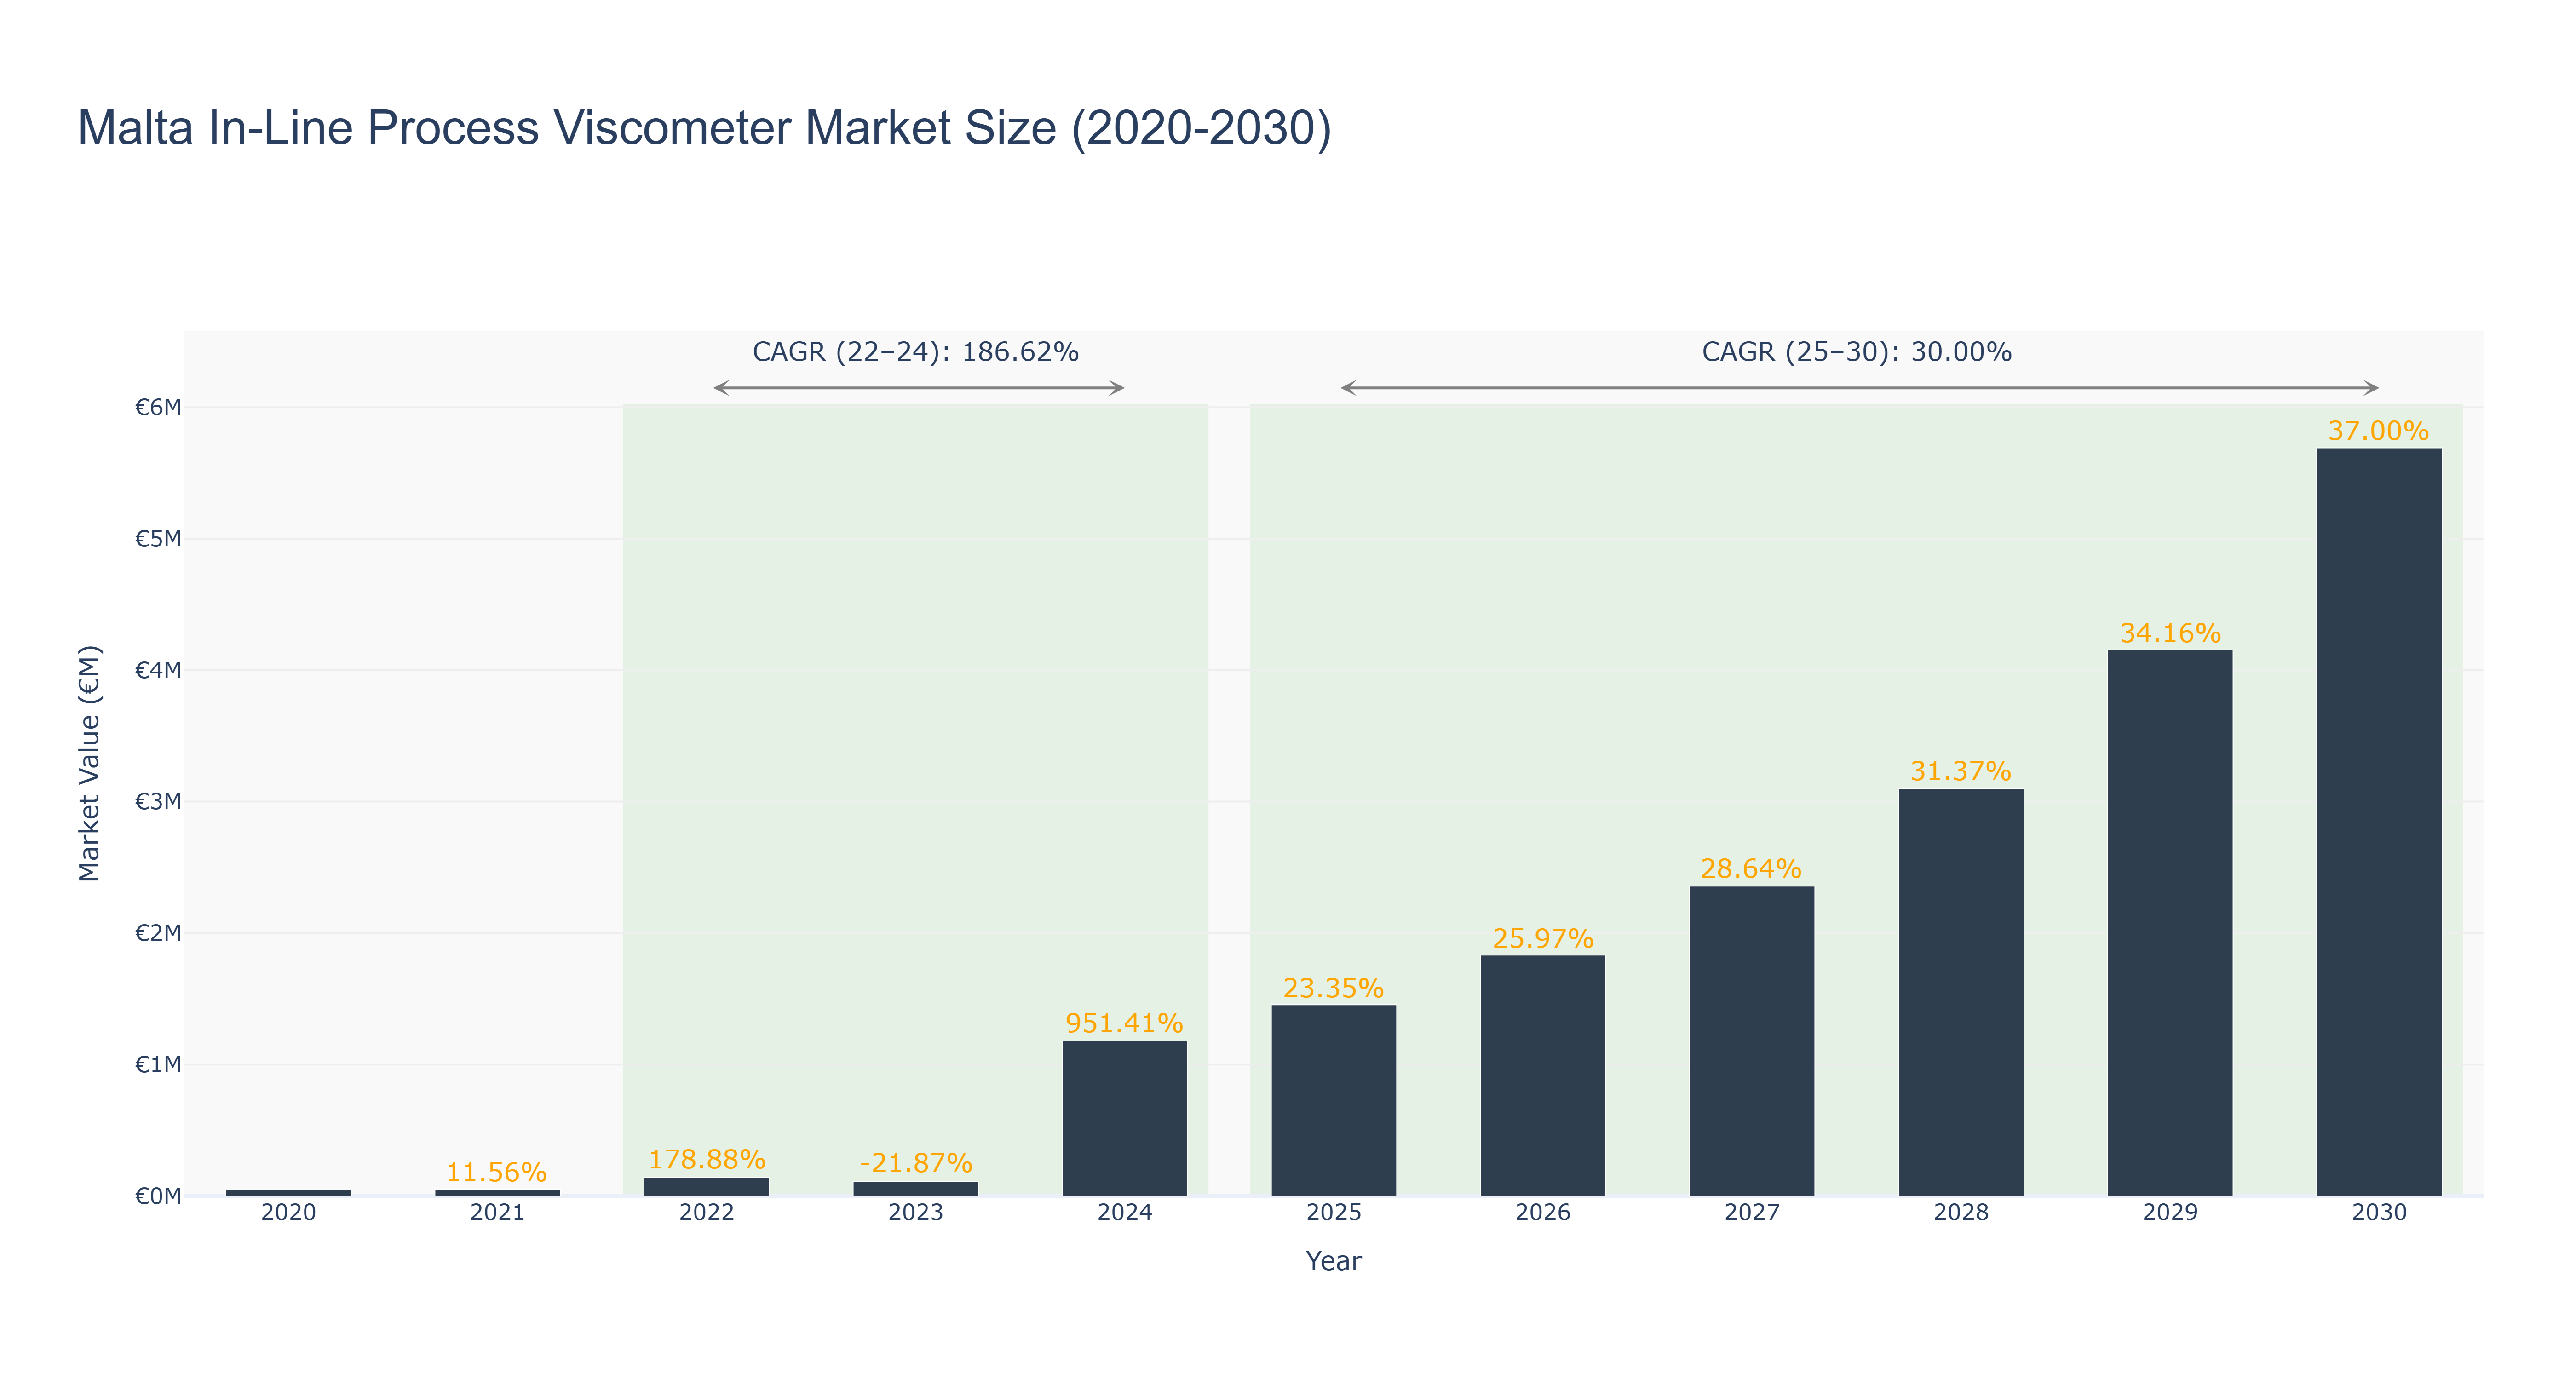
The Malta In-Line Process Viscometer Market has exhibited remarkable fluctuations, with the peak market size reaching €143.53 thousand in 2022, reflecting an extraordinary growth rate of 178.88%. However, the market contracted to €112.14 thousand in 2023, showing a decline of 21.87%. The subsequent growth trajectory is promising, as the market is projected to surge to €1.18 million in 2024, driven by increasing industrial automation and demand for precision measurement solutions, leading to a CAGR of 186.62% from 2022 to 2024. Looking ahead, the forecast period from 2025 to 2030 anticipates continued robust expansion, with projected market sizes escalating to €5.69 million by 2030, reflecting a CAGR of 30.00%. This growth is expected to be fueled by ongoing advancements in manufacturing technologies and heightened demand for quality control processes across various industries in Malta.
Malta In-Line Process Viscometer Market: Production & Trade Performance (2019-2025)
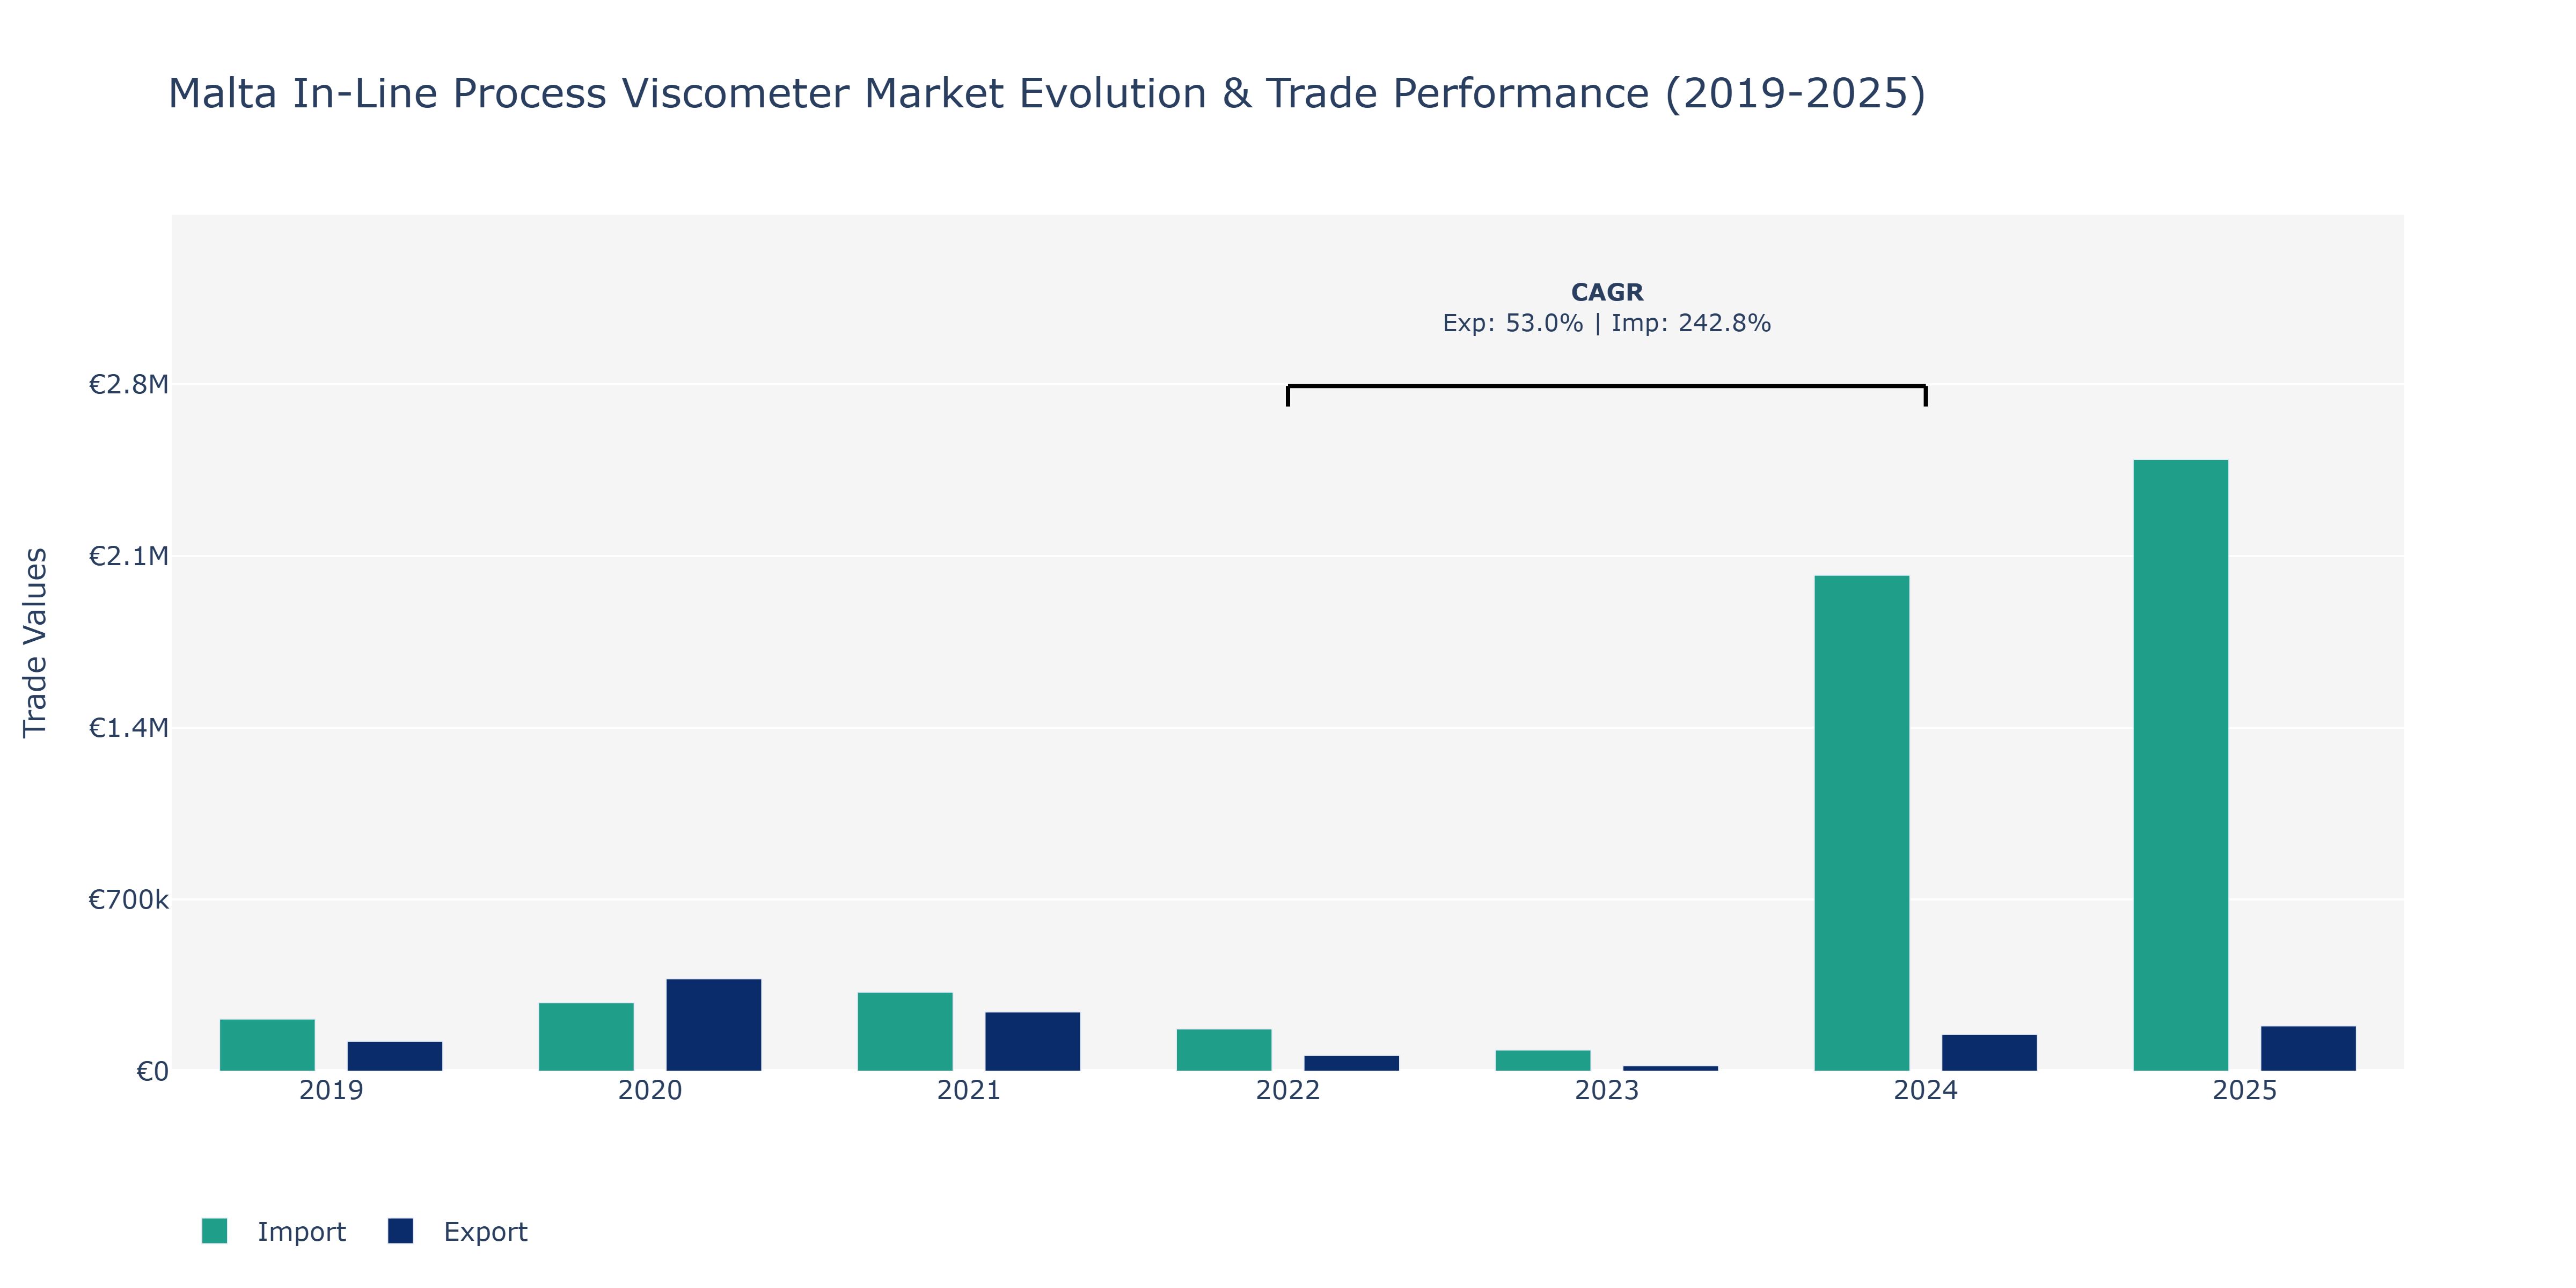
The Malta In-Line Process Viscometer market experienced notable fluctuations in both Exports and Imports from 2019 to 2025. In 2019, Exports stood at €121.31 thousand, showing a substantial increase to €376.71 thousand in 2020, likely due to increased demand or expanded market reach. However, a sharp decline was observed in 2021 to €241.81 thousand, which could be attributed to global economic factors impacting trade volume. Similarly, Imports followed a fluctuating trend, starting at €212.62 thousand in 2019, peaking at €2.02 million in 2024, indicating a significant surge possibly driven by technology upgrades or infrastructure projects. By 2025, both Exports and Imports showed a recovery, reaching €184.69 thousand and €2.49 million, respectively. The impressive CAGR for Imports from 2022 to 2024 at 242.77% points towards a rapid expansion of the market, potentially due to increased industrial activities or government initiatives pushing for modernization. These fluctuations emphasize the market's sensitivity to external factors, necessitating adaptive strategies to navigate uncertainties and capitalize on growth opportunities.
Key Highlights of the Report:
- Malta In-Line Process Viscometer Market Outlook
- Market Size of Malta In-Line Process Viscometer Market, 2025
- Forecast of Malta In-Line Process Viscometer Market, 2032
- Historical Data and Forecast of Malta In-Line Process Viscometer Revenues & Volume for the Period 2022 - 2032F
- Malta In-Line Process Viscometer Market Trend Evolution
- Malta In-Line Process Viscometer Market Drivers and Challenges
- Malta In-Line Process Viscometer Price Trends
- Malta In-Line Process Viscometer Porter's Five Forces
- Malta In-Line Process Viscometer Industry Life Cycle
- Historical Data and Forecast of Malta In-Line Process Viscometer Market Revenues & Volume By Technology Type for the Period 2022 - 2032F
- Historical Data and Forecast of Malta In-Line Process Viscometer Market Revenues & Volume By Rotational for the Period 2022 - 2032F
- Historical Data and Forecast of Malta In-Line Process Viscometer Market Revenues & Volume By Torsional Oscillation for the Period 2022 - 2032F
- Historical Data and Forecast of Malta In-Line Process Viscometer Market Revenues & Volume By Vibration for the Period 2022 - 2032F
- Historical Data and Forecast of Malta In-Line Process Viscometer Market Revenues & Volume By Moving Piston for the Period 2022 - 2032F
- Historical Data and Forecast of Malta In-Line Process Viscometer Market Revenues & Volume By Application for the Period 2022 - 2032F
- Historical Data and Forecast of Malta In-Line Process Viscometer Market Revenues & Volume By Industrial for the Period 2022 - 2032F
- Historical Data and Forecast of Malta In-Line Process Viscometer Market Revenues & Volume By Pharmaceutical for the Period 2022 - 2032F
- Historical Data and Forecast of Malta In-Line Process Viscometer Market Revenues & Volume By Food Processing for the Period 2022 - 2032F
- Historical Data and Forecast of Malta In-Line Process Viscometer Market Revenues & Volume By Chemical for the Period 2022 - 2032F
- Historical Data and Forecast of Malta In-Line Process Viscometer Market Revenues & Volume By End User for the Period 2022 - 2032F
- Historical Data and Forecast of Malta In-Line Process Viscometer Market Revenues & Volume By Manufacturing Plants for the Period 2022 - 2032F
- Historical Data and Forecast of Malta In-Line Process Viscometer Market Revenues & Volume By Pharmaceutical Companies for the Period 2022 - 2032F
- Historical Data and Forecast of Malta In-Line Process Viscometer Market Revenues & Volume By Food and Beverage Manufacturers for the Period 2022 - 2032F
- Historical Data and Forecast of Malta In-Line Process Viscometer Market Revenues & Volume By Chemical Industries for the Period 2022 - 2032F
- Historical Data and Forecast of Malta In-Line Process Viscometer Market Revenues & Volume By Product Type for the Period 2022 - 2032F
- Historical Data and Forecast of Malta In-Line Process Viscometer Market Revenues & Volume By Rotational Viscometers for the Period 2022 - 2032F
- Historical Data and Forecast of Malta In-Line Process Viscometer Market Revenues & Volume By Torsional Oscillation Viscometers for the Period 2022 - 2032F
- Historical Data and Forecast of Malta In-Line Process Viscometer Market Revenues & Volume By Vibration Viscometers for the Period 2022 - 2032F
- Historical Data and Forecast of Malta In-Line Process Viscometer Market Revenues & Volume By Moving Piston Viscometers for the Period 2022 - 2032F
- Malta In-Line Process Viscometer Import Export Trade Statistics
- Market Opportunity Assessment By Technology Type
- Market Opportunity Assessment By Application
- Market Opportunity Assessment By End User
- Market Opportunity Assessment By Product Type
- Malta In-Line Process Viscometer Top Companies Market Share
- Malta In-Line Process Viscometer Competitive Benchmarking By Technical and Operational Parameters
- Malta In-Line Process Viscometer Company Profiles
- Malta In-Line Process Viscometer Key Strategic Recommendations
Frequently Asked Questions About the Market Study (FAQs):
6Wresearch actively monitors the Malta In-Line Process Viscometer Market and publishes its comprehensive annual report, highlighting emerging trends, growth drivers, revenue analysis, and forecast outlook. Our insights help businesses to make data-backed strategic decisions with ongoing market dynamics. Our analysts track relevent industries related to the Malta In-Line Process Viscometer Market, allowing our clients with actionable intelligence and reliable forecasts tailored to emerging regional needs.
Yes, we provide customisation as per your requirements. To learn more, feel free to contact us on sales@6wresearch.com
1 Executive Summary |
2 Introduction |
2.1 Key Highlights of the Report |
2.2 Report Description |
2.3 Market Scope & Segmentation |
2.4 Research Methodology |
2.5 Assumptions |
3 Malta In-Line Process Viscometer Market Overview |
3.1 Malta Country Macro Economic Indicators |
3.2 Malta In-Line Process Viscometer Market Revenues & Volume, 2022 & 2032F |
3.3 Malta In-Line Process Viscometer Market - Industry Life Cycle |
3.4 Malta In-Line Process Viscometer Market - Porter's Five Forces |
3.5 Malta In-Line Process Viscometer Market Revenues & Volume Share, By Technology Type, 2022 & 2032F |
3.6 Malta In-Line Process Viscometer Market Revenues & Volume Share, By Application, 2022 & 2032F |
3.7 Malta In-Line Process Viscometer Market Revenues & Volume Share, By End User, 2022 & 2032F |
3.8 Malta In-Line Process Viscometer Market Revenues & Volume Share, By Product Type, 2022 & 2032F |
4 Malta In-Line Process Viscometer Market Dynamics |
4.1 Impact Analysis |
4.2 Market Drivers |
4.2.1 Increasing demand for process automation in industries leading to the adoption of in-line viscometers |
4.2.3 Technological advancements in in-line process viscometers improving accuracy and efficiency |
4.3 Market Restraints |
4.3.1 High initial investment required for installing in-line process viscometers |
4.3.2 Lack of awareness and understanding about the benefits of in-line viscometers among potential end-users |
4.3.3 Maintenance and calibration challenges leading to downtime and additional costs |
5 Malta In-Line Process Viscometer Market Trends |
6 Malta In-Line Process Viscometer Market, By Types |
6.1 Malta In-Line Process Viscometer Market, By Technology Type |
6.1.1 Overview and Analysis |
6.1.2 Malta In-Line Process Viscometer Market Revenues & Volume, By Technology Type, 2022 - 2032F |
6.1.3 Malta In-Line Process Viscometer Market Revenues & Volume, By Rotational, 2022 - 2032F |
6.1.4 Malta In-Line Process Viscometer Market Revenues & Volume, By Torsional Oscillation, 2022 - 2032F |
6.1.5 Malta In-Line Process Viscometer Market Revenues & Volume, By Vibration, 2022 - 2032F |
6.1.6 Malta In-Line Process Viscometer Market Revenues & Volume, By Moving Piston, 2022 - 2032F |
6.2 Malta In-Line Process Viscometer Market, By Application |
6.2.1 Overview and Analysis |
6.2.2 Malta In-Line Process Viscometer Market Revenues & Volume, By Industrial, 2022 - 2032F |
6.2.3 Malta In-Line Process Viscometer Market Revenues & Volume, By Pharmaceutical, 2022 - 2032F |
6.2.4 Malta In-Line Process Viscometer Market Revenues & Volume, By Food Processing, 2022 - 2032F |
6.2.5 Malta In-Line Process Viscometer Market Revenues & Volume, By Chemical, 2022 - 2032F |
6.3 Malta In-Line Process Viscometer Market, By End User |
6.3.1 Overview and Analysis |
6.3.2 Malta In-Line Process Viscometer Market Revenues & Volume, By Manufacturing Plants, 2022 - 2032F |
6.3.3 Malta In-Line Process Viscometer Market Revenues & Volume, By Pharmaceutical Companies, 2022 - 2032F |
6.3.4 Malta In-Line Process Viscometer Market Revenues & Volume, By Food and Beverage Manufacturers, 2022 - 2032F |
6.3.5 Malta In-Line Process Viscometer Market Revenues & Volume, By Chemical Industries, 2022 - 2032F |
6.4 Malta In-Line Process Viscometer Market, By Product Type |
6.4.1 Overview and Analysis |
6.4.2 Malta In-Line Process Viscometer Market Revenues & Volume, By Rotational Viscometers, 2022 - 2032F |
6.4.3 Malta In-Line Process Viscometer Market Revenues & Volume, By Torsional Oscillation Viscometers, 2022 - 2032F |
6.4.4 Malta In-Line Process Viscometer Market Revenues & Volume, By Vibration Viscometers, 2022 - 2032F |
6.4.5 Malta In-Line Process Viscometer Market Revenues & Volume, By Moving Piston Viscometers, 2022 - 2032F |
7 Malta In-Line Process Viscometer Market Import-Export Trade Statistics |
7.1 Malta In-Line Process Viscometer Market Export to Major Countries |
7.2 Malta In-Line Process Viscometer Market Imports from Major Countries |
8 Malta In-Line Process Viscometer Market Key Performance Indicators |
8.1 Percentage increase in the number of industries adopting in-line process viscometers |
8.2 Reduction in production downtime due to viscosity-related issues |
8.3 Number of new technological innovations in the in-line viscometer market |
9 Malta In-Line Process Viscometer Market - Opportunity Assessment |
9.1 Malta In-Line Process Viscometer Market Opportunity Assessment, By Technology Type, 2022 & 2032F |
9.2 Malta In-Line Process Viscometer Market Opportunity Assessment, By Application, 2022 & 2032F |
9.3 Malta In-Line Process Viscometer Market Opportunity Assessment, By End User, 2022 & 2032F |
9.4 Malta In-Line Process Viscometer Market Opportunity Assessment, By Product Type, 2022 & 2032F |
10 Malta In-Line Process Viscometer Market - Competitive Landscape |
10.1 Malta In-Line Process Viscometer Market Revenue Share, By Companies, 2025 |
10.2 Malta In-Line Process Viscometer Market Competitive Benchmarking, By Operating and Technical Parameters |
11 Company Profiles |
12 Recommendations |
13 Disclaimer |
Export potential assessment - trade Analytics for 2030
Export potential enables firms to identify high-growth global markets with greater confidence by combining advanced trade intelligence with a structured quantitative methodology. The framework analyzes emerging demand trends and country-level import patterns while integrating macroeconomic and trade datasets such as GDP and population forecasts, bilateral import–export flows, tariff structures, elasticity differentials between developed and developing economies, geographic distance, and import demand projections. Using weighted trade values from 2020–2024 as the base period to project country-to-country export potential for 2030, these inputs are operationalized through calculated drivers such as gravity model parameters, tariff impact factors, and projected GDP per-capita growth. Through an analysis of hidden potentials, demand hotspots, and market conditions that are most favorable to success, this method enables firms to focus on target countries, maximize returns, and global expansion with data, backed by accuracy.
By factoring in the projected importer demand gap that is currently unmet and could be potential opportunity, it identifies the potential for the Exporter (Country) among 190 countries, against the general trade analysis, which identifies the biggest importer or exporter.
To discover high-growth global markets and optimize your business strategy:
Click Here
Pricing
- Single User License$ 1,995
- Department License$ 2,400
- Site License$ 3,120
- Global License$ 3,795

Search
Thought Leadership and Analyst Meet


Our Clients
Latest Reports
- Canada Cloud CFD Market (2026-2032) | Size & Revenue, Industry, Growth, Competitive Landscape, Forecast, Segmentation, Value, Outlook, Trends, Share, Analysis, Companies
- Taiwan Food Delivery Platform Market (2026-2032) | Companies, Outlook, Analysis, Trends, Value, Revenue, Segmentation, Share, Forecast, Competitive Landscape, Growth, Size & Forecast
- United Kingdom (UK) Long-term Care Insurance Market (2026-2032) | Growth, Share, Consumer Insights, Drivers, Opportunities, Competition, Pricing Analysis, Segments, Restraints, Companies, Competitive, Value, Outlook, Size, Demand, Analysis, Challenges, Strategic Insights, Investment Trends, Revenue, Trends, Supply, Forecast
- United Kingdom (UK) Long Term Care Market (2026-2032) | Companies, Outlook, Analysis, Trends, Value, Revenue, Segmentation, Share, Forecast, Competitive Landscape, Growth, Size & Forecast
- Iraq Insulation and Waterproofing Market (2026-2032) | Outlook, Drivers, Growth, Size, Share, Industry, Revenue, Trends, Demand, Competitive, Strategic Insights, Opportunities, Segments, Companies, Challenges, Strategy, Consumer Insights, Analysis, Investment Trends, Value, Segmentation, Forecast, Restraints
- India Switchgear Market Outlook (2026-2032) | Size, Share, Trends, Growth, Revenue, Forecast, Analysis, Value, Outlook
- Pakistan Contraceptive Implants Market (2025-2031) | Demand, Growth, Size, Share, Industry, Pricing Analysis, Competitive, Strategic Insights, Strategy, Consumer Insights, Analysis, Investment Trends, Opportunities, Revenue, Segments, Value, Segmentation, Supply, Forecast, Restraints, Outlook, Competition, Drivers, Trends, Companies, Challenges
- Sri Lanka Packaging Market (2026-2032) | Outlook, Competition, Drivers, Trends, Demand, Pricing Analysis, Competitive, Strategic Insights, Companies, Challenges, Strategy, Consumer Insights, Analysis, Investment Trends, Opportunities, Growth, Size, Share, Industry, Revenue, Segments, Value, Segmentation, Supply, Forecast, Restraints
- India Kids Watches Market (2026-2032) | Strategy, Consumer Insights, Analysis, Investment Trends, Opportunities, Growth, Size, Share, Industry, Revenue, Segments, Value, Segmentation, Supply, Forecast, Restraints, Outlook, Competition, Drivers, Trends, Demand, Pricing Analysis, Competitive, Strategic Insights, Companies, Challenges
- Saudi Arabia Core Assurance Service Market (2025-2031) | Strategy, Consumer Insights, Analysis, Investment Trends, Opportunities, Growth, Size, Share, Industry, Revenue, Segments, Value, Segmentation, Supply, Forecast, Restraints, Outlook, Competition, Drivers, Trends, Demand, Pricing Analysis, Competitive, Strategic Insights, Companies, Challenges
Industry Events and Analyst Meet

India EV Show 2026

EV tech India Expo 2026

Auto Tech Asia 2026

Battery Tech India 2026

Smart Production Solutions Guangzhou 2026
Whitepaper
- Middle East & Africa Commercial Security Market Click here to view more.
- Middle East & Africa Fire Safety Systems & Equipment Market Click here to view more.
- GCC Drone Market Click here to view more.
- Middle East Lighting Fixture Market Click here to view more.
- GCC Physical & Perimeter Security Market Click here to view more.
6WResearch In News
- Doha a strategic location for EV manufacturing hub: IPA Qatar
- Demand for luxury TVs surging in the GCC, says Samsung
- Empowering Growth: The Thriving Journey of Bangladesh’s Cable Industry
- Demand for luxury TVs surging in the GCC, says Samsung
- Video call with a traditional healer? Once unthinkable, it’s now common in South Africa
- Intelligent Buildings To Smooth GCC’s Path To Net Zero