Malta Paper Products Market (2026-2032) | Companies, Industry, Trends, Growth, Segmentation, Revenue, Analysis, Size, Forecast, Outlook, Share & Value
Market Forecast By Type (Converted Paper Products, Unfinished Paper, Pulp Mills), By Applications (Writing Paper, Magazine Paper, Packaging Paper, Sanitary Paper, Other) And Competitive Landscape
| Product Code: ETC5374861 | Publication Date: Nov 2023 | Updated Date: Apr 2026 | Product Type: Market Research Report | |
| Publisher: 6Wresearch | Author: Ravi Bhandari | No. of Pages: 60 | No. of Figures: 30 | No. of Tables: 5 |
Malta Paper Products Market Size (2020-2030)
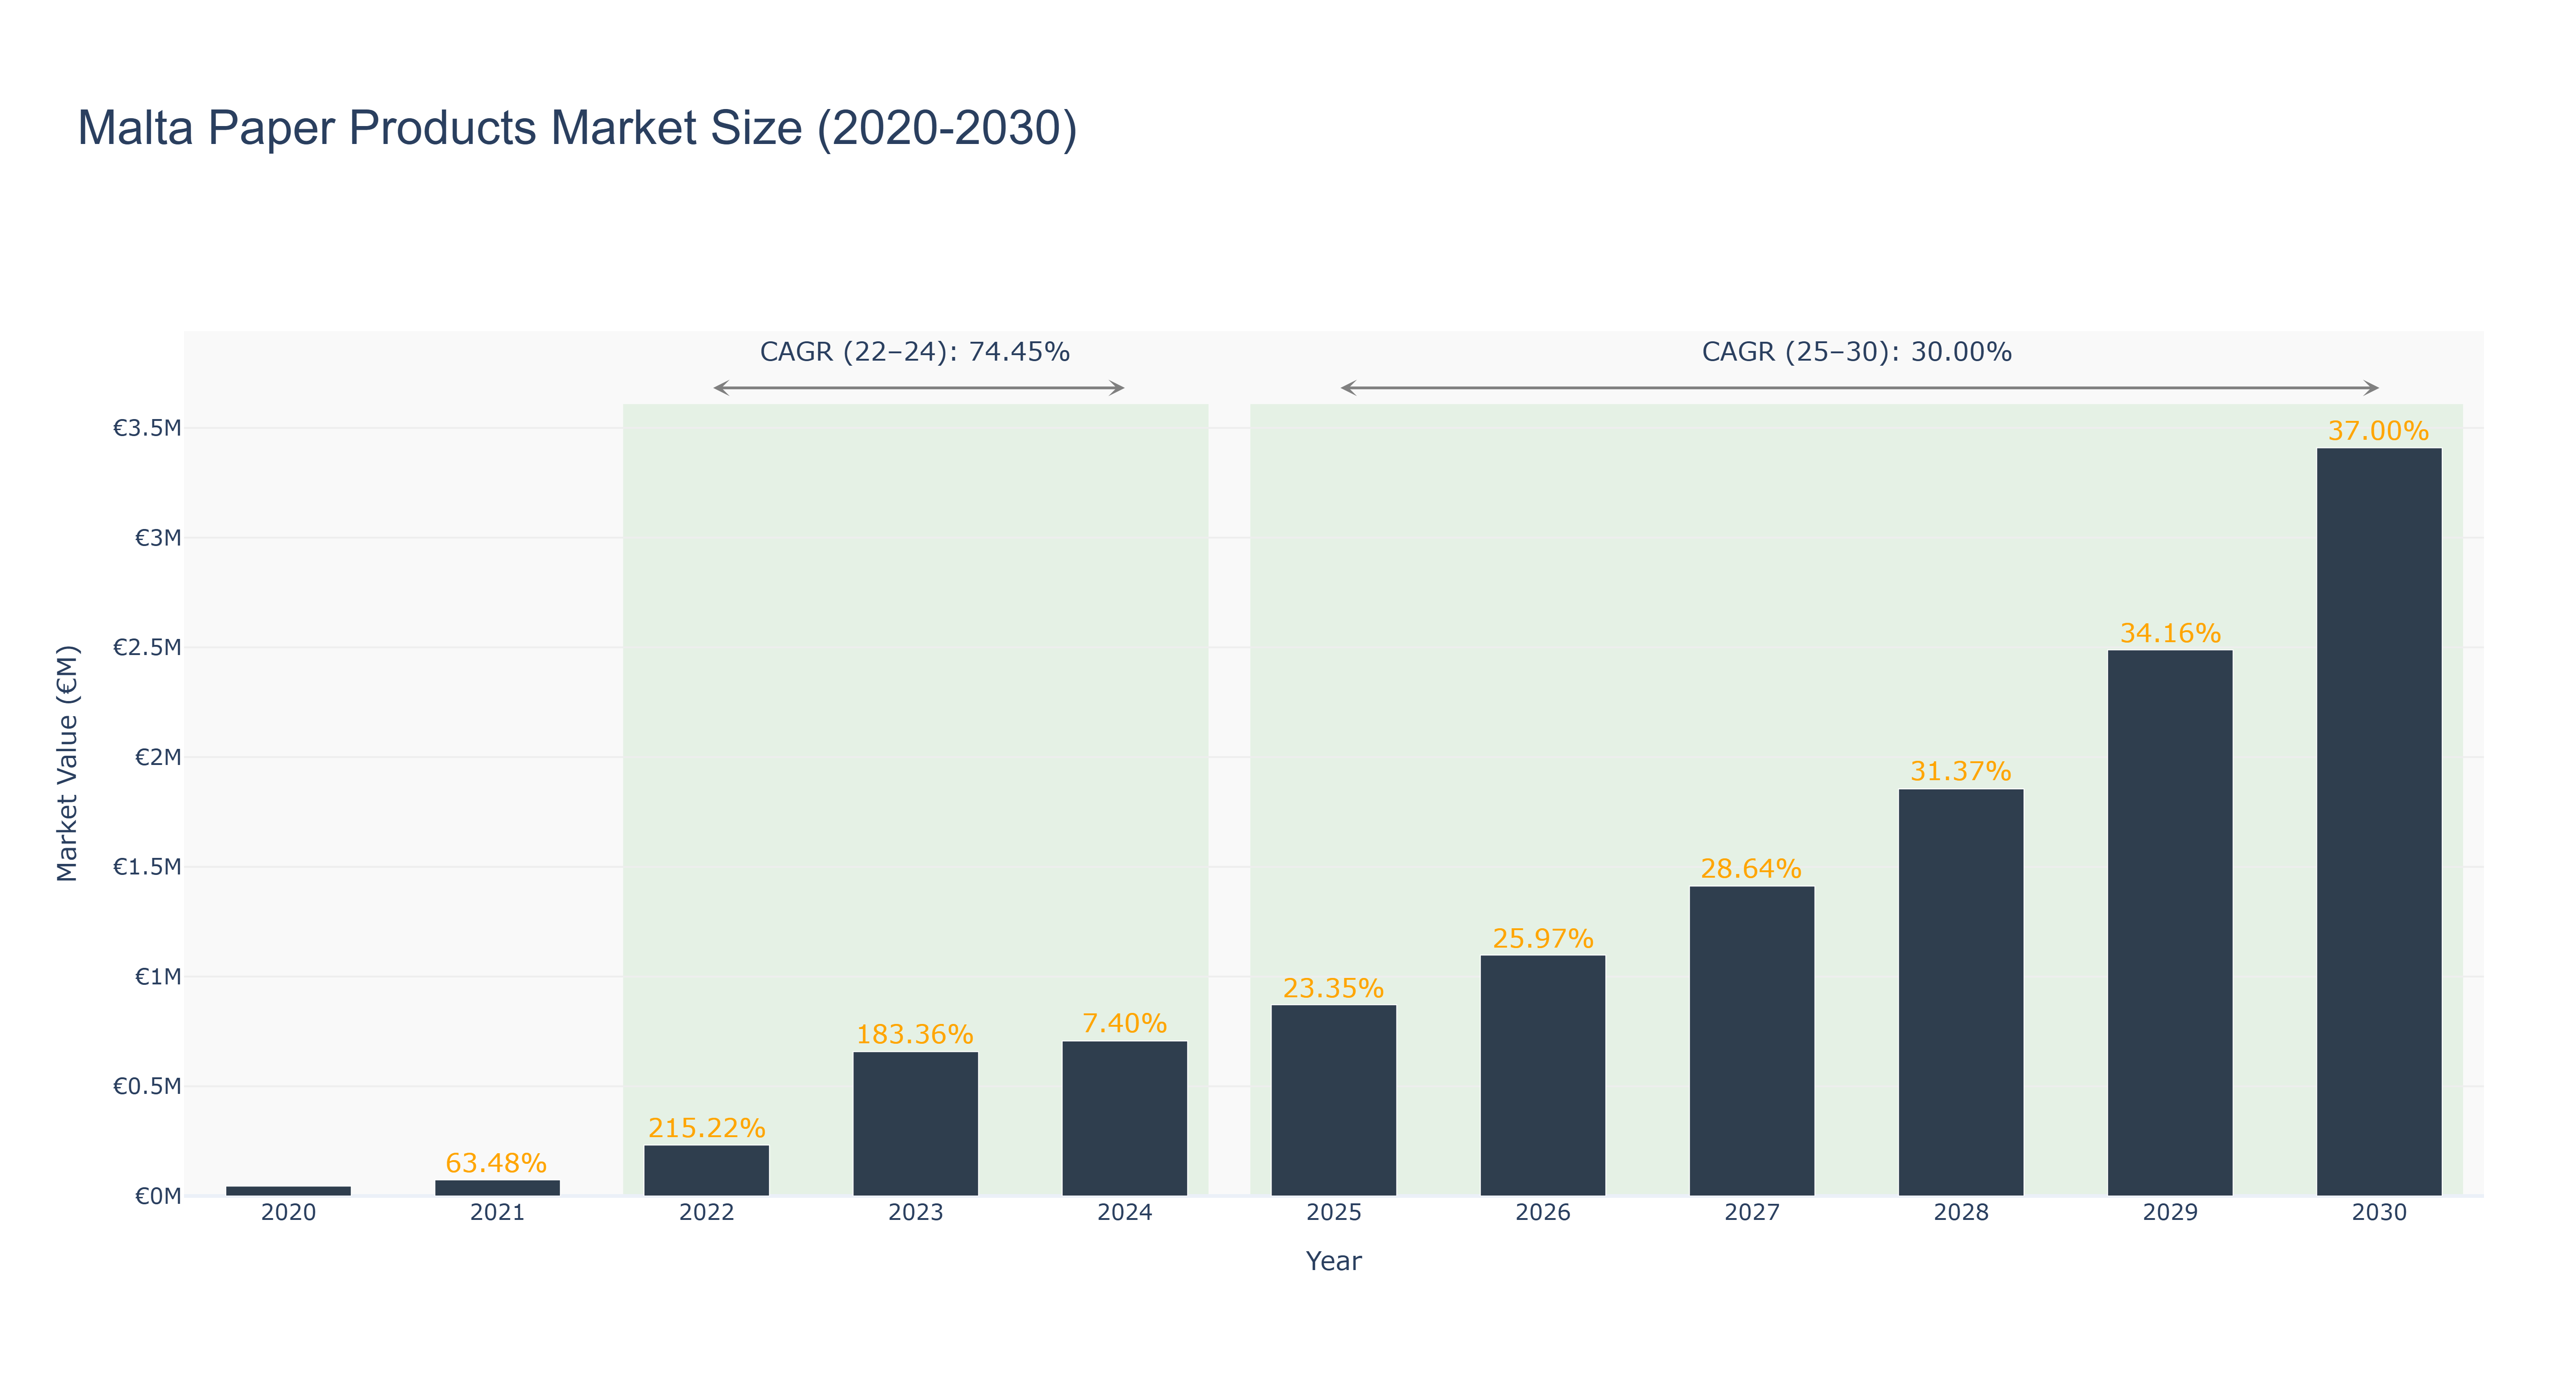
The Malta Paper Products Market has demonstrated remarkable growth, peaking at €657.68 thousand in 2023, following substantial increases from €232.10 thousand in 2022 and €73.63 thousand in 2021. This period (2022-2024) exhibits an impressive actual CAGR of 74.45%, driven by heightened demand for sustainable packaging solutions and increased consumer awareness of environmental impacts. As we transition into the forecasted period (2025-2030), the market is projected to continue its robust expansion, with expected market sizes reaching €3.41 million by 2030, reflecting a CAGR of 30.00%. This growth is anticipated to be fueled by ongoing innovations in eco-friendly materials and the implementation of stricter environmental regulations. While no specific upcoming projects have been highlighted, the increasing investment in green technologies and sustainability initiatives serves as a critical macro driver for the future development of the Malta Paper Products Market.
Malta Paper Products Market: Production & Trade Performance (2019-2025)
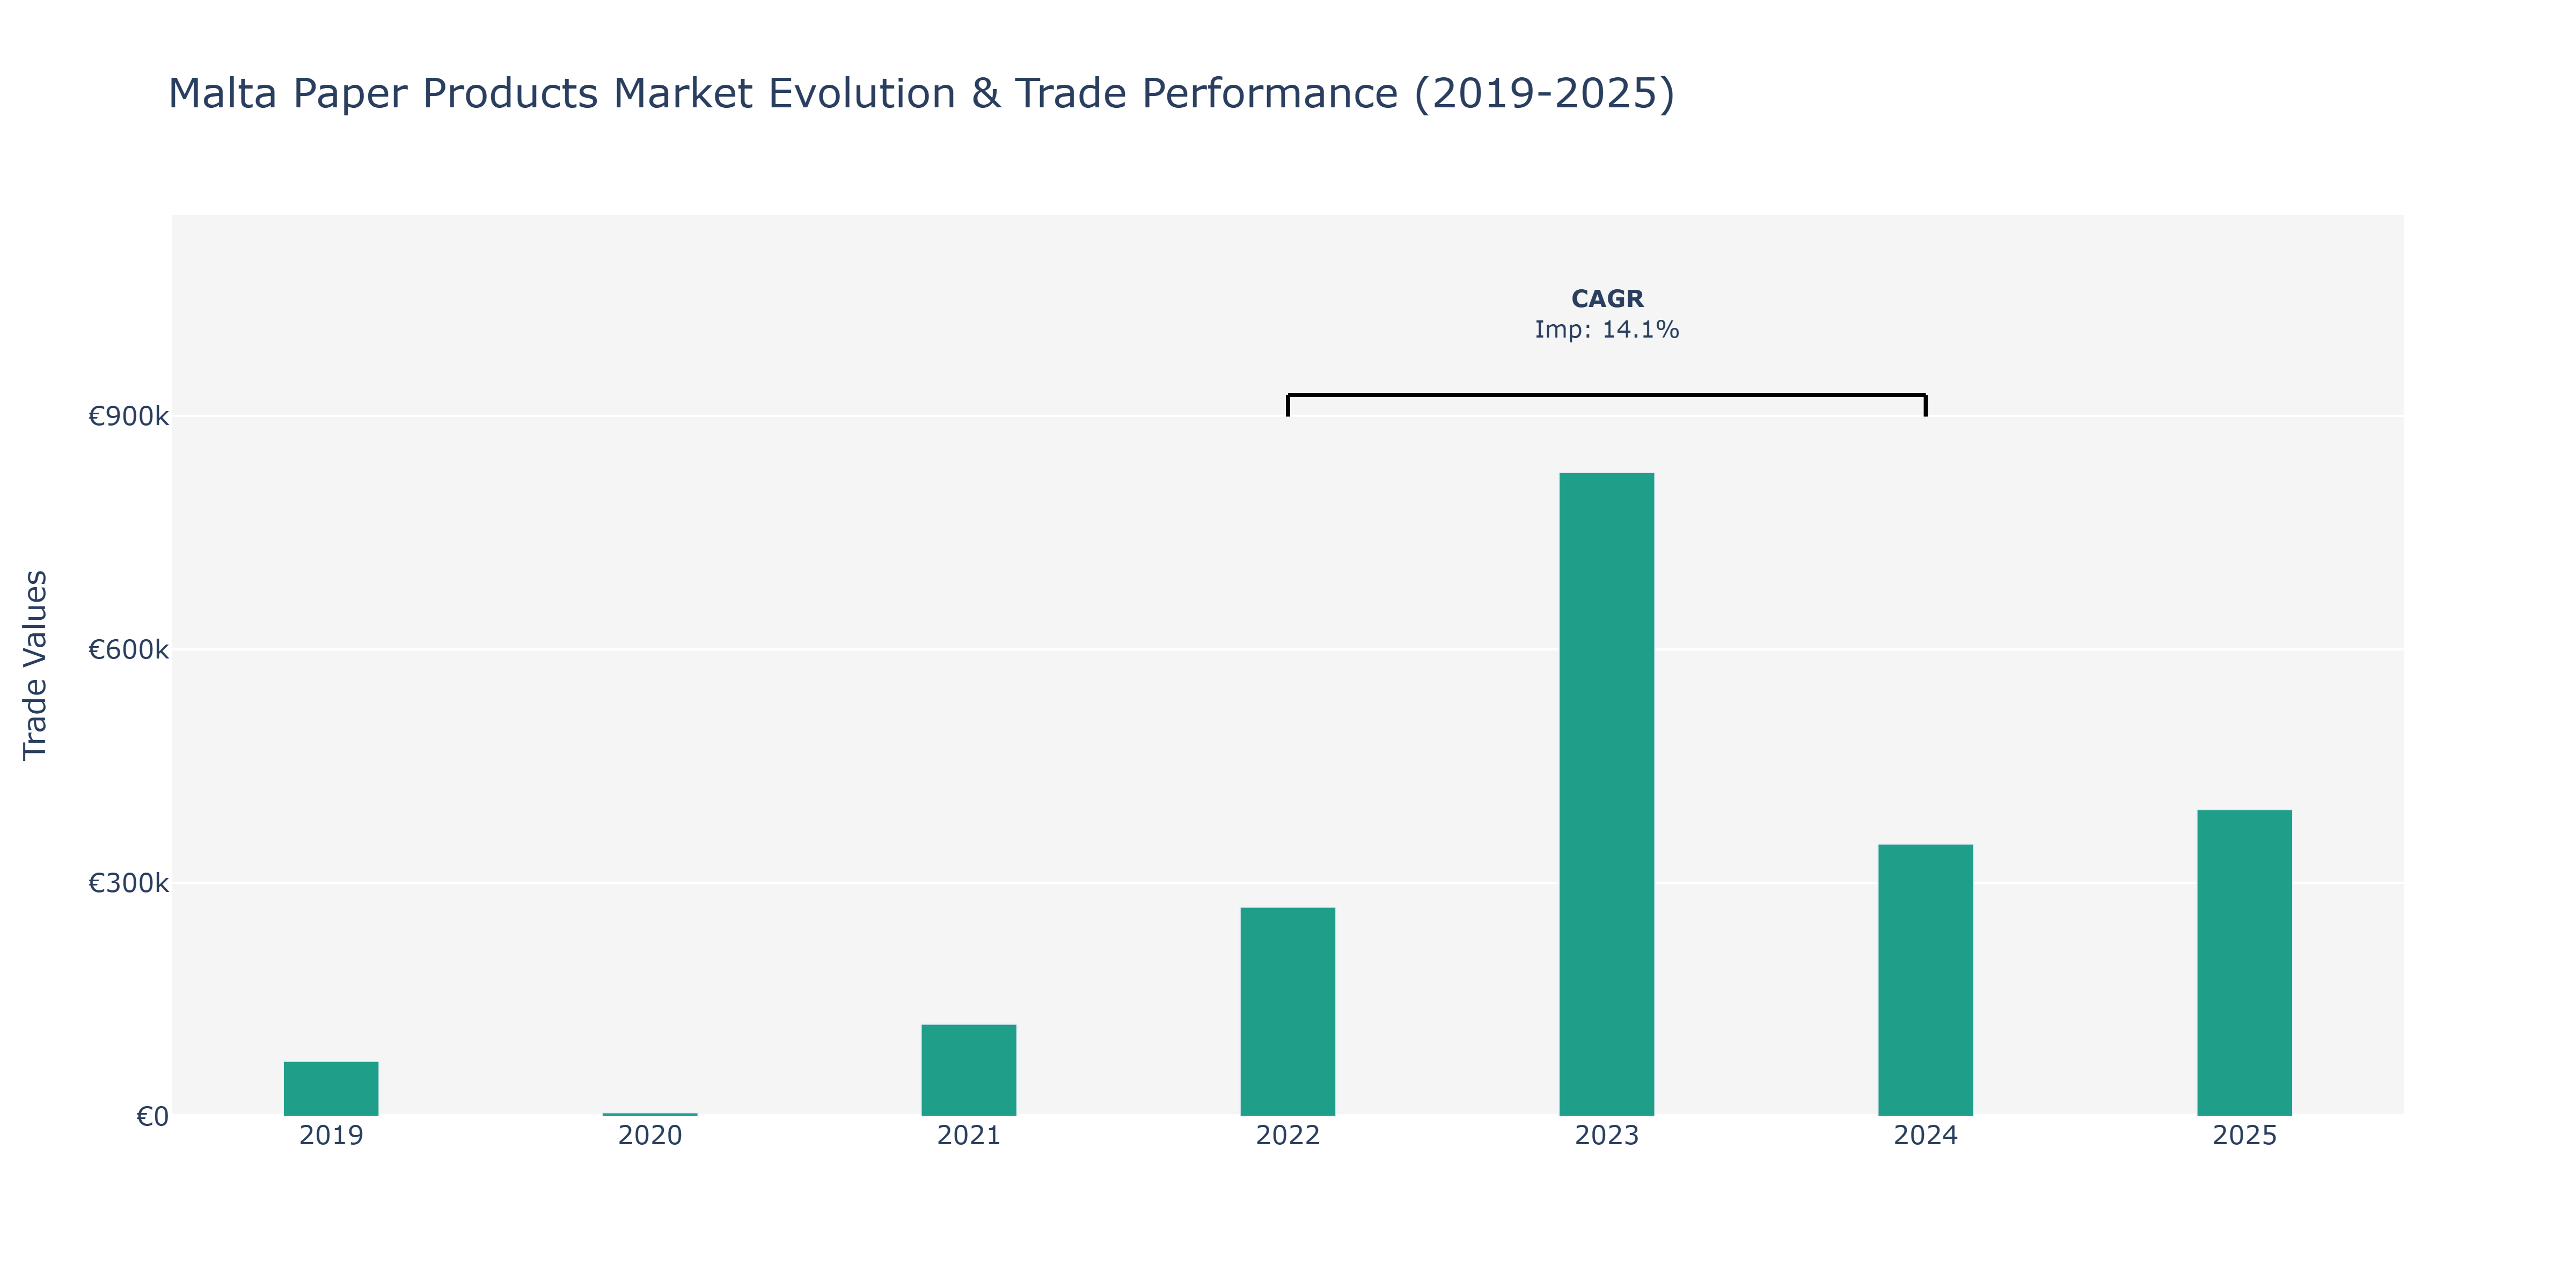
The Imports in the Malta Paper Products Market displayed notable fluctuations over the period from 2019 to 2025. In 2019, imports were at €70.54 thousand, sharply dropping to €4.53 thousand in 2020 due to potential disruptions like trade restrictions or economic challenges. However, a substantial rebound occurred in 2021 with imports surging to €118.19 thousand, indicating potential recovery and increased demand for paper products. The peak point came in 2023 when imports reached €827.49 thousand, showcasing a significant spike likely driven by heightened consumer consumption, improved economic conditions, or strategic market expansion initiatives. Despite a slight decline in 2024 to €349.76 thousand, the market remained robust compared to earlier years. The trend reversed in 2025, with imports increasing to €394.13 thousand, potentially indicating a renewed growth trajectory supported by evolving consumer preferences or enhanced product offerings in the paper products sector. The overall fluctuations in imports reflect the market's sensitivity to economic conditions, consumer behavior, and industry competitiveness, highlighting the need for market players to adapt strategies to meet changing demand dynamics in the paper products sector.
Key Highlights of the Report:
- Malta Paper Products Market Outlook
- Market Size of Malta Paper Products Market, 2025
- Forecast of Malta Paper Products Market, 2032
- Historical Data and Forecast of Malta Paper Products Revenues & Volume for the Period 2022 - 2032F
- Malta Paper Products Market Trend Evolution
- Malta Paper Products Market Drivers and Challenges
- Malta Paper Products Price Trends
- Malta Paper Products Porter`s Five Forces
- Malta Paper Products Industry Life Cycle
- Historical Data and Forecast of Malta Paper Products Market Revenues & Volume By Type for the Period 2022 - 2032F
- Historical Data and Forecast of Malta Paper Products Market Revenues & Volume By Converted Paper Products for the Period 2022 - 2032F
- Historical Data and Forecast of Malta Paper Products Market Revenues & Volume By Unfinished Paper for the Period 2022 - 2032F
- Historical Data and Forecast of Malta Paper Products Market Revenues & Volume By Pulp Mills for the Period 2022 - 2032F
- Historical Data and Forecast of Malta Paper Products Market Revenues & Volume By Applications for the Period 2022 - 2032F
- Historical Data and Forecast of Malta Paper Products Market Revenues & Volume By Writing Paper for the Period 2022 - 2032F
- Historical Data and Forecast of Malta Paper Products Market Revenues & Volume By Magazine Paper for the Period 2022 - 2032F
- Historical Data and Forecast of Malta Paper Products Market Revenues & Volume By Packaging Paper for the Period 2022 - 2032F
- Historical Data and Forecast of Malta Paper Products Market Revenues & Volume By Sanitary Paper for the Period 2022 - 2032F
- Historical Data and Forecast of Malta Paper Products Market Revenues & Volume By Other for the Period 2022 - 2032F
- Malta Paper Products Import Export Trade Statistics
- Market Opportunity Assessment By Type
- Market Opportunity Assessment By Applications
- Malta Paper Products Top Companies Market Share
- Malta Paper Products Competitive Benchmarking By Technical and Operational Parameters
- Malta Paper Products Company Profiles
- Malta Paper Products Key Strategic Recommendations
Frequently Asked Questions About the Market Study (FAQs):
6Wresearch actively monitors the Malta Paper Products Market and publishes its comprehensive annual report, highlighting emerging trends, growth drivers, revenue analysis, and forecast outlook. Our insights help businesses to make data-backed strategic decisions with ongoing market dynamics. Our analysts track relevent industries related to the Malta Paper Products Market, allowing our clients with actionable intelligence and reliable forecasts tailored to emerging regional needs.
Yes, we provide customisation as per your requirements. To learn more, feel free to contact us on sales@6wresearch.com
1 Executive Summary |
2 Introduction |
2.1 Key Highlights of the Report |
2.2 Report Description |
2.3 Market Scope & Segmentation |
2.4 Research Methodology |
2.5 Assumptions |
3 Malta Paper Products Market Overview |
3.1 Malta Country Macro Economic Indicators |
3.2 Malta Paper Products Market Revenues & Volume, 2022 & 2032F |
3.3 Malta Paper Products Market - Industry Life Cycle |
3.4 Malta Paper Products Market - Porter's Five Forces |
3.5 Malta Paper Products Market Revenues & Volume Share, By Type, 2022 & 2032F |
3.6 Malta Paper Products Market Revenues & Volume Share, By Applications, 2022 & 2032F |
4 Malta Paper Products Market Dynamics |
4.1 Impact Analysis |
4.2 Market Drivers |
4.2.1 Growing awareness and emphasis on sustainability and eco-friendly products |
4.2.2 Increasing demand for packaging solutions in various industries |
4.2.3 Government initiatives promoting the use of recycled paper products |
4.3 Market Restraints |
4.3.1 Fluctuating raw material prices impacting production costs |
4.3.2 Intense competition from digital alternatives impacting paper usage |
4.3.3 Environmental concerns leading to reduced paper consumption |
5 Malta Paper Products Market Trends |
6 Malta Paper Products Market Segmentations |
6.1 Malta Paper Products Market, By Type |
6.1.1 Overview and Analysis |
6.1.2 Malta Paper Products Market Revenues & Volume, By Converted Paper Products, 2022 - 2032F |
6.1.3 Malta Paper Products Market Revenues & Volume, By Unfinished Paper, 2022 - 2032F |
6.1.4 Malta Paper Products Market Revenues & Volume, By Pulp Mills, 2022 - 2032F |
6.2 Malta Paper Products Market, By Applications |
6.2.1 Overview and Analysis |
6.2.2 Malta Paper Products Market Revenues & Volume, By Writing Paper, 2022 - 2032F |
6.2.3 Malta Paper Products Market Revenues & Volume, By Magazine Paper, 2022 - 2032F |
6.2.4 Malta Paper Products Market Revenues & Volume, By Packaging Paper, 2022 - 2032F |
6.2.5 Malta Paper Products Market Revenues & Volume, By Sanitary Paper, 2022 - 2032F |
6.2.6 Malta Paper Products Market Revenues & Volume, By Other, 2022 - 2032F |
7 Malta Paper Products Market Import-Export Trade Statistics |
7.1 Malta Paper Products Market Export to Major Countries |
7.2 Malta Paper Products Market Imports from Major Countries |
8 Malta Paper Products Market Key Performance Indicators |
8.1 Percentage of recycled content used in paper products |
8.2 Customer satisfaction and loyalty metrics |
8.3 Adoption rate of eco-friendly packaging solutions |
8.4 Percentage of market share held by sustainable paper product manufacturers |
8.5 Rate of growth in demand for paper products in key industries |
9 Malta Paper Products Market - Opportunity Assessment |
9.1 Malta Paper Products Market Opportunity Assessment, By Type, 2022 & 2032F |
9.2 Malta Paper Products Market Opportunity Assessment, By Applications, 2022 & 2032F |
10 Malta Paper Products Market - Competitive Landscape |
10.1 Malta Paper Products Market Revenue Share, By Companies, 2025 |
10.2 Malta Paper Products Market Competitive Benchmarking, By Operating and Technical Parameters |
11 Company Profiles |
12 Recommendations | 13 Disclaimer |
Global Go To Market Strategy - 2030
Export potential enables firms to identify high-growth global markets with greater confidence by combining advanced trade intelligence with a structured quantitative methodology. The framework analyzes emerging demand trends and country-level import patterns while integrating macroeconomic and trade datasets such as GDP and population forecasts, bilateral import–export flows, tariff structures, elasticity differentials between developed and developing economies, geographic distance, and import demand projections. Using weighted trade values from 2020–2024 as the base period to project country-to-country export potential for 2030, these inputs are operationalized through calculated drivers such as gravity model parameters, tariff impact factors, and projected GDP per-capita growth. Through an analysis of hidden potentials, demand hotspots, and market conditions that are most favorable to success, this method enables firms to focus on target countries, maximize returns, and global expansion with data, backed by accuracy.
By factoring in the projected importer demand gap that is currently unmet and could be potential opportunity, it identifies the potential for the Exporter (Country) among 190 countries, against the general trade analysis, which identifies the biggest importer or exporter.
To discover high-growth global markets and optimize your business strategy:
Click Here
Pricing
- Single User License$ 1,995
- Department License$ 2,400
- Site License$ 3,120
- Global License$ 3,795

Leadership Perspectives from Industry Events
Search
Thought Leadership and Analyst Meet


Our Clients
6WResearch In News
- India Air Conditioner Market Set for Strong Rebound in 2026 After Weather-Led Correction and GST-Driven Recovery: 6Wresearch
- ADAS in India: How Automatic Emergency Braking, Blind Spot Detection & Driver Monitoring are Transforming Road Safety
- Doha a strategic location for EV manufacturing hub: IPA Qatar
- Demand for luxury TVs surging in the GCC, says Samsung
- Empowering Growth: The Thriving Journey of Bangladesh’s Cable Industry
- Demand for luxury TVs surging in the GCC, says Samsung
Latest Reports
- Nicaragua RPG Gaming Market (2026-2032)
- New Zealand RPG Gaming Market (2026-2032)
- Netherlands RPG Gaming Market (2026-2032)
- Nauru RPG Gaming Market (2026-2032)
- Namibia RPG Gaming Market (2026-2032)
- Mozambique RPG Gaming Market (2026-2032)
- Montenegro RPG Gaming Market (2026-2032)
- Mongolia RPG Gaming Market (2026-2032)
- Monaco RPG Gaming Market (2026-2032)
- Micronesia RPG Gaming Market (2026-2032)
Industry Events and Analyst Meet

HIMTEX 2026

India Refining Summit 2026

India EV Show 2026

EV tech India Expo 2026

Auto Tech Asia 2026
Whitepaper
- Middle East & Africa Commercial Security Market Click here to view more.
- Middle East & Africa Fire Safety Systems & Equipment Market Click here to view more.
- GCC Drone Market Click here to view more.
- Middle East Lighting Fixture Market Click here to view more.
- GCC Physical & Perimeter Security Market Click here to view more.