Malta Polymerization Initiators Market (2026-2032) | Segmentation, Trends, Companies, Analysis, Growth, Forecast, Industry, Size, Revenue, Outlook, Value & Share
Market Forecast By Type (Peroxide, Persulfate, Azo Compounds, Others), By Application (Polyethylene, Polypropylene, PVC, Polystyrene, ABS, Others) And Competitive Landscape
| Product Code: ETC5308095 | Publication Date: Nov 2023 | Updated Date: Apr 2026 | Product Type: Market Research Report | |
| Publisher: 6Wresearch | Author: Ravi Bhandari | No. of Pages: 60 | No. of Figures: 30 | No. of Tables: 5 |
Malta Polymerization Initiators Market Size (2020-2030)
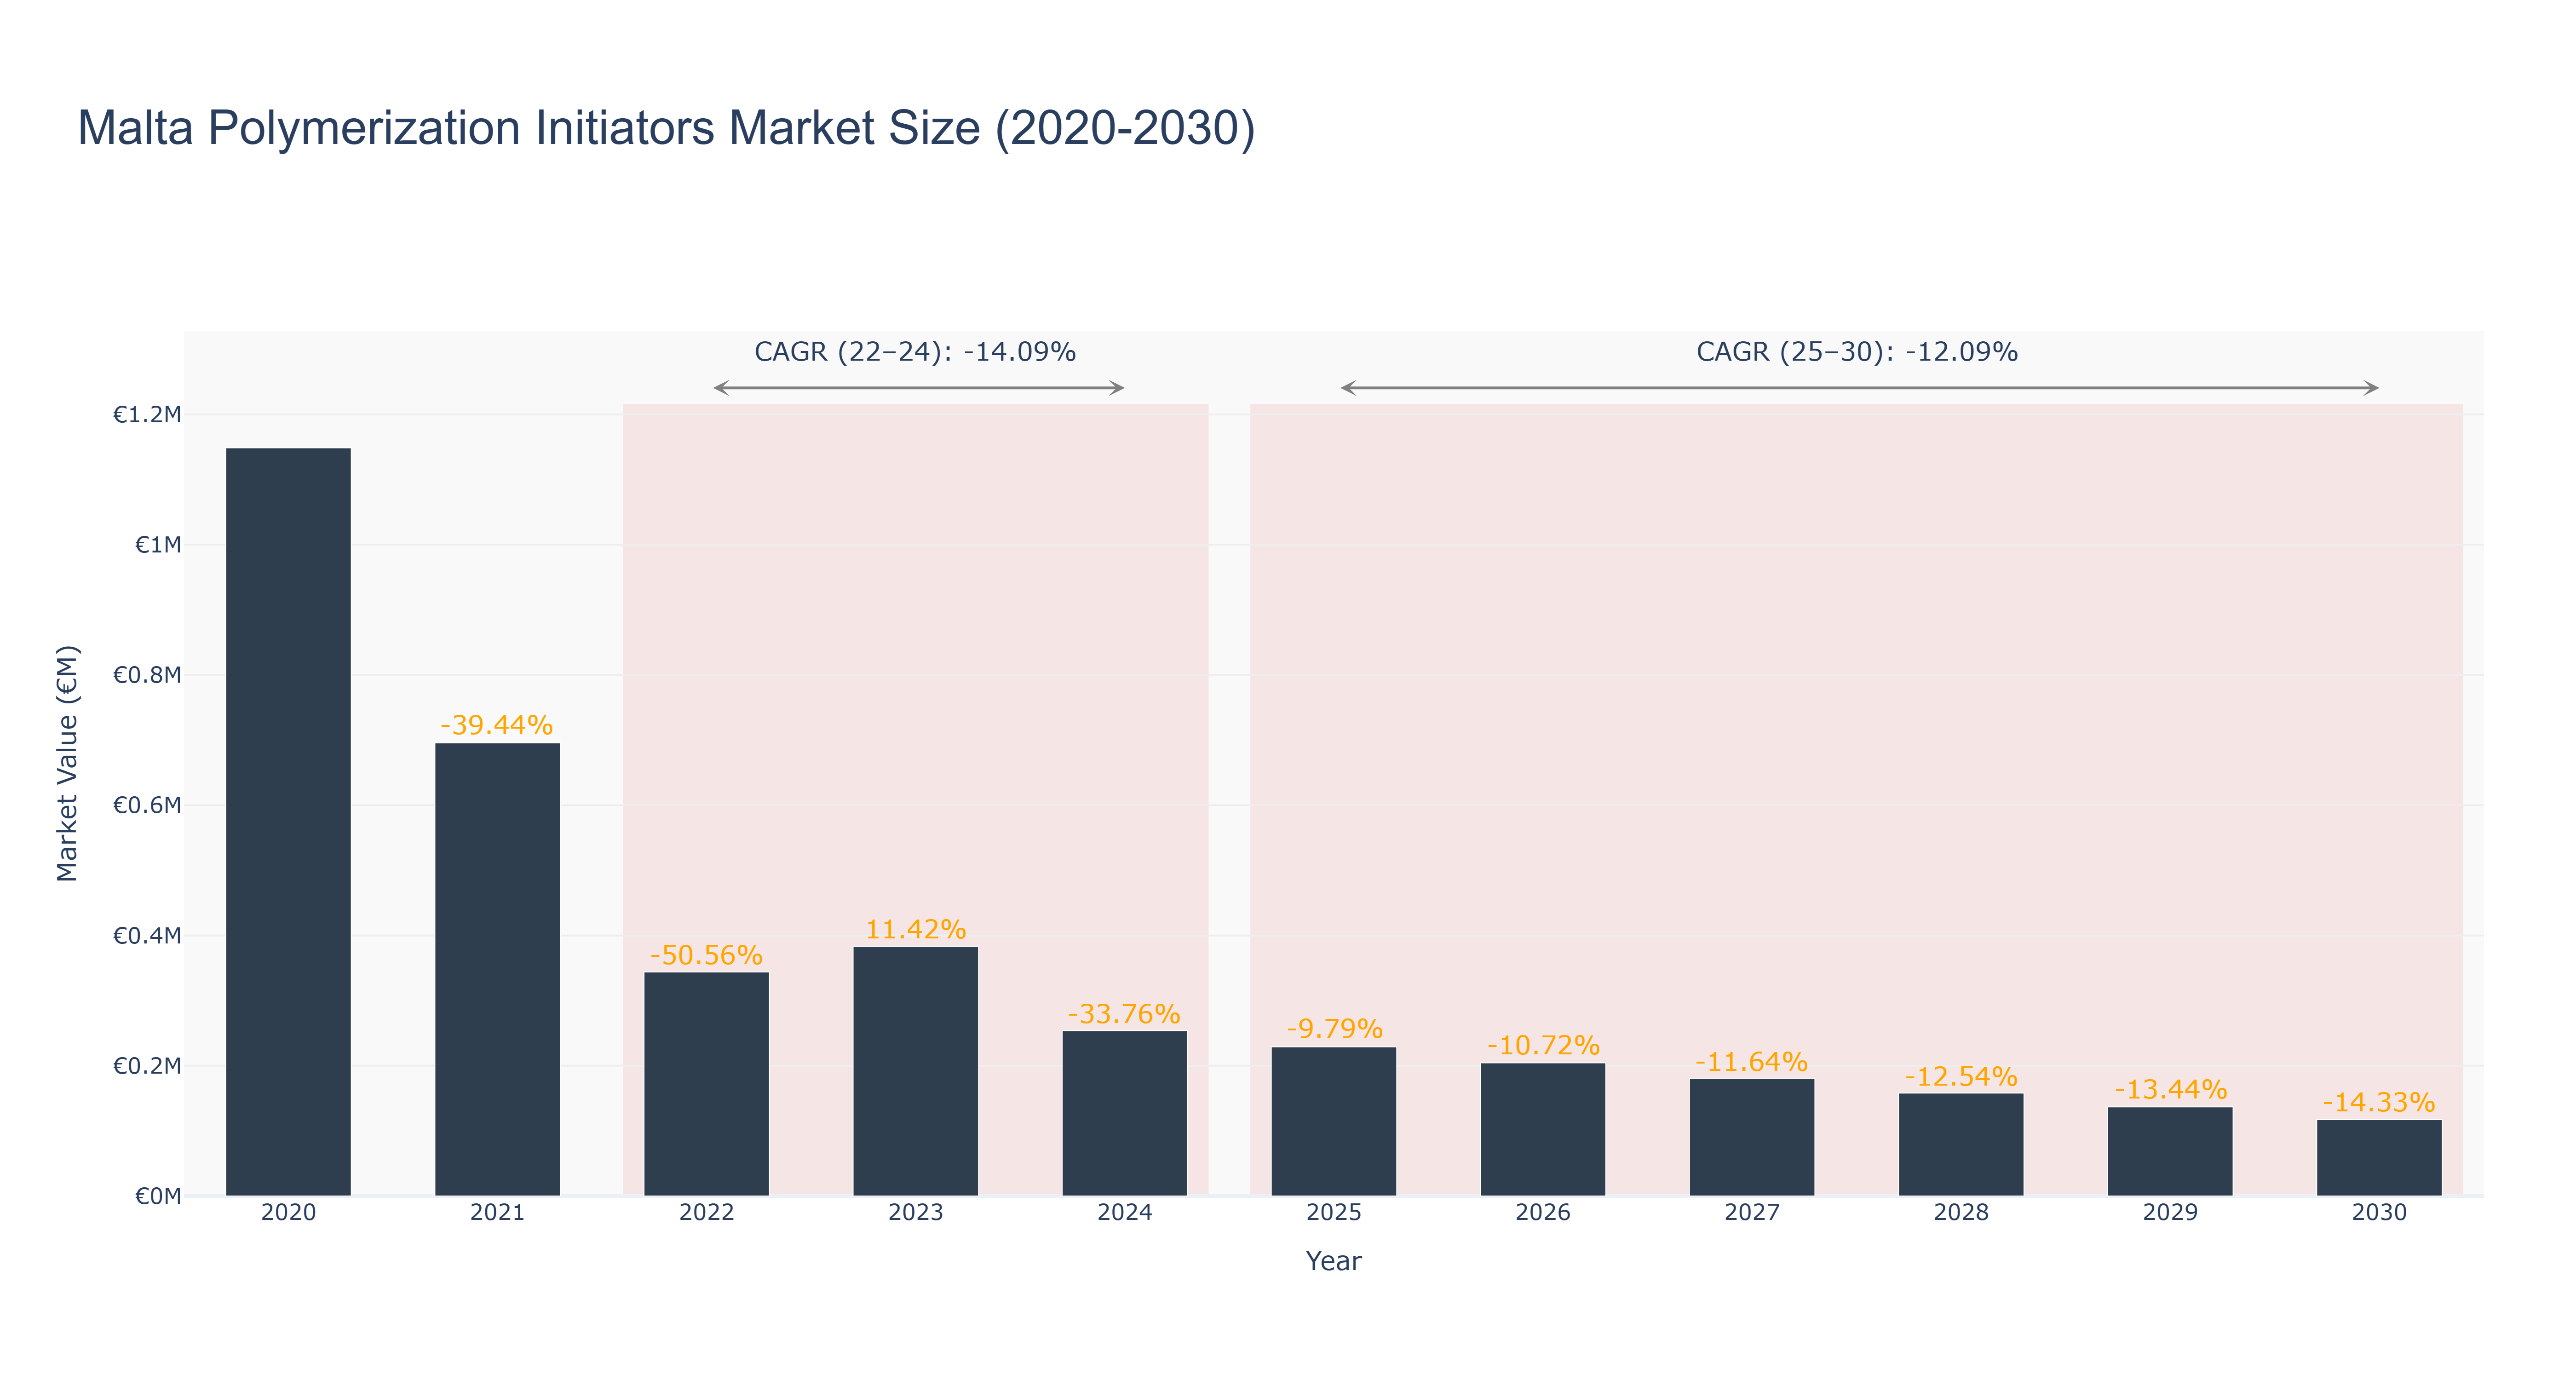
Malta Polymerization Initiators Market has shown a declining trend in market size over the years, with a peak market size of €1.15 million in 2020. The actual market size decreased to €0.25 million in 2024, reflecting a negative growth trend. The forecasted market size is expected to further decrease to €0.12 million by 2030, with a CAGR of -12.09% from 2025 to 2030. The market's downfall can be attributed to factors such as technological advancements leading to reduced demand for traditional polymerization initiators, as well as increasing competition from alternative products. Looking ahead, the market is likely to focus on sustainability initiatives and innovative product development to regain its foothold in the industry. Future projects may involve collaborations with research institutions to explore eco-friendly polymerization initiator solutions.
Malta Polymerization Initiators Market: Production & Trade Performance (2019-2025)
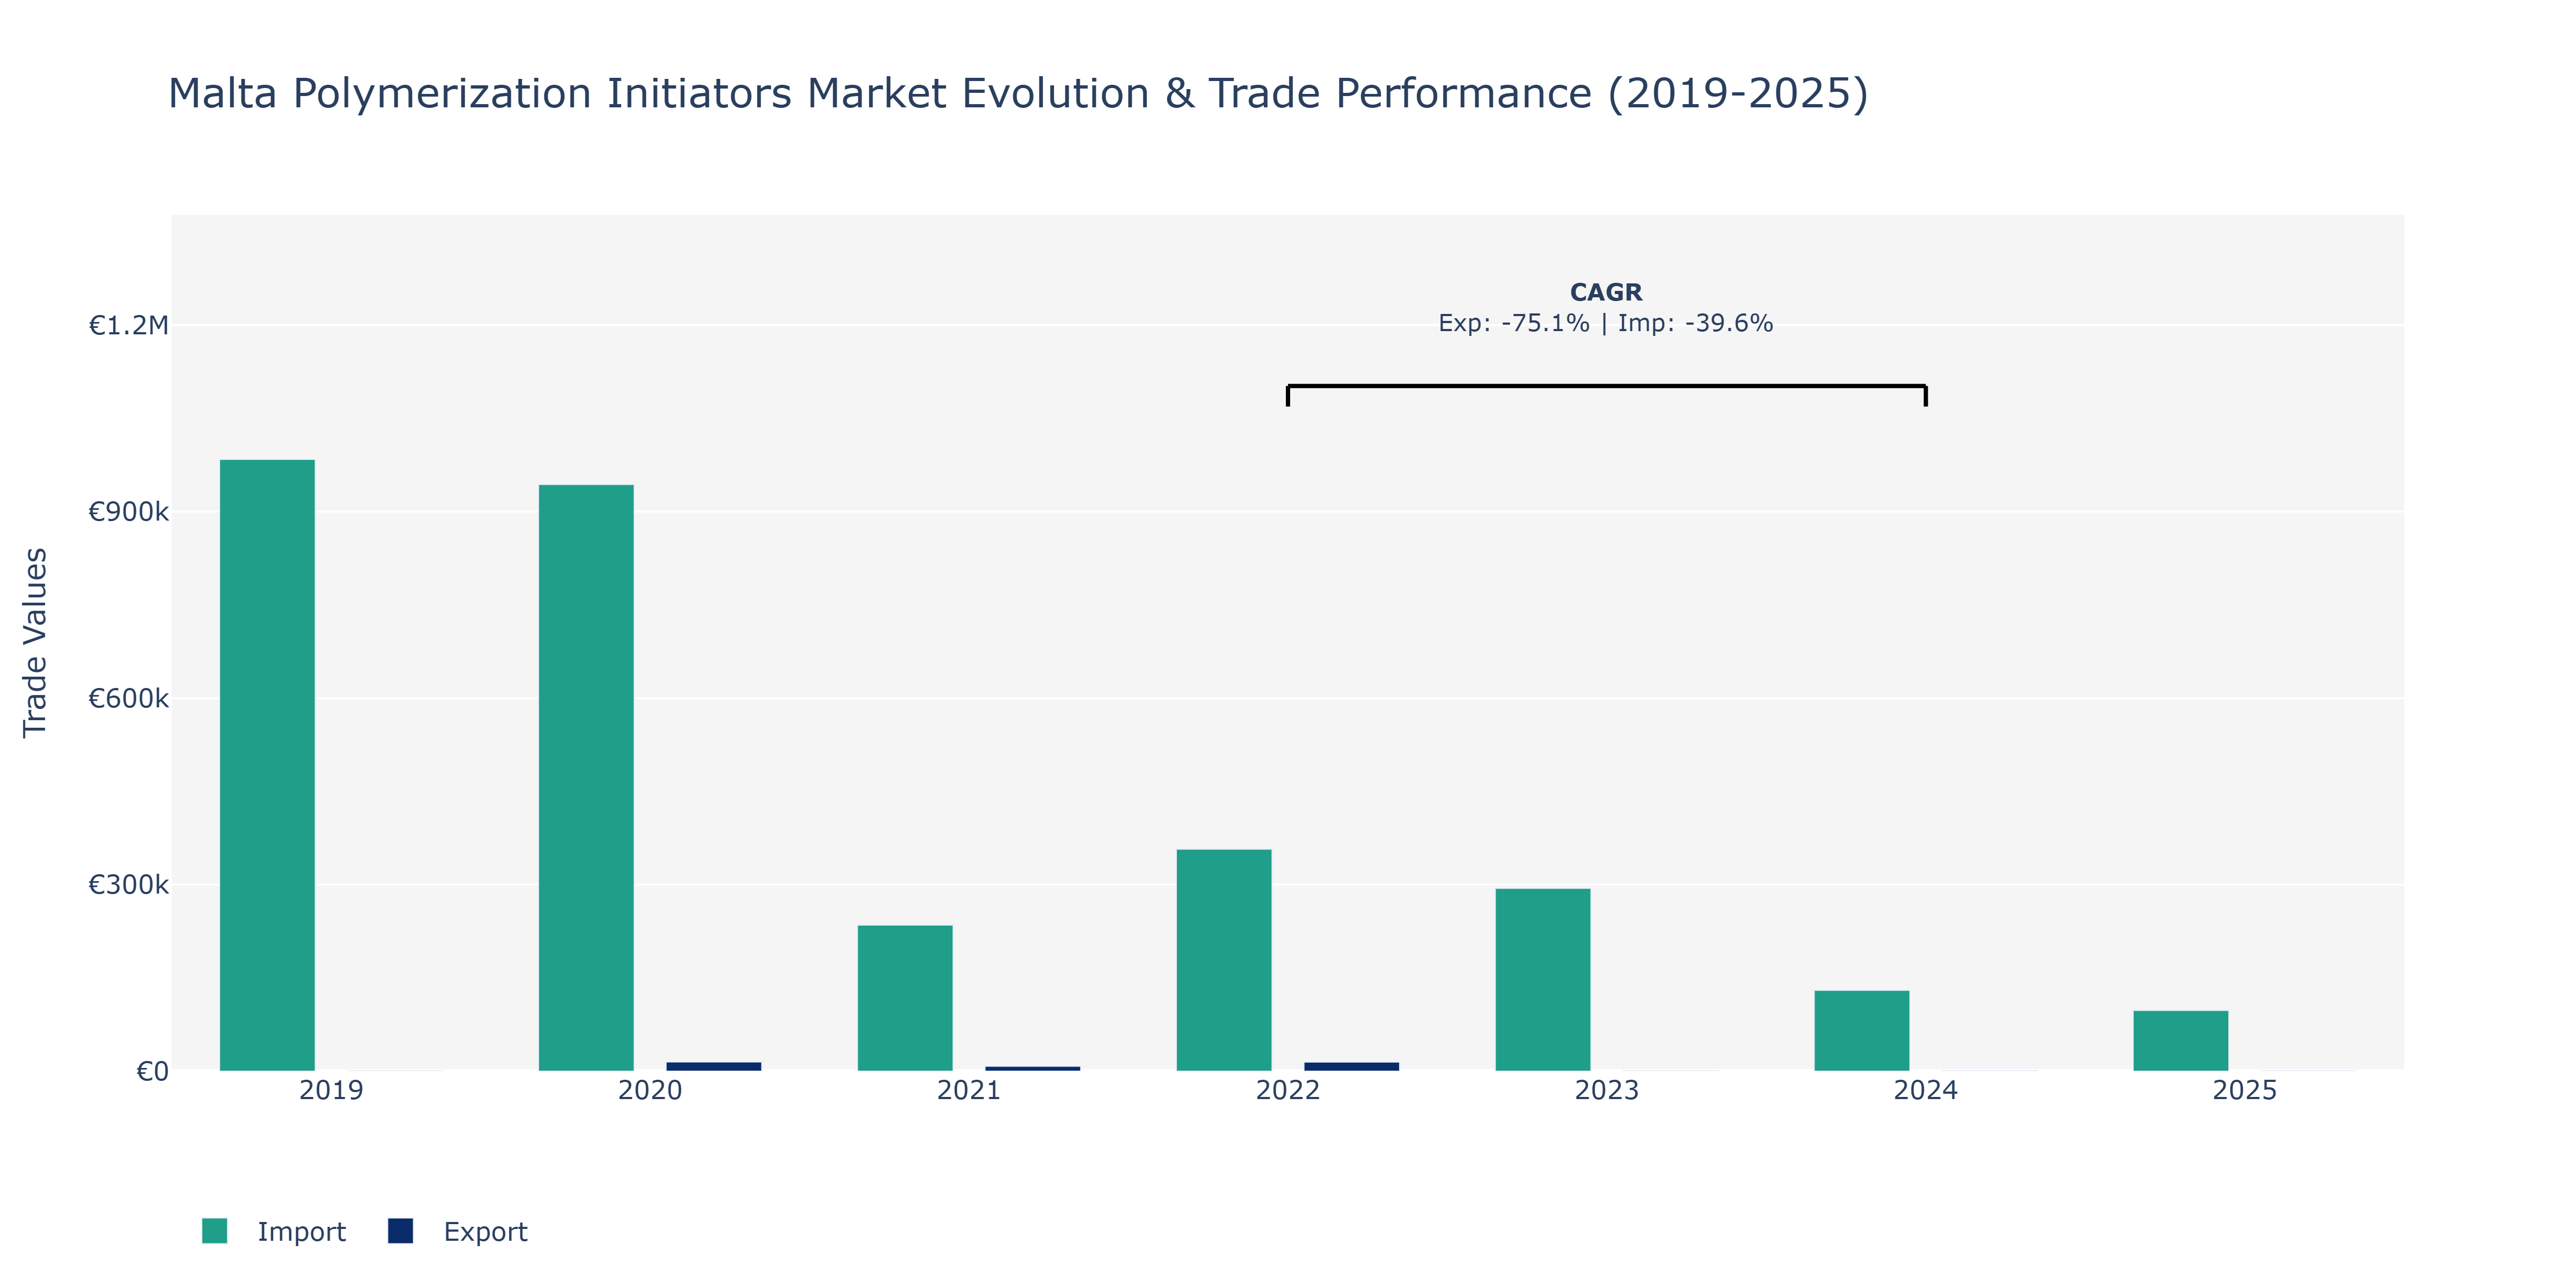
The Malta Polymerization Initiators Market displayed notable fluctuations in both Exports and Imports over the years. In 2019, Imports peaked at €983.98 million, while Exports stood at €440 thousand, indicating a significant trade gap. The year 2020 witnessed a substantial increase in Exports to €14.83 billion, likely due to enhanced production capacities or increased global demand for polymerization initiators. However, Imports remained relatively stable at €943.61 million. In 2021, both Exports and Imports experienced a decline, possibly influenced by supply chain disruptions or fluctuating market demand. The market rebounded in 2022 with Exports reaching €14.59 billion, showcasing a strong recovery. Conversely, Imports declined to €357.07 million, reflecting a shift in sourcing strategies or changes in domestic consumption patterns. The subsequent years saw a downward trend in both metrics, underscoring the market's sensitivity to external factors like raw material costs or geopolitical tensions. These dynamics emphasize the market's volatility and the importance of strategic planning to navigate uncertainties effectively.
Key Highlights of the Report:
- Malta Polymerization Initiators Market Outlook
- Market Size of Malta Polymerization Initiators Market, 2025
- Forecast of Malta Polymerization Initiators Market, 2032
- Historical Data and Forecast of Malta Polymerization Initiators Revenues & Volume for the Period 2022 - 2032F
- Malta Polymerization Initiators Market Trend Evolution
- Malta Polymerization Initiators Market Drivers and Challenges
- Malta Polymerization Initiators Price Trends
- Malta Polymerization Initiators Porter`s Five Forces
- Malta Polymerization Initiators Industry Life Cycle
- Historical Data and Forecast of Malta Polymerization Initiators Market Revenues & Volume By Type for the Period 2022 - 2032F
- Historical Data and Forecast of Malta Polymerization Initiators Market Revenues & Volume By Peroxide for the Period 2022 - 2032F
- Historical Data and Forecast of Malta Polymerization Initiators Market Revenues & Volume By Persulfate for the Period 2022 - 2032F
- Historical Data and Forecast of Malta Polymerization Initiators Market Revenues & Volume By Azo Compounds for the Period 2022 - 2032F
- Historical Data and Forecast of Malta Polymerization Initiators Market Revenues & Volume By Others for the Period 2022 - 2032F
- Historical Data and Forecast of Malta Polymerization Initiators Market Revenues & Volume By Application for the Period 2022 - 2032F
- Historical Data and Forecast of Malta Polymerization Initiators Market Revenues & Volume By Polyethylene for the Period 2022 - 2032F
- Historical Data and Forecast of Malta Polymerization Initiators Market Revenues & Volume By Polypropylene for the Period 2022 - 2032F
- Historical Data and Forecast of Malta Polymerization Initiators Market Revenues & Volume By PVC for the Period 2022 - 2032F
- Historical Data and Forecast of Malta Polymerization Initiators Market Revenues & Volume By Polystyrene for the Period 2022 - 2032F
- Historical Data and Forecast of Malta Polymerization Initiators Market Revenues & Volume By ABS for the Period 2022 - 2032F
- Historical Data and Forecast of Malta Polymerization Initiators Market Revenues & Volume By Others for the Period 2022 - 2032F
- Malta Polymerization Initiators Import Export Trade Statistics
- Market Opportunity Assessment By Type
- Market Opportunity Assessment By Application
- Malta Polymerization Initiators Top Companies Market Share
- Malta Polymerization Initiators Competitive Benchmarking By Technical and Operational Parameters
- Malta Polymerization Initiators Company Profiles
- Malta Polymerization Initiators Key Strategic Recommendations
Frequently Asked Questions About the Market Study (FAQs):
6Wresearch actively monitors the Malta Polymerization Initiators Market and publishes its comprehensive annual report, highlighting emerging trends, growth drivers, revenue analysis, and forecast outlook. Our insights help businesses to make data-backed strategic decisions with ongoing market dynamics. Our analysts track relevent industries related to the Malta Polymerization Initiators Market, allowing our clients with actionable intelligence and reliable forecasts tailored to emerging regional needs.
Yes, we provide customisation as per your requirements. To learn more, feel free to contact us on sales@6wresearch.com
1 Executive Summary |
2 Introduction |
2.1 Key Highlights of the Report |
2.2 Report Description |
2.3 Market Scope & Segmentation |
2.4 Research Methodology |
2.5 Assumptions |
3 Malta Polymerization Initiators Market Overview |
3.1 Malta Country Macro Economic Indicators |
3.2 Malta Polymerization Initiators Market Revenues & Volume, 2022 & 2032F |
3.3 Malta Polymerization Initiators Market - Industry Life Cycle |
3.4 Malta Polymerization Initiators Market - Porter's Five Forces |
3.5 Malta Polymerization Initiators Market Revenues & Volume Share, By Type, 2022 & 2032F |
3.6 Malta Polymerization Initiators Market Revenues & Volume Share, By Application, 2022 & 2032F |
4 Malta Polymerization Initiators Market Dynamics |
4.1 Impact Analysis |
4.2 Market Drivers |
4.2.1 Increasing demand for polymers in various industries such as packaging, automotive, and construction |
4.2.2 Growing emphasis on sustainable and eco-friendly polymerization initiators |
4.2.3 Technological advancements leading to the development of new and improved polymerization initiators |
4.3 Market Restraints |
4.3.1 Fluctuating prices of raw materials used in polymerization initiators production |
4.3.2 Stringent regulations related to the use of certain chemicals in polymerization initiators |
4.3.3 Competition from alternative polymerization initiation methods such as photoinitiators |
5 Malta Polymerization Initiators Market Trends |
6 Malta Polymerization Initiators Market Segmentations |
6.1 Malta Polymerization Initiators Market, By Type |
6.1.1 Overview and Analysis |
6.1.2 Malta Polymerization Initiators Market Revenues & Volume, By Peroxide, 2022 - 2032F |
6.1.3 Malta Polymerization Initiators Market Revenues & Volume, By Persulfate, 2022 - 2032F |
6.1.4 Malta Polymerization Initiators Market Revenues & Volume, By Azo Compounds, 2022 - 2032F |
6.1.5 Malta Polymerization Initiators Market Revenues & Volume, By Others, 2022 - 2032F |
6.2 Malta Polymerization Initiators Market, By Application |
6.2.1 Overview and Analysis |
6.2.2 Malta Polymerization Initiators Market Revenues & Volume, By Polyethylene, 2022 - 2032F |
6.2.3 Malta Polymerization Initiators Market Revenues & Volume, By Polypropylene, 2022 - 2032F |
6.2.4 Malta Polymerization Initiators Market Revenues & Volume, By PVC, 2022 - 2032F |
6.2.5 Malta Polymerization Initiators Market Revenues & Volume, By Polystyrene, 2022 - 2032F |
6.2.6 Malta Polymerization Initiators Market Revenues & Volume, By ABS, 2022 - 2032F |
6.2.7 Malta Polymerization Initiators Market Revenues & Volume, By Others, 2022 - 2032F |
7 Malta Polymerization Initiators Market Import-Export Trade Statistics |
7.1 Malta Polymerization Initiators Market Export to Major Countries |
7.2 Malta Polymerization Initiators Market Imports from Major Countries |
8 Malta Polymerization Initiators Market Key Performance Indicators |
8.1 Research and development investment in new polymerization initiator technologies |
8.2 Adoption rate of sustainable polymerization initiators in the market |
8.3 Number of patents filed for innovative polymerization initiator formulations |
9 Malta Polymerization Initiators Market - Opportunity Assessment |
9.1 Malta Polymerization Initiators Market Opportunity Assessment, By Type, 2022 & 2032F |
9.2 Malta Polymerization Initiators Market Opportunity Assessment, By Application, 2022 & 2032F |
10 Malta Polymerization Initiators Market - Competitive Landscape |
10.1 Malta Polymerization Initiators Market Revenue Share, By Companies, 2025 |
10.2 Malta Polymerization Initiators Market Competitive Benchmarking, By Operating and Technical Parameters |
11 Company Profiles |
12 Recommendations | 13 Disclaimer |
Global Go To Market Strategy - 2030
Export potential enables firms to identify high-growth global markets with greater confidence by combining advanced trade intelligence with a structured quantitative methodology. The framework analyzes emerging demand trends and country-level import patterns while integrating macroeconomic and trade datasets such as GDP and population forecasts, bilateral import–export flows, tariff structures, elasticity differentials between developed and developing economies, geographic distance, and import demand projections. Using weighted trade values from 2020–2024 as the base period to project country-to-country export potential for 2030, these inputs are operationalized through calculated drivers such as gravity model parameters, tariff impact factors, and projected GDP per-capita growth. Through an analysis of hidden potentials, demand hotspots, and market conditions that are most favorable to success, this method enables firms to focus on target countries, maximize returns, and global expansion with data, backed by accuracy.
By factoring in the projected importer demand gap that is currently unmet and could be potential opportunity, it identifies the potential for the Exporter (Country) among 190 countries, against the general trade analysis, which identifies the biggest importer or exporter.
To discover high-growth global markets and optimize your business strategy:
Click Here
Pricing
- Single User License$ 1,995
- Department License$ 2,400
- Site License$ 3,120
- Global License$ 3,795

Leadership Perspectives from Industry Events
Search
Thought Leadership and Analyst Meet


Our Clients
6WResearch In News
- Doha a strategic location for EV manufacturing hub: IPA Qatar
- Demand for luxury TVs surging in the GCC, says Samsung
- Empowering Growth: The Thriving Journey of Bangladesh’s Cable Industry
- Demand for luxury TVs surging in the GCC, says Samsung
- Video call with a traditional healer? Once unthinkable, it’s now common in South Africa
- Intelligent Buildings To Smooth GCC’s Path To Net Zero
Latest Reports
- Taiwan Airport Wireless Infrastructure Market (2026-2032)
- Vietnam Airport Wireless Infrastructure Market (2026-2032)
- Thailand Airport Wireless Infrastructure Market (2026-2032)
- South Korea Airport Wireless Infrastructure Market (2026-2032)
- Romania Airport Wireless Infrastructure Market (2026-2032)
- Qatar Airport Wireless Infrastructure Market (2026-2032)
- Philippines Airport Wireless Infrastructure Market (2026-2032)
- Japan Airport Wireless Infrastructure Market (2026-2032)
- Taiwan Airport Winter Services Market (2026-2032)
- Vietnam Airport Winter Services Market (2026-2032)
Industry Events and Analyst Meet

HIMTEX 2026

India Refining Summit 2026

India EV Show 2026

EV tech India Expo 2026

Auto Tech Asia 2026
Whitepaper
- Middle East & Africa Commercial Security Market Click here to view more.
- Middle East & Africa Fire Safety Systems & Equipment Market Click here to view more.
- GCC Drone Market Click here to view more.
- Middle East Lighting Fixture Market Click here to view more.
- GCC Physical & Perimeter Security Market Click here to view more.