Malta Potassium permanganate Market (2026-2032) | Industry, Forecast, Growth, Companies, Revenue, Trends, Outlook, Analysis, Size, Share, Segmentation & Value
Market Forecast By Grade (Free Flowing Grade, Technical Grade, Pharmaceutical Grade), By Application (Water Treatment, Waste Water Treatment, Chemicals Manufacturing, Aquaculture, Metal Processing, Air and Gas Purification, Others) And Competitive Landscape
| Product Code: ETC4700152 | Publication Date: Nov 2023 | Updated Date: Apr 2026 | Product Type: Market Research Report | |
| Publisher: 6Wresearch | Author: Shubham Padhi | No. of Pages: 60 | No. of Figures: 30 | No. of Tables: 5 |
Malta Potassium Permanganate Market Size (2020-2030)
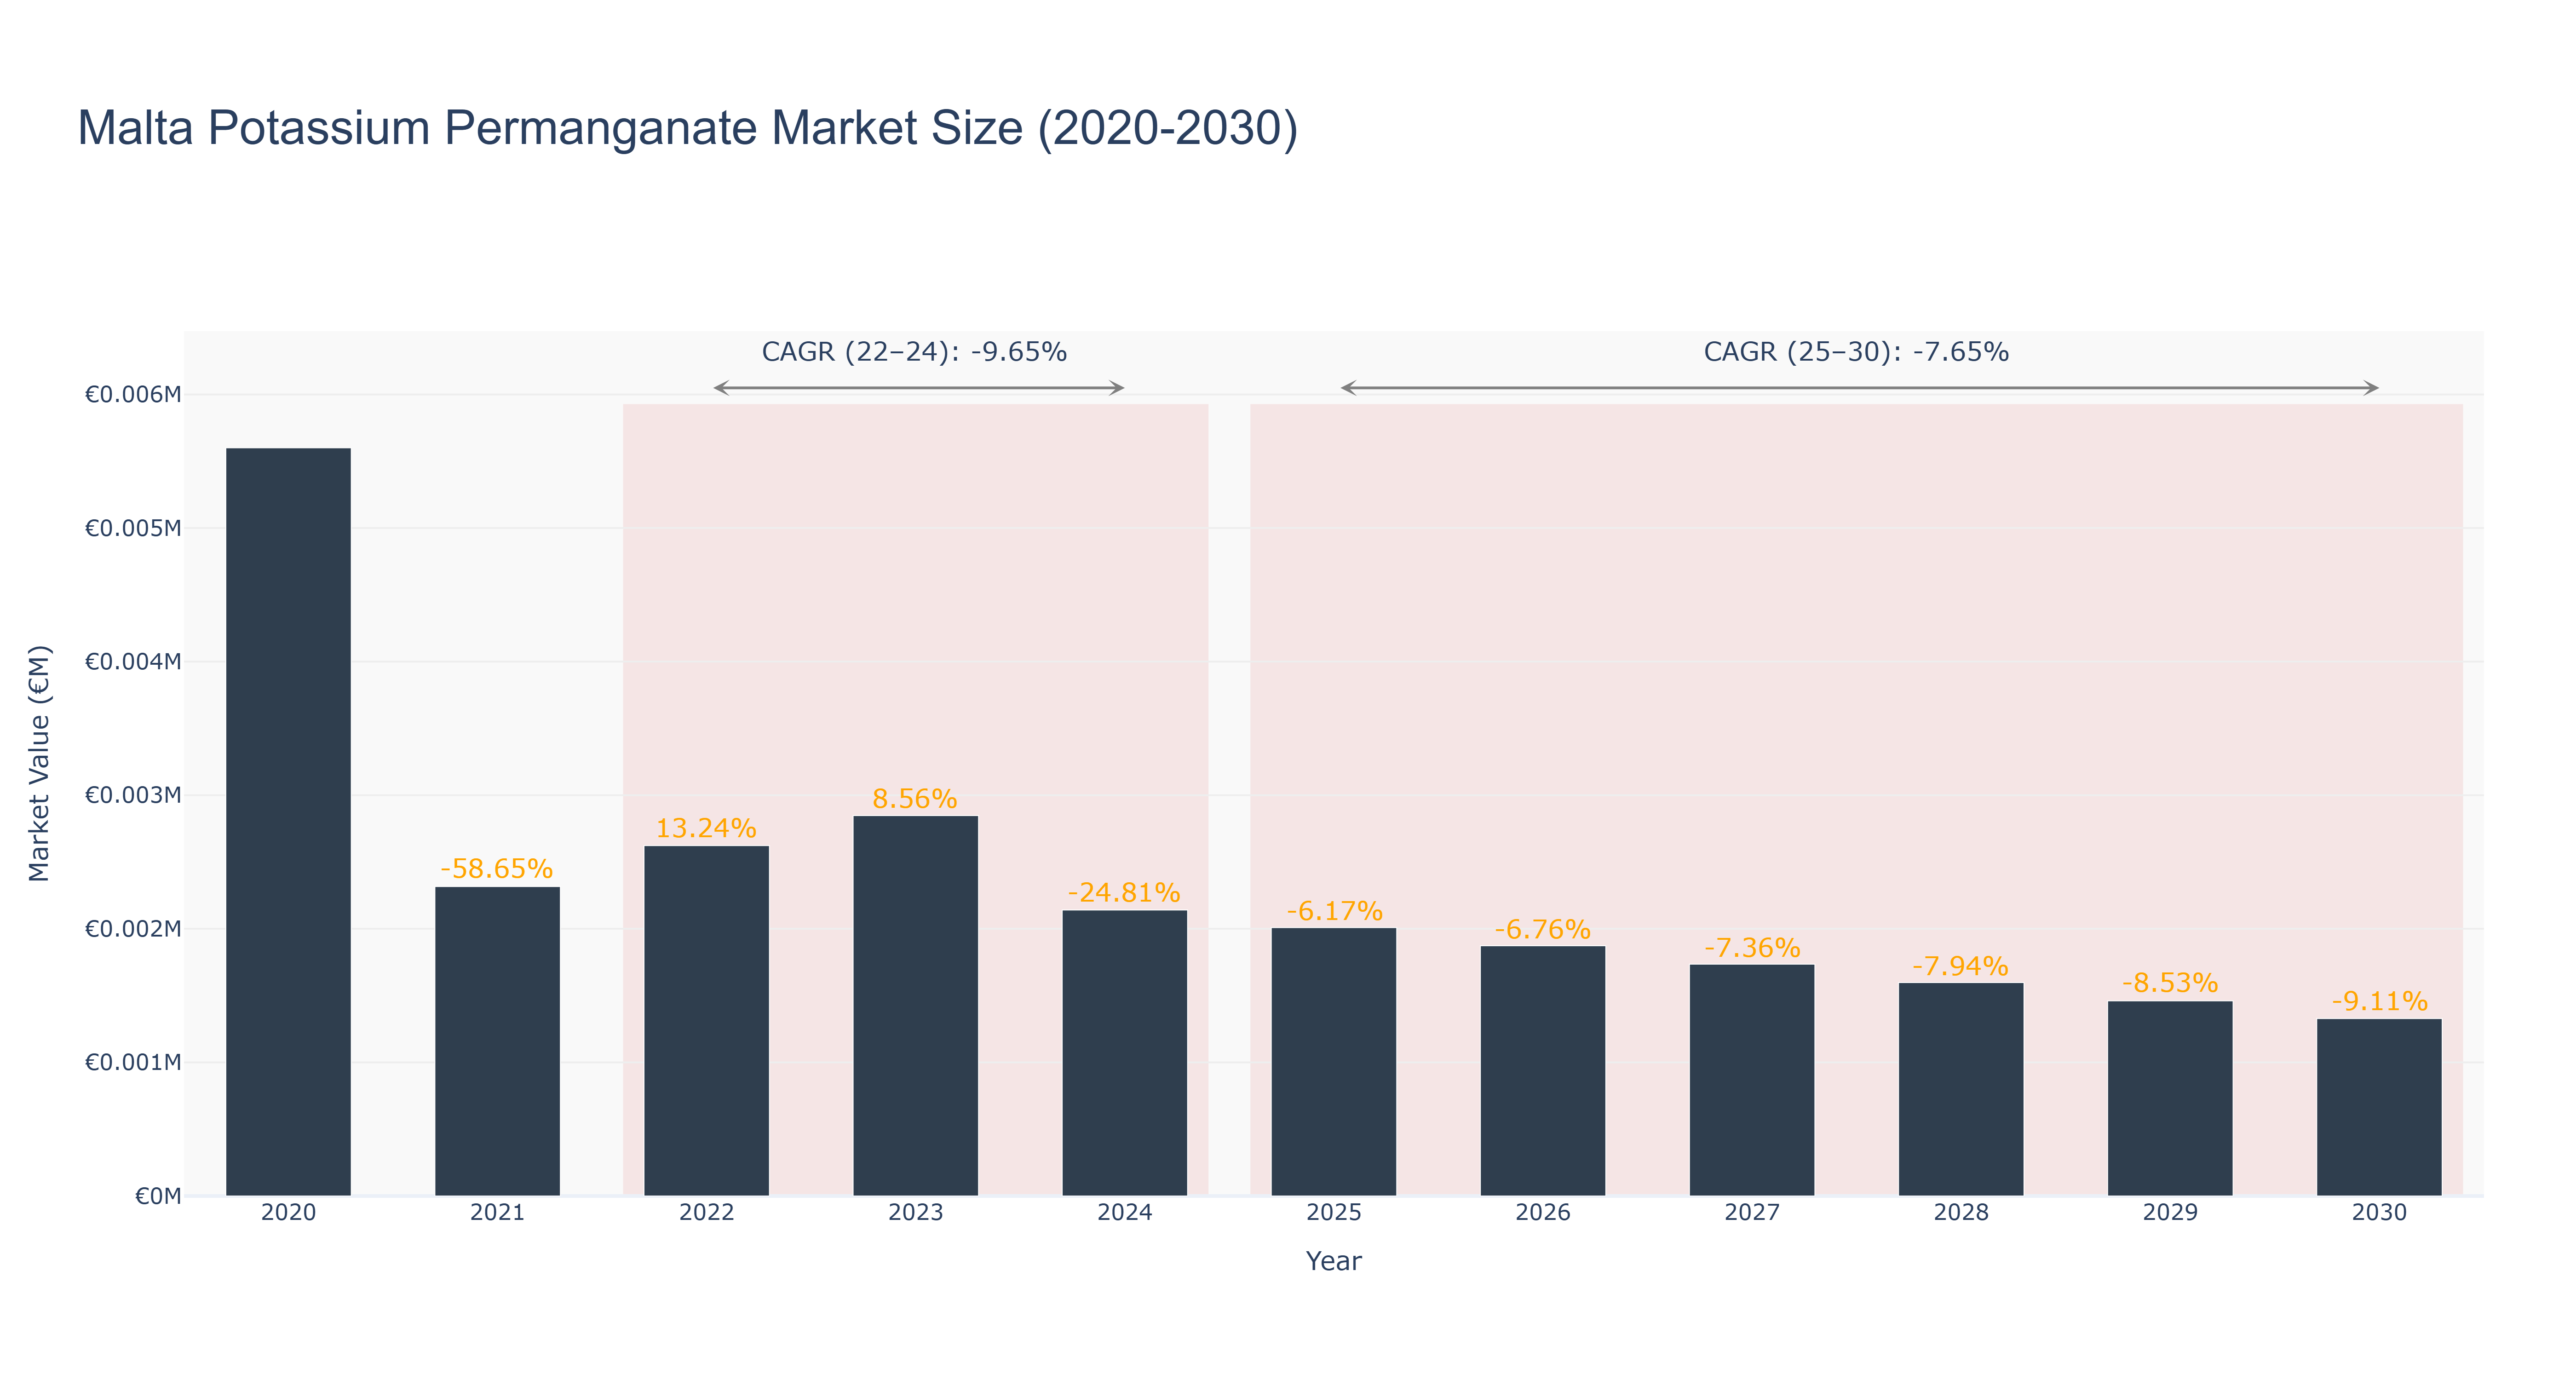
The Malta Potassium Permanganate Market has experienced a volatile trajectory, peaking at €5.60 thousand in 2020 before witnessing a significant decline of 58.65% in 2021. The actual market sizes for 2022 and 2023 showed modest recovery, reaching €2.62 thousand and €2.85 thousand, respectively, resulting in a CAGR of -9.65% from 2022 to 2024. However, the forecasted outlook for 2025 to 2030 suggests continued contraction, with projected market sizes decreasing from €2.01 thousand in 2025 to €1.33 thousand by 2030, reflecting a CAGR of -7.65%. Factors contributing to this decline include reduced demand in industrial applications and competition from alternative chemicals. As the market adjusts, potential opportunities may arise from innovations in chemical processes or shifts in environmental regulations that could revitalize interest in potassium permanganate, although the overall trend remains negative in the near term.
Malta Potassium Permanganate Market: Production & Trade Performance (2019-2025)
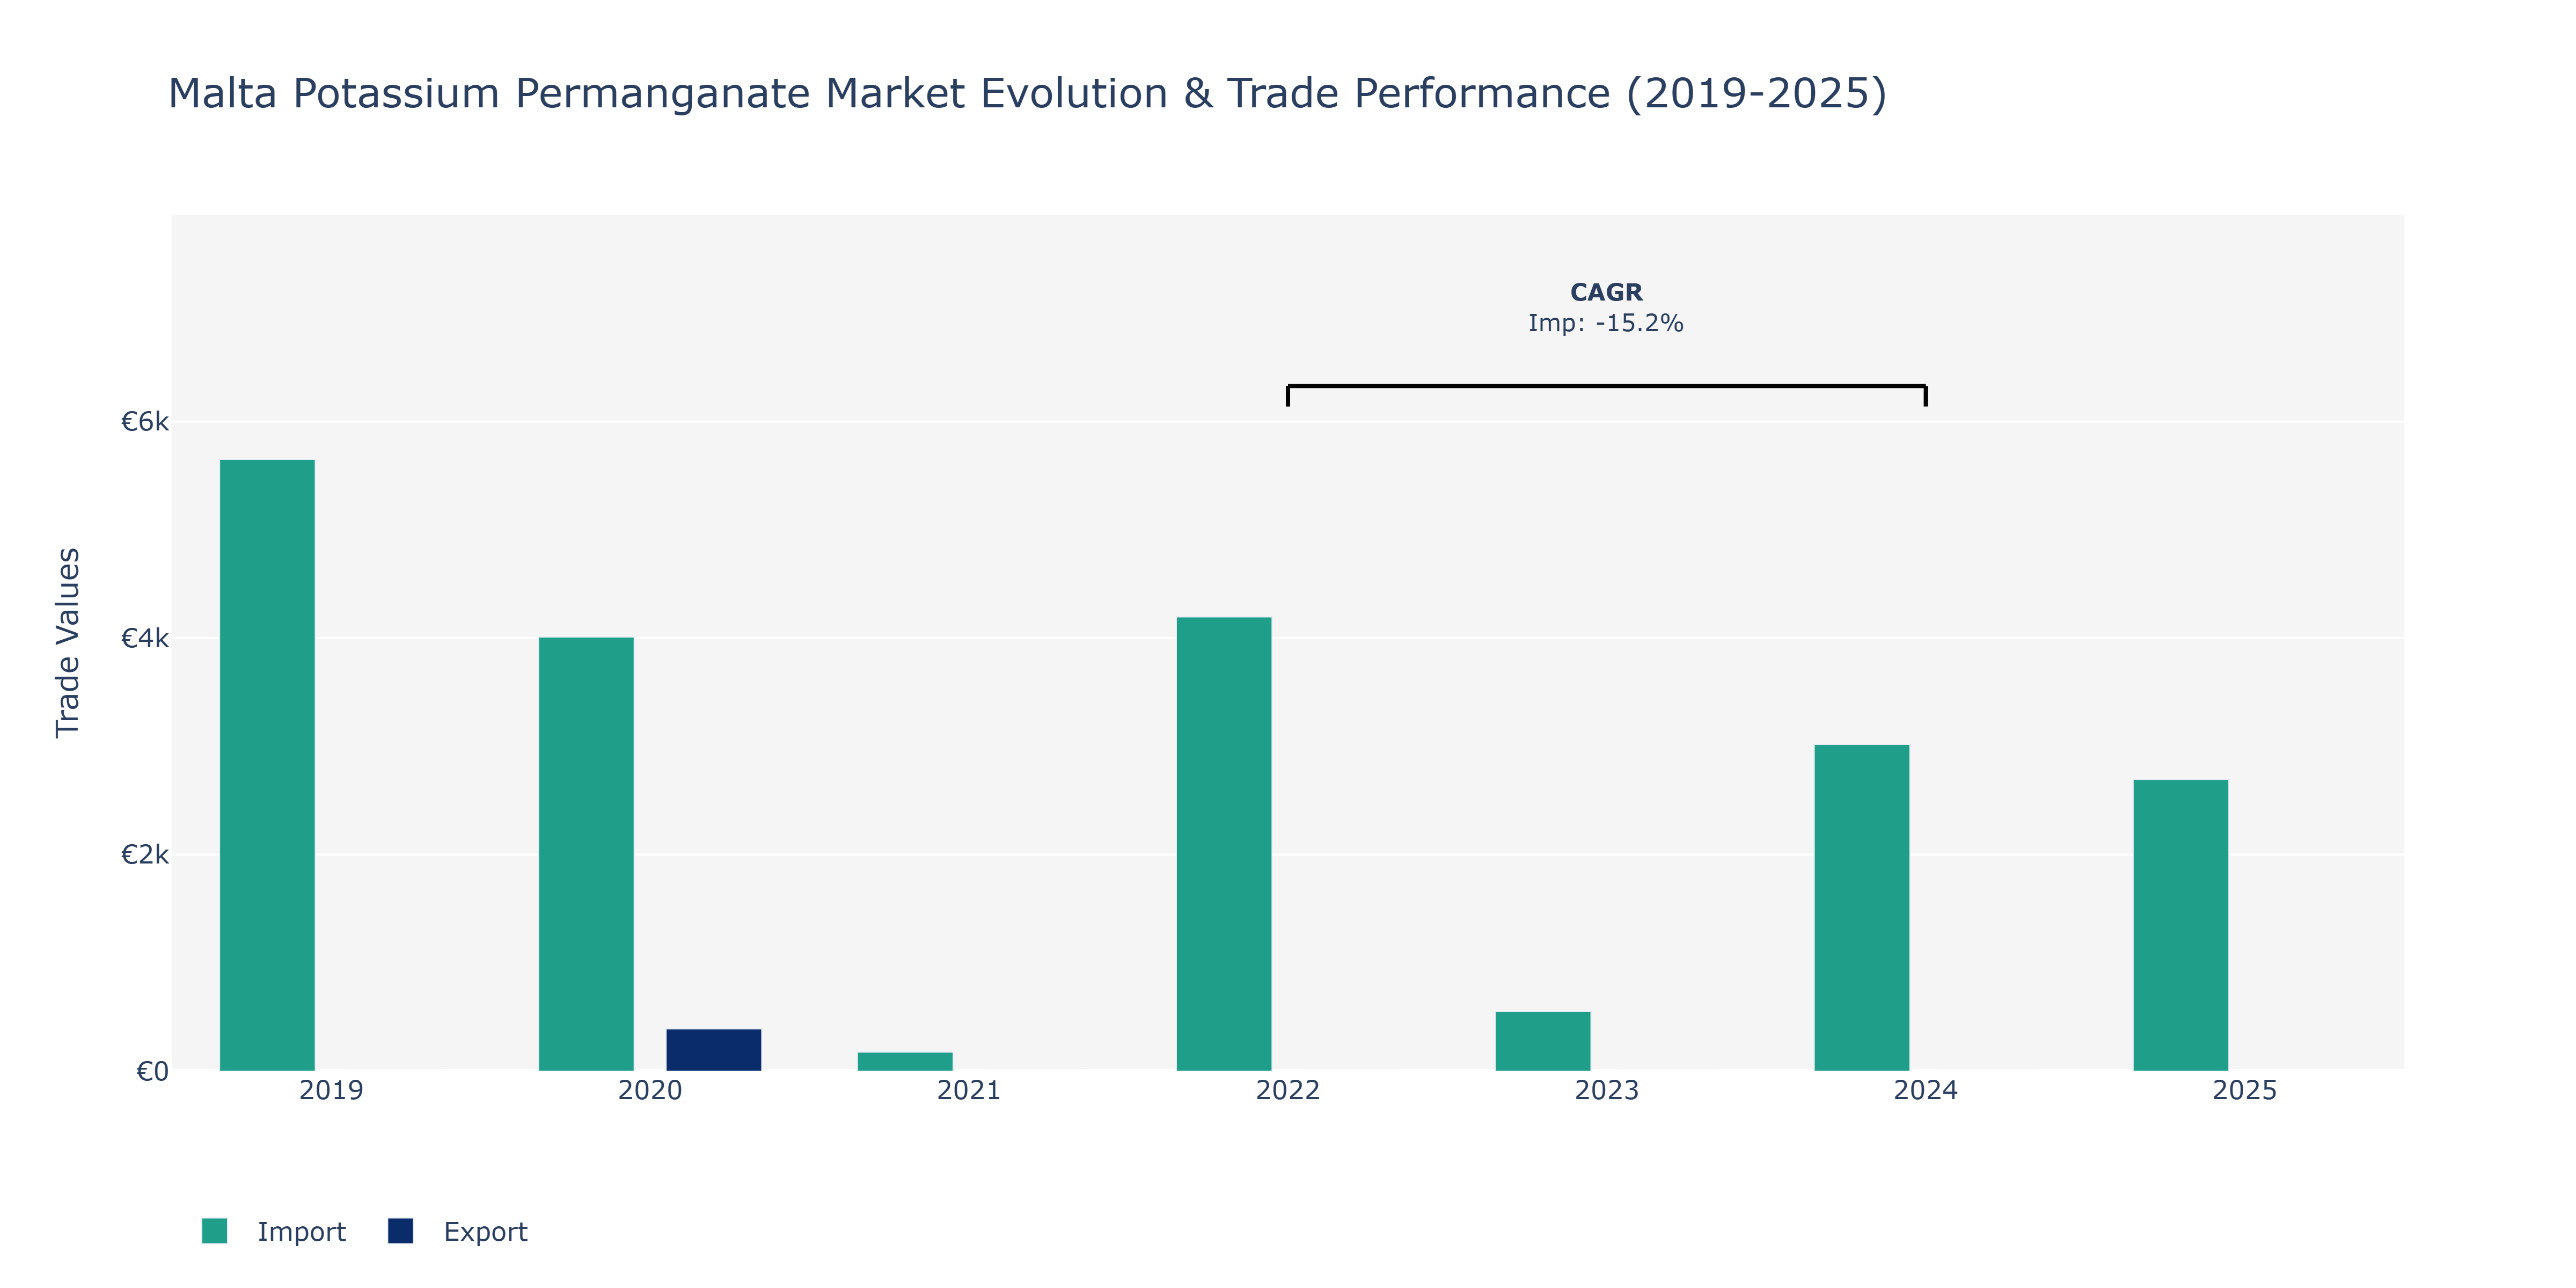
In the Malta Potassium Permanganate Market, imports showcased fluctuations over the years. In 2019, imports stood at €5.65 thousand, indicating a substantial baseline. The following year, there was a notable decline in imports to €4.01 thousand, coinciding with a decrease in exports to €390. However, 2021 saw a further decrease in imports to €176, suggesting a downward trend. The market experienced a significant peak in 2022 with imports rising to €4.2 thousand, which could be attributed to increased demand or changes in local production capabilities. Subsequently, imports decreased in 2023 to €550 and continued to decline in 2024 to €3.02 thousand. This drop aligns with the reported negative CAGR of -15.18% for imports from 2022 to 2024, indicating a period of contraction possibly influenced by global economic conditions or shifts in supply chains. The declining imports in 2025 to €2.69 thousand might suggest ongoing market adjustments or evolving consumer preferences. Further research into market dynamics and industrial applications could provide deeper insights into these import trends within the Malta Potassium Permanganate Market.
Key Highlights of the Report:
- Malta Potassium permanganate Market Outlook
- Market Size of Malta Potassium permanganate Market, 2025
- Forecast of Malta Potassium permanganate Market, 2032
- Historical Data and Forecast of Malta Potassium permanganate Revenues & Volume for the Period 2022 - 2032F
- Malta Potassium permanganate Market Trend Evolution
- Malta Potassium permanganate Market Drivers and Challenges
- Malta Potassium permanganate Price Trends
- Malta Potassium permanganate Porter`s Five Forces
- Malta Potassium permanganate Industry Life Cycle
- Historical Data and Forecast of Malta Potassium permanganate Market Revenues & Volume By Grade for the Period 2022 - 2032F
- Historical Data and Forecast of Malta Potassium permanganate Market Revenues & Volume By Free Flowing Grade for the Period 2022 - 2032F
- Historical Data and Forecast of Malta Potassium permanganate Market Revenues & Volume By Technical Grade for the Period 2022 - 2032F
- Historical Data and Forecast of Malta Potassium permanganate Market Revenues & Volume By Pharmaceutical Grade for the Period 2022 - 2032F
- Historical Data and Forecast of Malta Potassium permanganate Market Revenues & Volume By Application for the Period 2022 - 2032F
- Historical Data and Forecast of Malta Potassium permanganate Market Revenues & Volume By Water Treatment for the Period 2022 - 2032F
- Historical Data and Forecast of Malta Potassium permanganate Market Revenues & Volume By Waste Water Treatment for the Period 2022 - 2032F
- Historical Data and Forecast of Malta Potassium permanganate Market Revenues & Volume By Chemicals Manufacturing for the Period 2022 - 2032F
- Historical Data and Forecast of Malta Potassium permanganate Market Revenues & Volume By Aquaculture for the Period 2022 - 2032F
- Historical Data and Forecast of Malta Potassium permanganate Market Revenues & Volume By Metal Processing for the Period 2022 - 2032F
- Historical Data and Forecast of Malta Potassium permanganate Market Revenues & Volume By Air and Gas Purification for the Period 2022 - 2032F
- Historical Data and Forecast of Malta Potassium permanganate Market Revenues & Volume By Others for the Period 2022 - 2032F
- Malta Potassium permanganate Import Export Trade Statistics
- Market Opportunity Assessment By Grade
- Market Opportunity Assessment By Application
- Malta Potassium permanganate Top Companies Market Share
- Malta Potassium permanganate Competitive Benchmarking By Technical and Operational Parameters
- Malta Potassium permanganate Company Profiles
- Malta Potassium permanganate Key Strategic Recommendations
Frequently Asked Questions About the Market Study (FAQs):
6Wresearch actively monitors the Malta Potassium permanganate Market and publishes its comprehensive annual report, highlighting emerging trends, growth drivers, revenue analysis, and forecast outlook. Our insights help businesses to make data-backed strategic decisions with ongoing market dynamics. Our analysts track relevent industries related to the Malta Potassium permanganate Market, allowing our clients with actionable intelligence and reliable forecasts tailored to emerging regional needs.
Yes, we provide customisation as per your requirements. To learn more, feel free to contact us on sales@6wresearch.com
1 Executive Summary |
2 Introduction |
2.1 Key Highlights of the Report |
2.2 Report Description |
2.3 Market Scope & Segmentation |
2.4 Research Methodology |
2.5 Assumptions |
3 Malta Potassium permanganate Market Overview |
3.1 Malta Country Macro Economic Indicators |
3.2 Malta Potassium permanganate Market Revenues & Volume, 2022 & 2032F |
3.3 Malta Potassium permanganate Market - Industry Life Cycle |
3.4 Malta Potassium permanganate Market - Porter's Five Forces |
3.5 Malta Potassium permanganate Market Revenues & Volume Share, By Grade, 2022 & 2032F |
3.6 Malta Potassium permanganate Market Revenues & Volume Share, By Application, 2022 & 2032F |
4 Malta Potassium permanganate Market Dynamics |
4.1 Impact Analysis |
4.2 Market Drivers |
4.3 Market Restraints |
5 Malta Potassium permanganate Market Trends |
6 Malta Potassium permanganate Market Segmentations |
6.1 Malta Potassium permanganate Market, By Grade |
6.1.1 Overview and Analysis |
6.1.2 Malta Potassium permanganate Market Revenues & Volume, By Free Flowing Grade, 2022 - 2032F |
6.1.3 Malta Potassium permanganate Market Revenues & Volume, By Technical Grade, 2022 - 2032F |
6.1.4 Malta Potassium permanganate Market Revenues & Volume, By Pharmaceutical Grade, 2022 - 2032F |
6.2 Malta Potassium permanganate Market, By Application |
6.2.1 Overview and Analysis |
6.2.2 Malta Potassium permanganate Market Revenues & Volume, By Water Treatment, 2022 - 2032F |
6.2.3 Malta Potassium permanganate Market Revenues & Volume, By Waste Water Treatment, 2022 - 2032F |
6.2.4 Malta Potassium permanganate Market Revenues & Volume, By Chemicals Manufacturing, 2022 - 2032F |
6.2.5 Malta Potassium permanganate Market Revenues & Volume, By Aquaculture, 2022 - 2032F |
6.2.6 Malta Potassium permanganate Market Revenues & Volume, By Metal Processing, 2022 - 2032F |
6.2.7 Malta Potassium permanganate Market Revenues & Volume, By Air and Gas Purification, 2022 - 2032F |
7 Malta Potassium permanganate Market Import-Export Trade Statistics |
7.1 Malta Potassium permanganate Market Export to Major Countries |
7.2 Malta Potassium permanganate Market Imports from Major Countries |
8 Malta Potassium permanganate Market Key Performance Indicators |
9 Malta Potassium permanganate Market - Opportunity Assessment |
9.1 Malta Potassium permanganate Market Opportunity Assessment, By Grade, 2022 & 2032F |
9.2 Malta Potassium permanganate Market Opportunity Assessment, By Application, 2022 & 2032F |
10 Malta Potassium permanganate Market - Competitive Landscape |
10.1 Malta Potassium permanganate Market Revenue Share, By Companies, 2025 |
10.2 Malta Potassium permanganate Market Competitive Benchmarking, By Operating and Technical Parameters |
11 Company Profiles |
12 Recommendations | 13 Disclaimer |
Global Go To Market Strategy - 2030
Export potential enables firms to identify high-growth global markets with greater confidence by combining advanced trade intelligence with a structured quantitative methodology. The framework analyzes emerging demand trends and country-level import patterns while integrating macroeconomic and trade datasets such as GDP and population forecasts, bilateral import–export flows, tariff structures, elasticity differentials between developed and developing economies, geographic distance, and import demand projections. Using weighted trade values from 2020–2024 as the base period to project country-to-country export potential for 2030, these inputs are operationalized through calculated drivers such as gravity model parameters, tariff impact factors, and projected GDP per-capita growth. Through an analysis of hidden potentials, demand hotspots, and market conditions that are most favorable to success, this method enables firms to focus on target countries, maximize returns, and global expansion with data, backed by accuracy.
By factoring in the projected importer demand gap that is currently unmet and could be potential opportunity, it identifies the potential for the Exporter (Country) among 190 countries, against the general trade analysis, which identifies the biggest importer or exporter.
To discover high-growth global markets and optimize your business strategy:
Click Here
Pricing
- Single User License$ 1,995
- Department License$ 2,400
- Site License$ 3,120
- Global License$ 3,795

Leadership Perspectives from Industry Events
Search
Thought Leadership and Analyst Meet


Our Clients
6WResearch In News
- Doha a strategic location for EV manufacturing hub: IPA Qatar
- Demand for luxury TVs surging in the GCC, says Samsung
- Empowering Growth: The Thriving Journey of Bangladesh’s Cable Industry
- Demand for luxury TVs surging in the GCC, says Samsung
- Video call with a traditional healer? Once unthinkable, it’s now common in South Africa
- Intelligent Buildings To Smooth GCC’s Path To Net Zero
Latest Reports
- Taiwan Airport Wireless Infrastructure Market (2026-2032)
- Vietnam Airport Wireless Infrastructure Market (2026-2032)
- Thailand Airport Wireless Infrastructure Market (2026-2032)
- South Korea Airport Wireless Infrastructure Market (2026-2032)
- Romania Airport Wireless Infrastructure Market (2026-2032)
- Qatar Airport Wireless Infrastructure Market (2026-2032)
- Philippines Airport Wireless Infrastructure Market (2026-2032)
- Japan Airport Wireless Infrastructure Market (2026-2032)
- Taiwan Airport Winter Services Market (2026-2032)
- Vietnam Airport Winter Services Market (2026-2032)
Industry Events and Analyst Meet

HIMTEX 2026

India Refining Summit 2026

India EV Show 2026

EV tech India Expo 2026

Auto Tech Asia 2026
Whitepaper
- Middle East & Africa Commercial Security Market Click here to view more.
- Middle East & Africa Fire Safety Systems & Equipment Market Click here to view more.
- GCC Drone Market Click here to view more.
- Middle East Lighting Fixture Market Click here to view more.
- GCC Physical & Perimeter Security Market Click here to view more.