Malta Self-Watering Pot Market (2026-2032) | Trends, Companies, Segmentation, Competitive Landscape, Share, Analysis, Forecast, Growth, Industry, Value, Size & Revenue, Outlook
Market Forecast By Material (Stone, Wood, Metal, Polypropylene, Others), By Mount Type (Floor Standing, Hanging, Tabletop, Wall Mount, Window Mount), By Shape (Oval, Rectangular, Round, Square), By Depth (Up to 9.9 in, 10 to 11.9 in, 12 to 17.9 in, 18 to 23.9 in, 24 in & above), By Price (Low, Medium, High), By End-use (Household/Residential, Commercial), By Distribution Channel (Online, Offline) And Competitive Landscape
| Product Code: ETC8202334 | Publication Date: Sep 2024 | Updated Date: Apr 2026 | Product Type: Market Research Report | |
| Publisher: 6Wresearch | Author: Dhaval Chaurasia | No. of Pages: 75 | No. of Figures: 35 | No. of Tables: 20 |
Malta Self-Watering Pot Market Size (2020-2030)
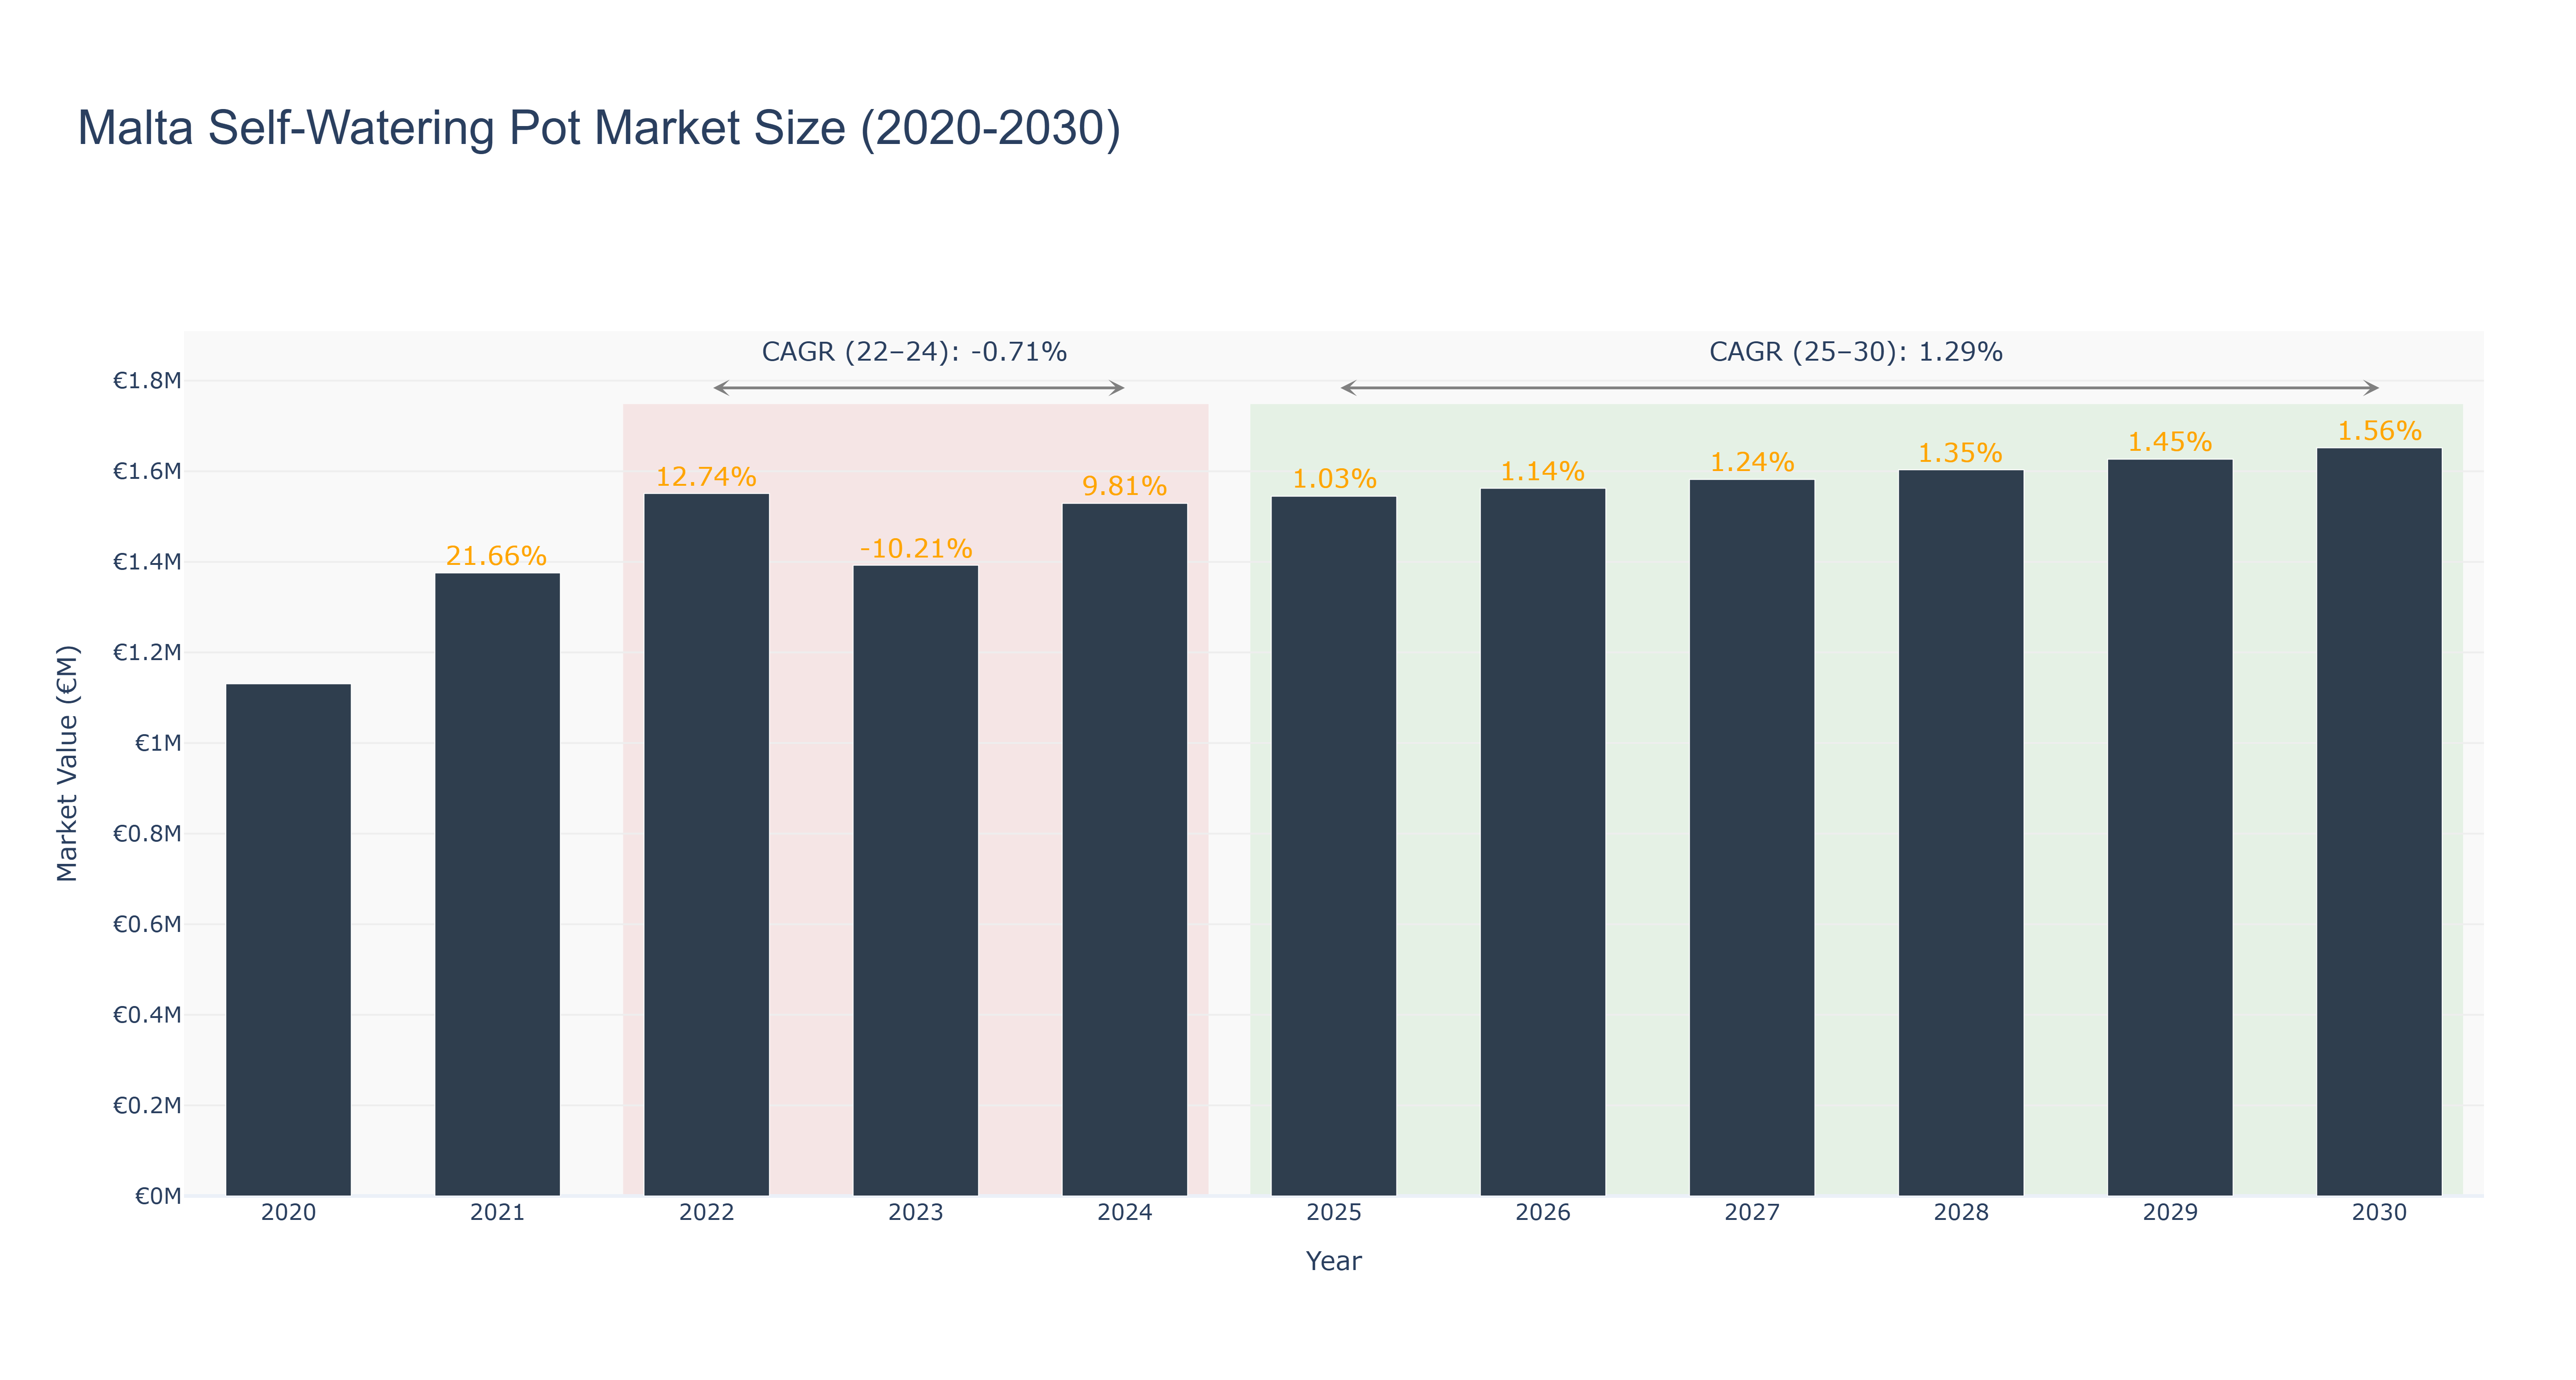
Malta's Self-Watering Pot Market experienced a peak market size of €1.65 million in 2030. The market saw steady growth from €1.13 million in 2020 to €1.53 million in 2024, with a slight decline in 2023 due to a -10.21% growth rate. However, from 2025 to 2030, the market is forecasted to grow at a CAGR of 1.29%, showing resilience and potential for sustained growth. The market's fluctuation in the past was influenced by factors like changing consumer preferences towards sustainable gardening solutions and advancements in self-watering pot technology. Looking ahead, Malta is set to introduce a national initiative promoting urban gardening, which is expected to further boost the self-watering pot market in the coming years.
Malta Self-Watering Pot Market: Production & Trade Performance (2019-2025)
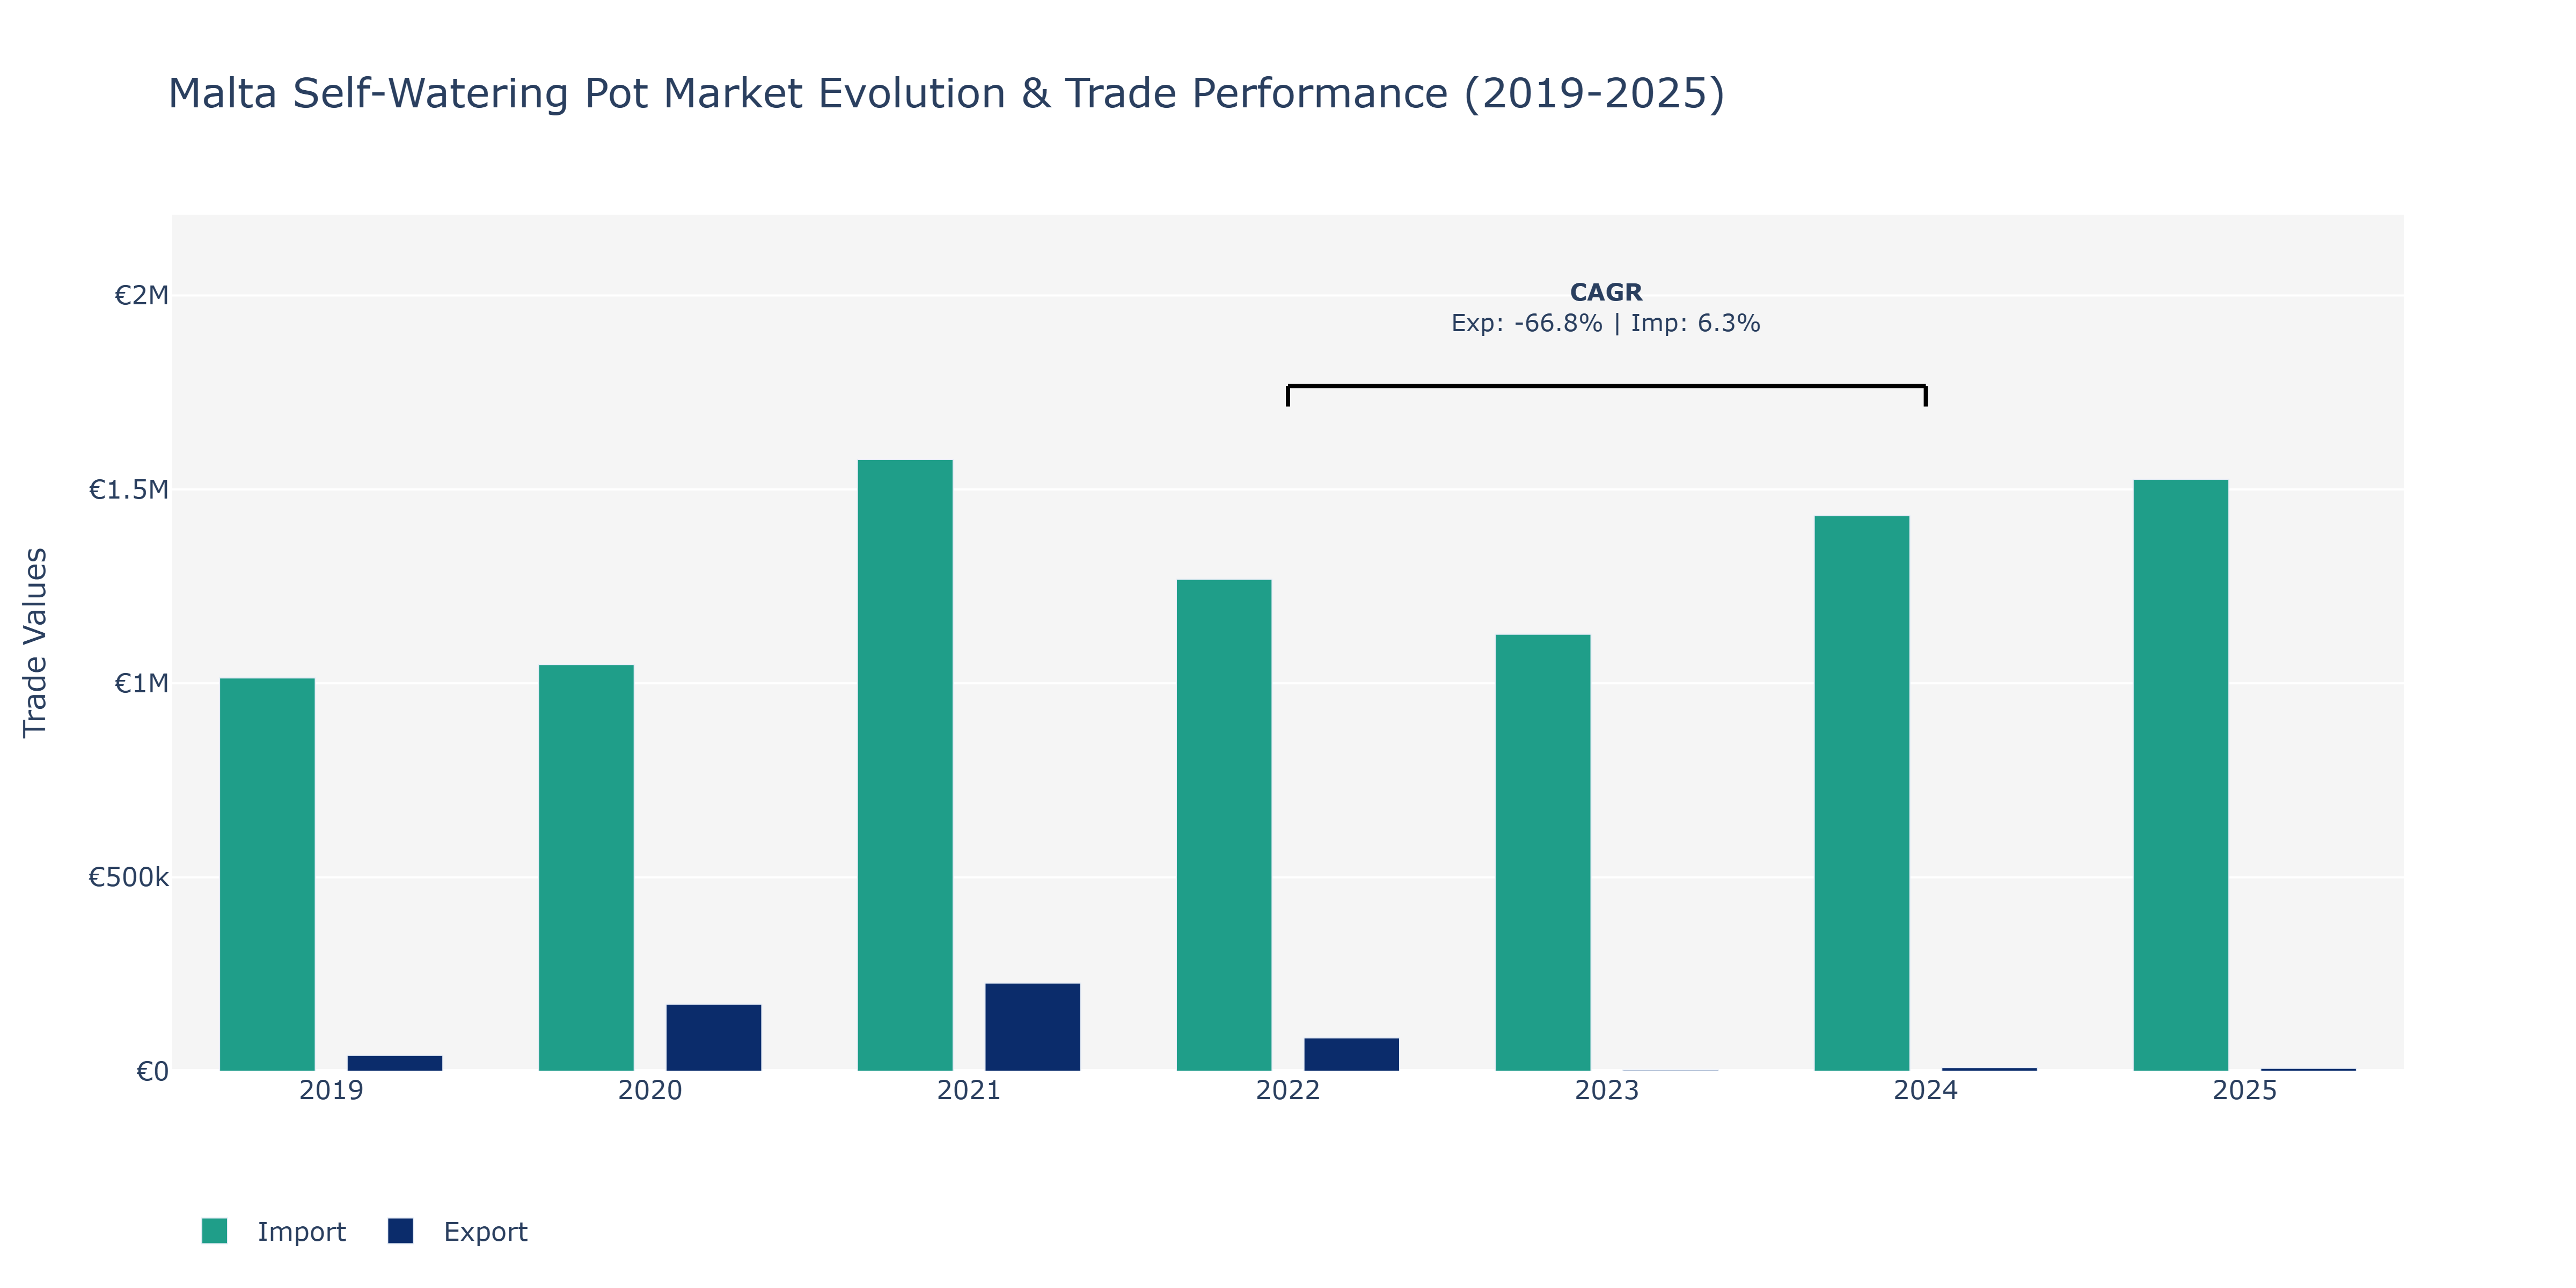
In the Malta Self-Watering Pot Market, exports experienced fluctuations over the years, starting notably at €40.64 thousand in 2019 and peaking at €227.18 thousand in 2021 before declining to €7.11 thousand in 2025. In contrast, imports consistently increased annually, from €1.01 million in 2019 to €1.53 million in 2025. The substantial rise in imports can be attributed to the growing popularity of self-watering pots, likely driven by increasing urbanization and the trend of sustainable living, prompting higher demand for such products. The varying Export value could reflect shifts in production capacities, market demand, or global economic conditions impacting trade volumes. The negative export CAGR of -66.76% from 2022 to 2024 underscores challenges faced by Maltese exporters, while the positive import CAGR of 6.28% highlights a steady growth trajectory driven by consumer preferences and market dynamics.
Key Highlights of the Report:
- Malta Self-Watering Pot Market Outlook
- Market Size of Malta Self-Watering Pot Market, 2025
- Forecast of Malta Self-Watering Pot Market, 2032
- Historical Data and Forecast of Malta Self-Watering Pot Revenues & Volume for the Period 2022 - 2032
- Malta Self-Watering Pot Market Trend Evolution
- Malta Self-Watering Pot Market Drivers and Challenges
- Malta Self-Watering Pot Price Trends
- Malta Self-Watering Pot Porter's Five Forces
- Malta Self-Watering Pot Industry Life Cycle
- Historical Data and Forecast of Malta Self-Watering Pot Market Revenues & Volume By Material for the Period 2022 - 2032
- Historical Data and Forecast of Malta Self-Watering Pot Market Revenues & Volume By Stone for the Period 2022 - 2032
- Historical Data and Forecast of Malta Self-Watering Pot Market Revenues & Volume By Wood for the Period 2022 - 2032
- Historical Data and Forecast of Malta Self-Watering Pot Market Revenues & Volume By Metal for the Period 2022 - 2032
- Historical Data and Forecast of Malta Self-Watering Pot Market Revenues & Volume By Polypropylene for the Period 2022 - 2032
- Historical Data and Forecast of Malta Self-Watering Pot Market Revenues & Volume By Others for the Period 2022 - 2032
- Historical Data and Forecast of Malta Self-Watering Pot Market Revenues & Volume By Mount Type for the Period 2022 - 2032
- Historical Data and Forecast of Malta Self-Watering Pot Market Revenues & Volume By Floor Standing for the Period 2022 - 2032
- Historical Data and Forecast of Malta Self-Watering Pot Market Revenues & Volume By Hanging for the Period 2022 - 2032
- Historical Data and Forecast of Malta Self-Watering Pot Market Revenues & Volume By Tabletop for the Period 2022 - 2032
- Historical Data and Forecast of Malta Self-Watering Pot Market Revenues & Volume By Wall Mount for the Period 2022 - 2032
- Historical Data and Forecast of Malta Self-Watering Pot Market Revenues & Volume By Window Mount for the Period 2022 - 2032
- Historical Data and Forecast of Malta Self-Watering Pot Market Revenues & Volume By Shape for the Period 2022 - 2032
- Historical Data and Forecast of Malta Self-Watering Pot Market Revenues & Volume By Oval for the Period 2022 - 2032
- Historical Data and Forecast of Malta Self-Watering Pot Market Revenues & Volume By Rectangular for the Period 2022 - 2032
- Historical Data and Forecast of Malta Self-Watering Pot Market Revenues & Volume By Round for the Period 2022 - 2032
- Historical Data and Forecast of Malta Self-Watering Pot Market Revenues & Volume By Square for the Period 2022 - 2032
- Historical Data and Forecast of Malta Self-Watering Pot Market Revenues & Volume By Depth for the Period 2022 - 2032
- Historical Data and Forecast of Malta Self-Watering Pot Market Revenues & Volume By Up to 9.9 in for the Period 2022 - 2032
- Historical Data and Forecast of Malta Self-Watering Pot Market Revenues & Volume By 10 to 11.9 in for the Period 2022 - 2032
- Historical Data and Forecast of Malta Self-Watering Pot Market Revenues & Volume By 12 to 17.9 in for the Period 2022 - 2032
- Historical Data and Forecast of Malta Self-Watering Pot Market Revenues & Volume By 18 to 23.9 in for the Period 2022 - 2032
- Historical Data and Forecast of Malta Self-Watering Pot Market Revenues & Volume By 24 in & above for the Period 2022 - 2032
- Historical Data and Forecast of Malta Self-Watering Pot Market Revenues & Volume By Price for the Period 2022 - 2032
- Historical Data and Forecast of Malta Self-Watering Pot Market Revenues & Volume By Low for the Period 2022 - 2032
- Historical Data and Forecast of Malta Self-Watering Pot Market Revenues & Volume By Medium for the Period 2022 - 2032
- Historical Data and Forecast of Malta Self-Watering Pot Market Revenues & Volume By High for the Period 2022 - 2032
- Historical Data and Forecast of Malta Self-Watering Pot Market Revenues & Volume By End-use for the Period 2022 - 2032
- Historical Data and Forecast of Malta Self-Watering Pot Market Revenues & Volume By Household/Residential for the Period 2022 - 2032
- Historical Data and Forecast of Malta Self-Watering Pot Market Revenues & Volume By Commercial for the Period 2022 - 2032
- Historical Data and Forecast of Malta Self-Watering Pot Market Revenues & Volume By Distribution Channel for the Period 2022 - 2032
- Historical Data and Forecast of Malta Self-Watering Pot Market Revenues & Volume By Online for the Period 2022 - 2032
- Historical Data and Forecast of Malta Self-Watering Pot Market Revenues & Volume By Offline for the Period 2022 - 2032
- Malta Self-Watering Pot Import Export Trade Statistics
- Market Opportunity Assessment By Material
- Market Opportunity Assessment By Mount Type
- Market Opportunity Assessment By Shape
- Market Opportunity Assessment By Depth
- Market Opportunity Assessment By Price
- Market Opportunity Assessment By End-use
- Market Opportunity Assessment By Distribution Channel
- Malta Self-Watering Pot Top Companies Market Share
- Malta Self-Watering Pot Competitive Benchmarking By Technical and Operational Parameters
- Malta Self-Watering Pot Company Profiles
- Malta Self-Watering Pot Key Strategic Recommendations
Frequently Asked Questions About the Market Study (FAQs):
6Wresearch actively monitors the Malta Self-Watering Pot Market and publishes its comprehensive annual report, highlighting emerging trends, growth drivers, revenue analysis, and forecast outlook. Our insights help businesses to make data-backed strategic decisions with ongoing market dynamics. Our analysts track relevent industries related to the Malta Self-Watering Pot Market, allowing our clients with actionable intelligence and reliable forecasts tailored to emerging regional needs.
Yes, we provide customisation as per your requirements. To learn more, feel free to contact us on sales@6wresearch.com
1 Executive Summary |
2 Introduction |
2.1 Key Highlights of the Report |
2.2 Report Description |
2.3 Market Scope & Segmentation |
2.4 Research Methodology |
2.5 Assumptions |
3 Malta Self-Watering Pot Market Overview |
3.1 Malta Country Macro Economic Indicators |
3.2 Malta Self-Watering Pot Market Revenues & Volume, 2022 & 2032F |
3.3 Malta Self-Watering Pot Market - Industry Life Cycle |
3.4 Malta Self-Watering Pot Market - Porter's Five Forces |
3.5 Malta Self-Watering Pot Market Revenues & Volume Share, By Material, 2022 & 2032F |
3.6 Malta Self-Watering Pot Market Revenues & Volume Share, By Mount Type, 2022 & 2032F |
3.7 Malta Self-Watering Pot Market Revenues & Volume Share, By Shape, 2022 & 2032F |
3.8 Malta Self-Watering Pot Market Revenues & Volume Share, By Depth, 2022 & 2032F |
3.9 Malta Self-Watering Pot Market Revenues & Volume Share, By Price, 2022 & 2032F |
3.10 Malta Self-Watering Pot Market Revenues & Volume Share, By End-use, 2022 & 2032F |
3.11 Malta Self-Watering Pot Market Revenues & Volume Share, By Distribution Channel, 2022 & 2032F |
4 Malta Self-Watering Pot Market Dynamics |
4.1 Impact Analysis |
4.2 Market Drivers |
4.2.1 Increasing awareness about water conservation and sustainable gardening practices |
4.2.2 Growing interest in home gardening and indoor plants |
4.2.3 Convenience and time-saving benefits of self-watering pots |
4.3 Market Restraints |
4.3.1 High initial cost of self-watering pots compared to traditional pots |
4.3.2 Limited availability and variety of self-watering pot options in the market |
4.3.3 Lack of education and knowledge about the benefits and usage of self-watering pots |
5 Malta Self-Watering Pot Market Trends |
6 Malta Self-Watering Pot Market, By Types |
6.1 Malta Self-Watering Pot Market, By Material |
6.1.1 Overview and Analysis |
6.1.2 Malta Self-Watering Pot Market Revenues & Volume, By Material, 2022 - 2032F |
6.1.3 Malta Self-Watering Pot Market Revenues & Volume, By Stone, 2022 - 2032F |
6.1.4 Malta Self-Watering Pot Market Revenues & Volume, By Wood, 2022 - 2032F |
6.1.5 Malta Self-Watering Pot Market Revenues & Volume, By Metal, 2022 - 2032F |
6.1.6 Malta Self-Watering Pot Market Revenues & Volume, By Polypropylene, 2022 - 2032F |
6.1.7 Malta Self-Watering Pot Market Revenues & Volume, By Others, 2022 - 2032F |
6.2 Malta Self-Watering Pot Market, By Mount Type |
6.2.1 Overview and Analysis |
6.2.2 Malta Self-Watering Pot Market Revenues & Volume, By Floor Standing, 2022 - 2032F |
6.2.3 Malta Self-Watering Pot Market Revenues & Volume, By Hanging, 2022 - 2032F |
6.2.4 Malta Self-Watering Pot Market Revenues & Volume, By Tabletop, 2022 - 2032F |
6.2.5 Malta Self-Watering Pot Market Revenues & Volume, By Wall Mount, 2022 - 2032F |
6.2.6 Malta Self-Watering Pot Market Revenues & Volume, By Window Mount, 2022 - 2032F |
6.3 Malta Self-Watering Pot Market, By Shape |
6.3.1 Overview and Analysis |
6.3.2 Malta Self-Watering Pot Market Revenues & Volume, By Oval, 2022 - 2032F |
6.3.3 Malta Self-Watering Pot Market Revenues & Volume, By Rectangular, 2022 - 2032F |
6.3.4 Malta Self-Watering Pot Market Revenues & Volume, By Round, 2022 - 2032F |
6.3.5 Malta Self-Watering Pot Market Revenues & Volume, By Square, 2022 - 2032F |
6.4 Malta Self-Watering Pot Market, By Depth |
6.4.1 Overview and Analysis |
6.4.2 Malta Self-Watering Pot Market Revenues & Volume, By Up to 9.9 in, 2022 - 2032F |
6.4.3 Malta Self-Watering Pot Market Revenues & Volume, By 10 to 11.9 in, 2022 - 2032F |
6.4.4 Malta Self-Watering Pot Market Revenues & Volume, By 12 to 17.9 in, 2022 - 2032F |
6.4.5 Malta Self-Watering Pot Market Revenues & Volume, By 18 to 23.9 in, 2022 - 2032F |
6.4.6 Malta Self-Watering Pot Market Revenues & Volume, By 24 in & above, 2022 - 2032F |
6.5 Malta Self-Watering Pot Market, By Price |
6.5.1 Overview and Analysis |
6.5.2 Malta Self-Watering Pot Market Revenues & Volume, By Low, 2022 - 2032F |
6.5.3 Malta Self-Watering Pot Market Revenues & Volume, By Medium, 2022 - 2032F |
6.5.4 Malta Self-Watering Pot Market Revenues & Volume, By High, 2022 - 2032F |
6.6 Malta Self-Watering Pot Market, By End-use |
6.6.1 Overview and Analysis |
6.6.2 Malta Self-Watering Pot Market Revenues & Volume, By Household/Residential, 2022 - 2032F |
6.6.3 Malta Self-Watering Pot Market Revenues & Volume, By Commercial, 2022 - 2032F |
6.7 Malta Self-Watering Pot Market, By Distribution Channel |
6.7.1 Overview and Analysis |
6.7.2 Malta Self-Watering Pot Market Revenues & Volume, By Online, 2022 - 2032F |
6.7.3 Malta Self-Watering Pot Market Revenues & Volume, By Offline, 2022 - 2032F |
7 Malta Self-Watering Pot Market Import-Export Trade Statistics |
7.1 Malta Self-Watering Pot Market Export to Major Countries |
7.2 Malta Self-Watering Pot Market Imports from Major Countries |
8 Malta Self-Watering Pot Market Key Performance Indicators |
8.1 Average time spent on gardening activities per household |
8.2 Number of households participating in home gardening |
8.3 Percentage of households using self-watering pots for gardening |
9 Malta Self-Watering Pot Market - Opportunity Assessment |
9.1 Malta Self-Watering Pot Market Opportunity Assessment, By Material, 2022 & 2032F |
9.2 Malta Self-Watering Pot Market Opportunity Assessment, By Mount Type, 2022 & 2032F |
9.3 Malta Self-Watering Pot Market Opportunity Assessment, By Shape, 2022 & 2032F |
9.4 Malta Self-Watering Pot Market Opportunity Assessment, By Depth, 2022 & 2032F |
9.5 Malta Self-Watering Pot Market Opportunity Assessment, By Price, 2022 & 2032F |
9.6 Malta Self-Watering Pot Market Opportunity Assessment, By End-use, 2022 & 2032F |
9.7 Malta Self-Watering Pot Market Opportunity Assessment, By Distribution Channel, 2022 & 2032F |
10 Malta Self-Watering Pot Market - Competitive Landscape |
10.1 Malta Self-Watering Pot Market Revenue Share, By Companies, 2025 |
10.2 Malta Self-Watering Pot Market Competitive Benchmarking, By Operating and Technical Parameters |
11 Company Profiles |
12 Recommendations |
13 Disclaimer |
Export potential assessment - trade Analytics for 2030
Export potential enables firms to identify high-growth global markets with greater confidence by combining advanced trade intelligence with a structured quantitative methodology. The framework analyzes emerging demand trends and country-level import patterns while integrating macroeconomic and trade datasets such as GDP and population forecasts, bilateral import–export flows, tariff structures, elasticity differentials between developed and developing economies, geographic distance, and import demand projections. Using weighted trade values from 2020–2024 as the base period to project country-to-country export potential for 2030, these inputs are operationalized through calculated drivers such as gravity model parameters, tariff impact factors, and projected GDP per-capita growth. Through an analysis of hidden potentials, demand hotspots, and market conditions that are most favorable to success, this method enables firms to focus on target countries, maximize returns, and global expansion with data, backed by accuracy.
By factoring in the projected importer demand gap that is currently unmet and could be potential opportunity, it identifies the potential for the Exporter (Country) among 190 countries, against the general trade analysis, which identifies the biggest importer or exporter.
To discover high-growth global markets and optimize your business strategy:
Click Here
Pricing
- Single User License$ 1,995
- Department License$ 2,400
- Site License$ 3,120
- Global License$ 3,795

Search
Thought Leadership and Analyst Meet


Our Clients
Latest Reports
- Canada Cloud CFD Market (2026-2032) | Size & Revenue, Industry, Growth, Competitive Landscape, Forecast, Segmentation, Value, Outlook, Trends, Share, Analysis, Companies
- Taiwan Food Delivery Platform Market (2026-2032) | Companies, Outlook, Analysis, Trends, Value, Revenue, Segmentation, Share, Forecast, Competitive Landscape, Growth, Size & Forecast
- United Kingdom (UK) Long-term Care Insurance Market (2026-2032) | Growth, Share, Consumer Insights, Drivers, Opportunities, Competition, Pricing Analysis, Segments, Restraints, Companies, Competitive, Value, Outlook, Size, Demand, Analysis, Challenges, Strategic Insights, Investment Trends, Revenue, Trends, Supply, Forecast
- United Kingdom (UK) Long Term Care Market (2026-2032) | Companies, Outlook, Analysis, Trends, Value, Revenue, Segmentation, Share, Forecast, Competitive Landscape, Growth, Size & Forecast
- Iraq Insulation and Waterproofing Market (2026-2032) | Outlook, Drivers, Growth, Size, Share, Industry, Revenue, Trends, Demand, Competitive, Strategic Insights, Opportunities, Segments, Companies, Challenges, Strategy, Consumer Insights, Analysis, Investment Trends, Value, Segmentation, Forecast, Restraints
- India Switchgear Market Outlook (2026-2032) | Size, Share, Trends, Growth, Revenue, Forecast, Analysis, Value, Outlook
- Pakistan Contraceptive Implants Market (2025-2031) | Demand, Growth, Size, Share, Industry, Pricing Analysis, Competitive, Strategic Insights, Strategy, Consumer Insights, Analysis, Investment Trends, Opportunities, Revenue, Segments, Value, Segmentation, Supply, Forecast, Restraints, Outlook, Competition, Drivers, Trends, Companies, Challenges
- Sri Lanka Packaging Market (2026-2032) | Outlook, Competition, Drivers, Trends, Demand, Pricing Analysis, Competitive, Strategic Insights, Companies, Challenges, Strategy, Consumer Insights, Analysis, Investment Trends, Opportunities, Growth, Size, Share, Industry, Revenue, Segments, Value, Segmentation, Supply, Forecast, Restraints
- India Kids Watches Market (2026-2032) | Strategy, Consumer Insights, Analysis, Investment Trends, Opportunities, Growth, Size, Share, Industry, Revenue, Segments, Value, Segmentation, Supply, Forecast, Restraints, Outlook, Competition, Drivers, Trends, Demand, Pricing Analysis, Competitive, Strategic Insights, Companies, Challenges
- Saudi Arabia Core Assurance Service Market (2025-2031) | Strategy, Consumer Insights, Analysis, Investment Trends, Opportunities, Growth, Size, Share, Industry, Revenue, Segments, Value, Segmentation, Supply, Forecast, Restraints, Outlook, Competition, Drivers, Trends, Demand, Pricing Analysis, Competitive, Strategic Insights, Companies, Challenges
Industry Events and Analyst Meet

India EV Show 2026

EV tech India Expo 2026

Auto Tech Asia 2026

Battery Tech India 2026

Smart Production Solutions Guangzhou 2026
Whitepaper
- Middle East & Africa Commercial Security Market Click here to view more.
- Middle East & Africa Fire Safety Systems & Equipment Market Click here to view more.
- GCC Drone Market Click here to view more.
- Middle East Lighting Fixture Market Click here to view more.
- GCC Physical & Perimeter Security Market Click here to view more.
6WResearch In News
- Doha a strategic location for EV manufacturing hub: IPA Qatar
- Demand for luxury TVs surging in the GCC, says Samsung
- Empowering Growth: The Thriving Journey of Bangladesh’s Cable Industry
- Demand for luxury TVs surging in the GCC, says Samsung
- Video call with a traditional healer? Once unthinkable, it’s now common in South Africa
- Intelligent Buildings To Smooth GCC’s Path To Net Zero