Malta Silicon Dioxide Market (2026-2032) | Outlook, Share, Trends, Forecast, Size, Industry, Growth, Segmentation, Revenue, Analysis, Companies & Value
Market Forecast By Form (Amorphous, Crystalline, Quartz, Tridymite, Cristobalite), By Source (Natural, Synthetic), By Industry (Chemical, Electrical, Pharmaceutical, Food & Beverage, Others), By Application (Adhesives and sealants, Coatings, Food additives, Greases, Composites, Printing and packaging, Others) And Competitive Landscape
| Product Code: ETC4861348 | Publication Date: Nov 2023 | Updated Date: Apr 2026 | Product Type: Market Research Report | |
| Publisher: 6Wresearch | Author: Shubham Padhi | No. of Pages: 60 | No. of Figures: 30 | No. of Tables: 5 |
Malta Silicon Dioxide Market Size (2020-2030)
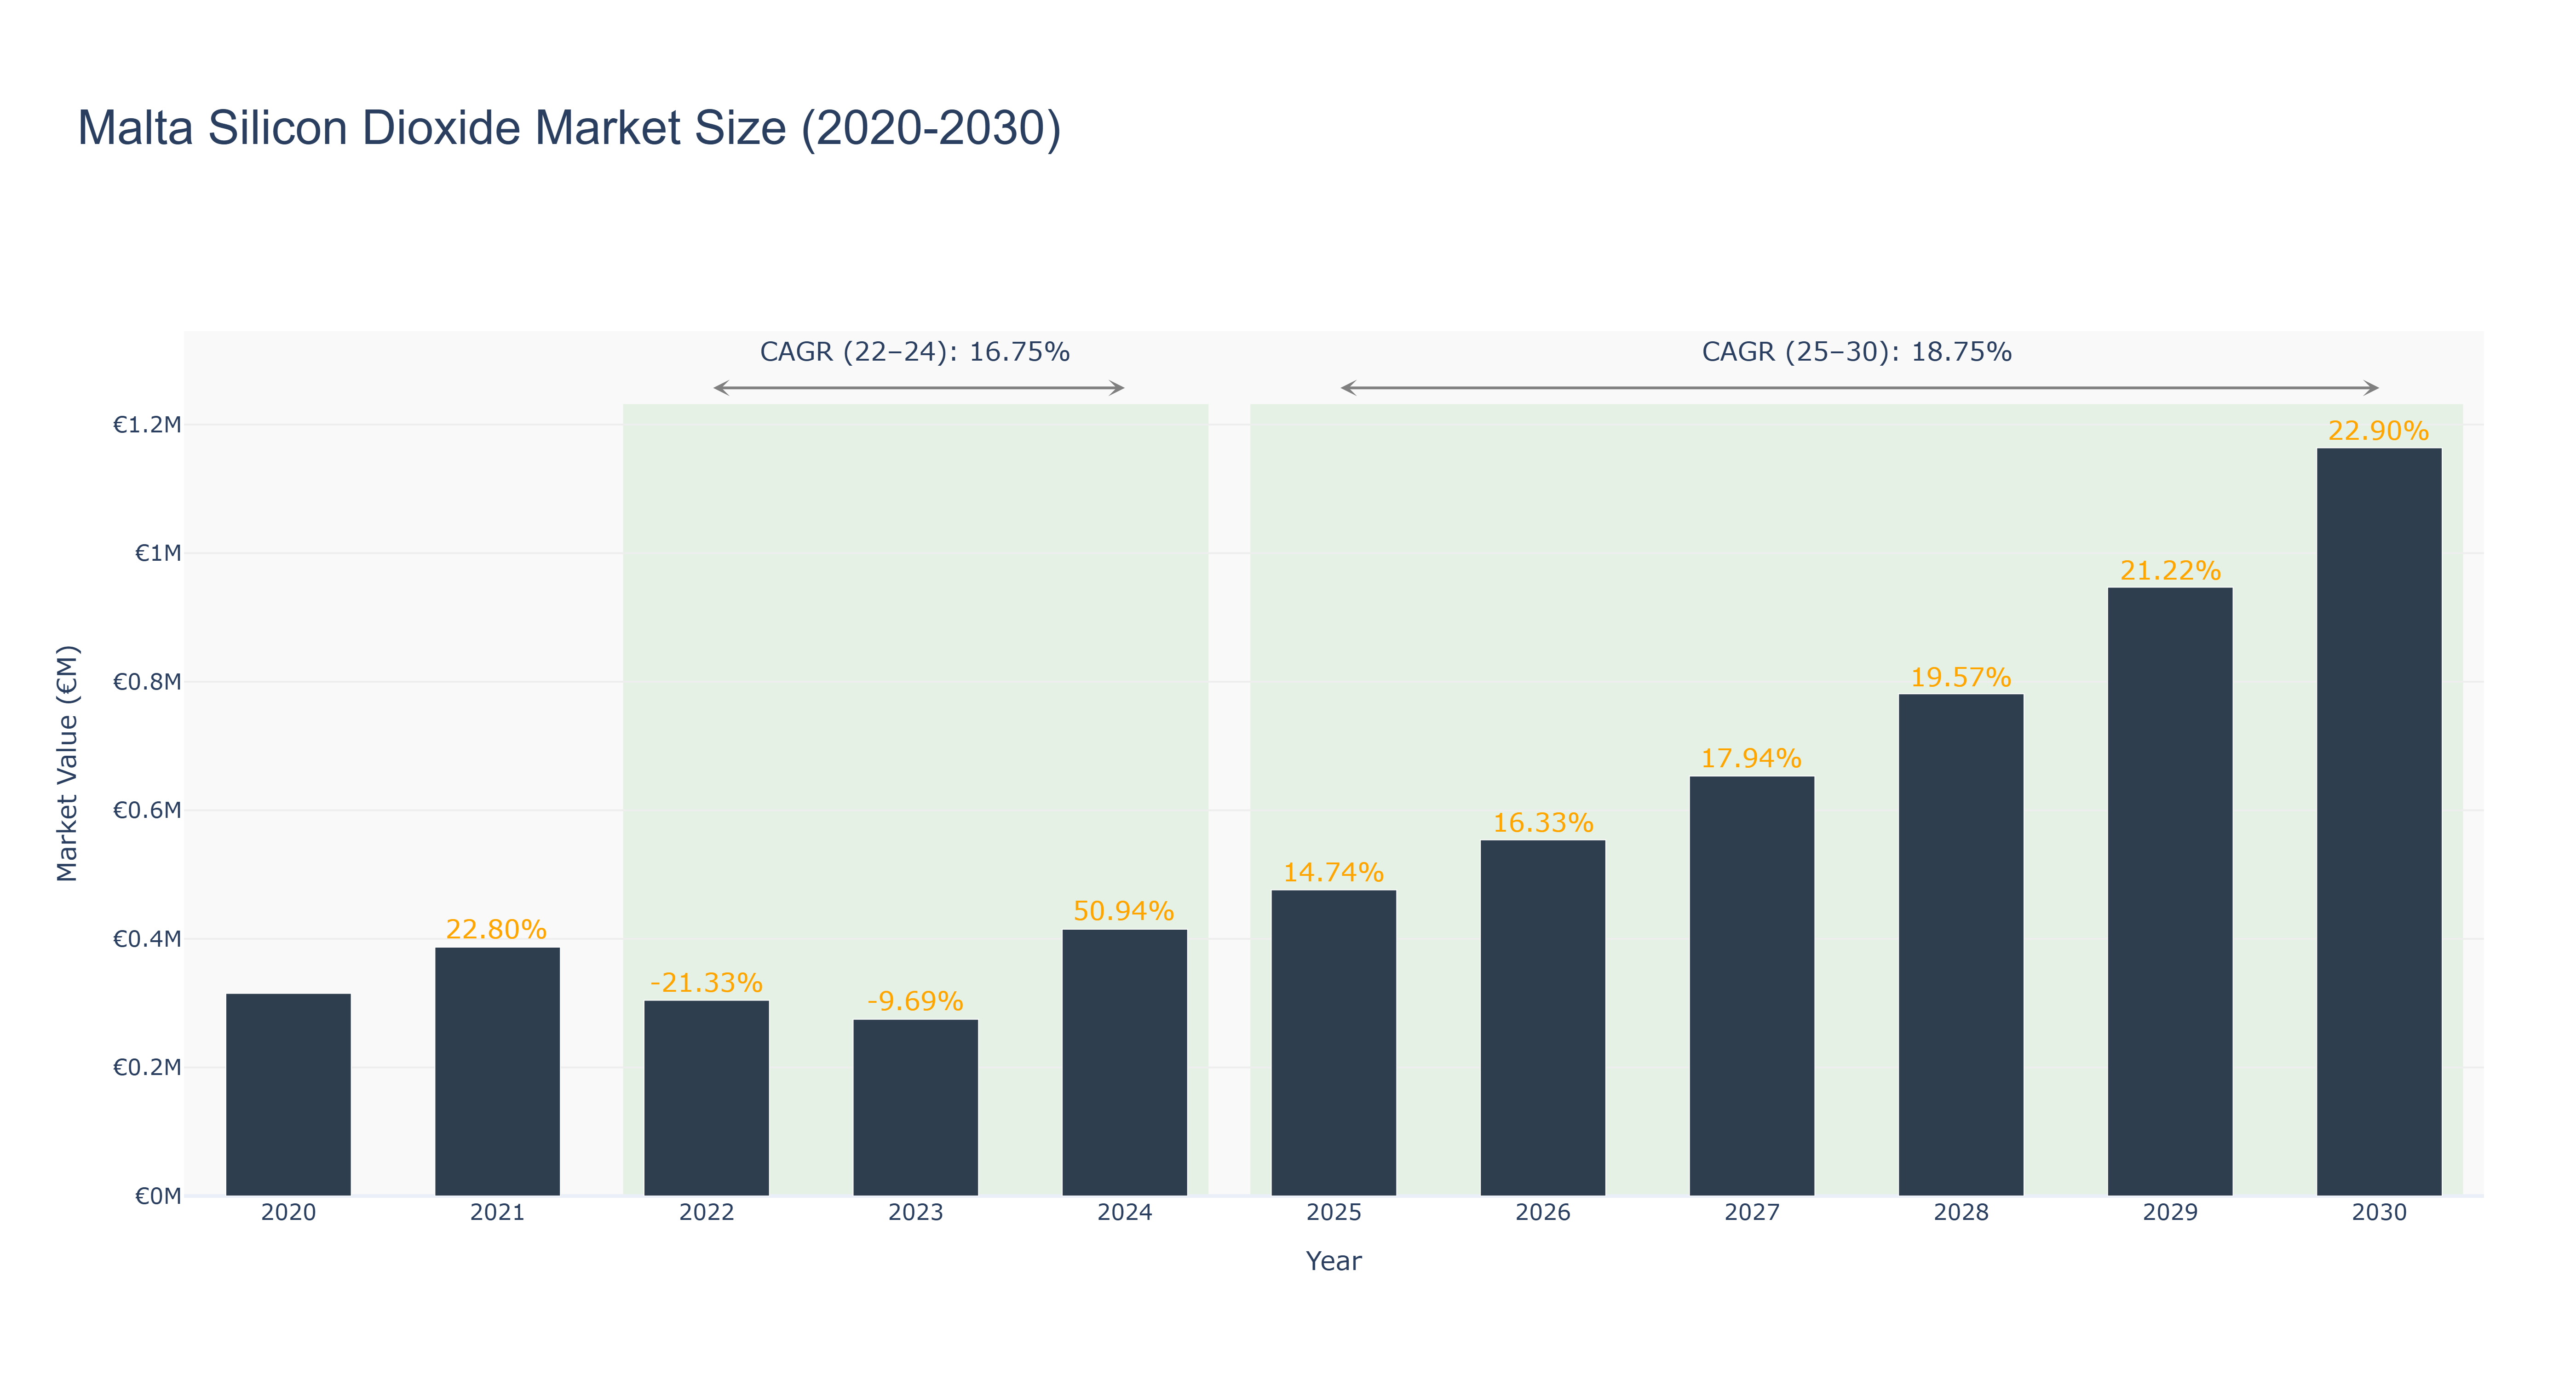
Malta Silicon Dioxide Market has shown a fluctuating trend in market size over the years. The peak market size was €1.16 million in 2030, with a steady growth rate. From 2020 to 2024, the market size ranged from €0.32 million to €0.42 million, experiencing significant growth in 2024. Notably, the market is forecasted to grow further from 2025 to 2030, with an expected size of €1.16 million in 2030. The CAGR values for the periods 2022-24 and 2025-30 are 16.75% and 18.75% respectively. The market's growth can be attributed to increasing demand for silicon dioxide in various industries, such as pharmaceuticals and electronics. Looking ahead, Malta is set to launch a new sustainable energy project aimed at reducing manufacturing costs for silicon dioxide, further driving market growth and innovation in the coming years.
Malta Silicon Dioxide Market: Production & Trade Performance (2019-2025)
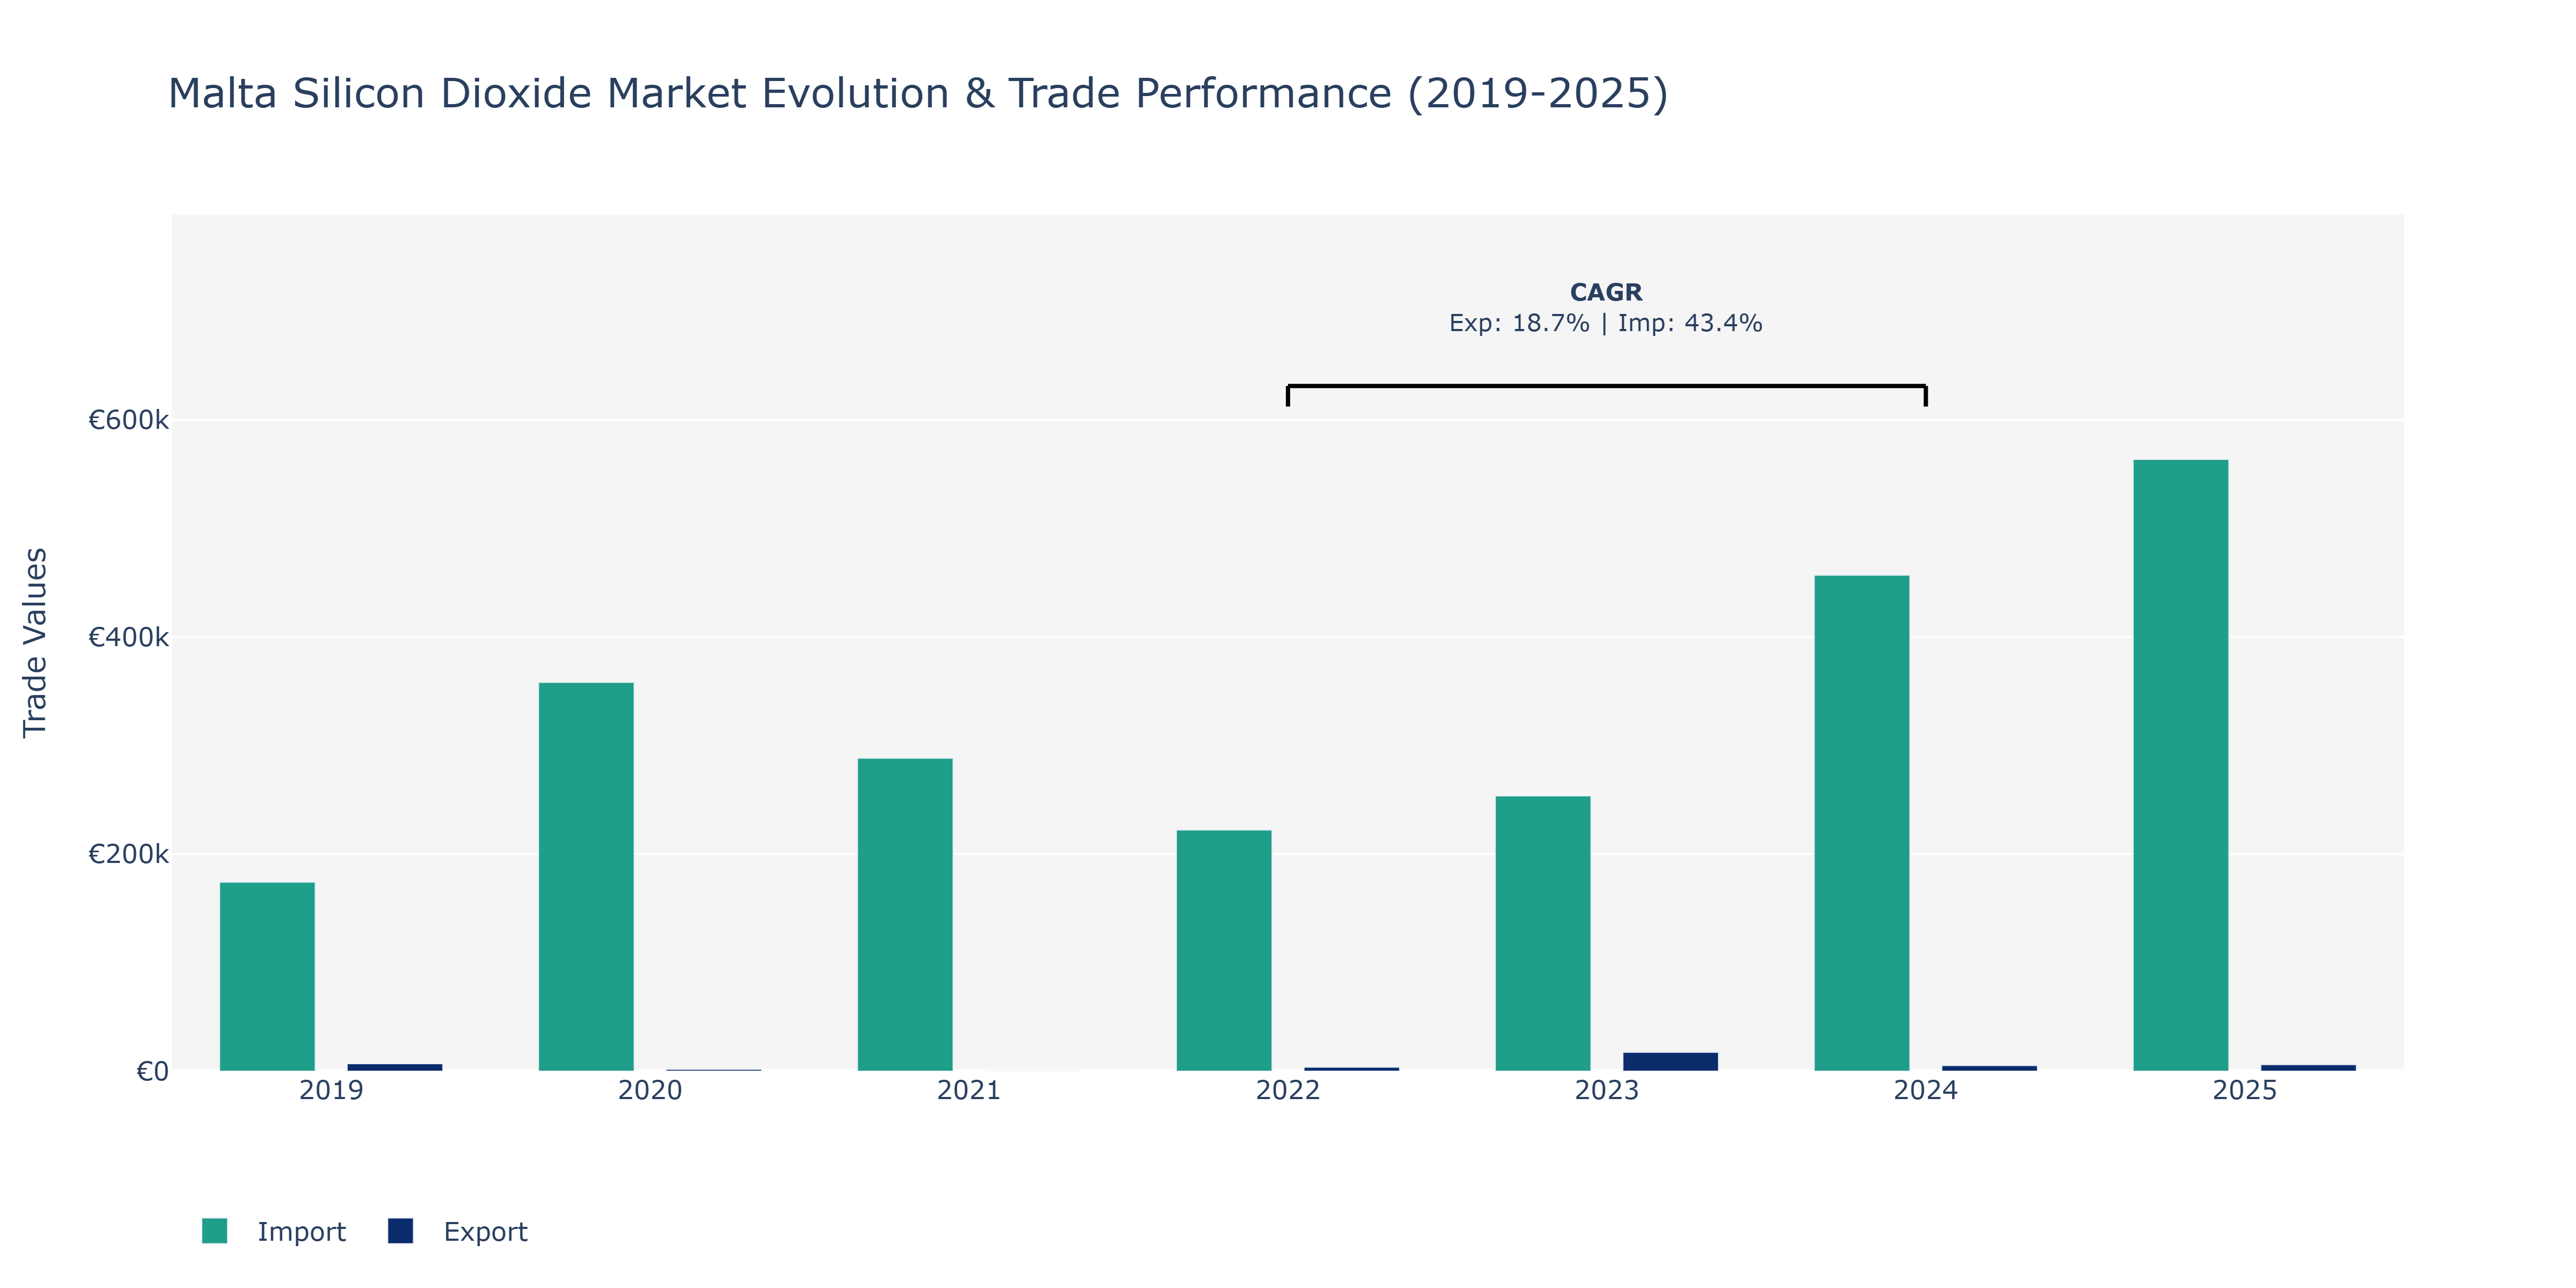
Between 2019 and 2025, Malta's Silicon Dioxide market experienced notable fluctuations in both Exports and Imports. In 2019, Imports reached a substantial €174.23 thousand while Exports were at €6.88 thousand. Exports sharply declined in 2021 to €157 thousand, possibly due to global economic challenges. However, a significant rebound occurred in 2023, with Exports soaring to €17.45 thousand, possibly indicating enhanced production or expanded market access. Imports peaked in 2025 at €563.75 thousand, showcasing a continuous upward trend since 2019, potentially driven by Malta's increasing demand for Silicon Dioxide or shifts in global supply chains. The CAGRs for Exports and Imports between 2022 and 2024 at 18.72% and 43.38% respectively suggest robust market growth and heightened trade activities, aligning with the global trend of increasing demand for silicon-based products in various industries. Such fluctuations reflect the market's responsiveness to economic dynamics and evolving industry demands, emphasizing the importance of strategic planning and adaptability in the Silicon Dioxide sector.
Key Highlights of the Report:
- Malta Silicon Dioxide Market Outlook
- Market Size of Malta Silicon Dioxide Market, 2025
- Forecast of Malta Silicon Dioxide Market, 2032
- Historical Data and Forecast of Malta Silicon Dioxide Revenues & Volume for the Period 2022 - 2032F
- Malta Silicon Dioxide Market Trend Evolution
- Malta Silicon Dioxide Market Drivers and Challenges
- Malta Silicon Dioxide Price Trends
- Malta Silicon Dioxide Porter`s Five Forces
- Malta Silicon Dioxide Industry Life Cycle
- Historical Data and Forecast of Malta Silicon Dioxide Market Revenues & Volume By Form for the Period 2022 - 2032F
- Historical Data and Forecast of Malta Silicon Dioxide Market Revenues & Volume By Amorphous for the Period 2022 - 2032F
- Historical Data and Forecast of Malta Silicon Dioxide Market Revenues & Volume By Crystalline for the Period 2022 - 2032F
- Historical Data and Forecast of Malta Silicon Dioxide Market Revenues & Volume By Quartz for the Period 2022 - 2032F
- Historical Data and Forecast of Malta Silicon Dioxide Market Revenues & Volume By Tridymite for the Period 2022 - 2032F
- Historical Data and Forecast of Malta Silicon Dioxide Market Revenues & Volume By Cristobalite for the Period 2022 - 2032F
- Historical Data and Forecast of Malta Silicon Dioxide Market Revenues & Volume By Source for the Period 2022 - 2032F
- Historical Data and Forecast of Malta Silicon Dioxide Market Revenues & Volume By Natural for the Period 2022 - 2032F
- Historical Data and Forecast of Malta Silicon Dioxide Market Revenues & Volume By Synthetic for the Period 2022 - 2032F
- Historical Data and Forecast of Malta Silicon Dioxide Market Revenues & Volume By Industry for the Period 2022 - 2032F
- Historical Data and Forecast of Malta Silicon Dioxide Market Revenues & Volume By Chemical for the Period 2022 - 2032F
- Historical Data and Forecast of Malta Silicon Dioxide Market Revenues & Volume By Electrical for the Period 2022 - 2032F
- Historical Data and Forecast of Malta Silicon Dioxide Market Revenues & Volume By Pharmaceutical for the Period 2022 - 2032F
- Historical Data and Forecast of Malta Silicon Dioxide Market Revenues & Volume By Food & Beverage for the Period 2022 - 2032F
- Historical Data and Forecast of Malta Silicon Dioxide Market Revenues & Volume By Others for the Period 2022 - 2032F
- Historical Data and Forecast of Malta Silicon Dioxide Market Revenues & Volume By Application for the Period 2022 - 2032F
- Historical Data and Forecast of Malta Silicon Dioxide Market Revenues & Volume By Adhesives and sealants for the Period 2022 - 2032F
- Historical Data and Forecast of Malta Silicon Dioxide Market Revenues & Volume By Coatings for the Period 2022 - 2032F
- Historical Data and Forecast of Malta Silicon Dioxide Market Revenues & Volume By Food additives for the Period 2022 - 2032F
- Historical Data and Forecast of Malta Silicon Dioxide Market Revenues & Volume By Greases for the Period 2022 - 2032F
- Historical Data and Forecast of Malta Silicon Dioxide Market Revenues & Volume By Composites for the Period 2022 - 2032F
- Historical Data and Forecast of Malta Silicon Dioxide Market Revenues & Volume By Printing and packaging for the Period 2022 - 2032F
- Historical Data and Forecast of Malta Silicon Dioxide Market Revenues & Volume By Others for the Period 2022 - 2032F
- Malta Silicon Dioxide Import Export Trade Statistics
- Market Opportunity Assessment By Form
- Market Opportunity Assessment By Source
- Market Opportunity Assessment By Industry
- Market Opportunity Assessment By Application
- Malta Silicon Dioxide Top Companies Market Share
- Malta Silicon Dioxide Competitive Benchmarking By Technical and Operational Parameters
- Malta Silicon Dioxide Company Profiles
- Malta Silicon Dioxide Key Strategic Recommendations
Frequently Asked Questions About the Market Study (FAQs):
6Wresearch actively monitors the Malta Silicon Dioxide Market and publishes its comprehensive annual report, highlighting emerging trends, growth drivers, revenue analysis, and forecast outlook. Our insights help businesses to make data-backed strategic decisions with ongoing market dynamics. Our analysts track relevent industries related to the Malta Silicon Dioxide Market, allowing our clients with actionable intelligence and reliable forecasts tailored to emerging regional needs.
Yes, we provide customisation as per your requirements. To learn more, feel free to contact us on sales@6wresearch.com
1 Executive Summary |
2 Introduction |
2.1 Key Highlights of the Report |
2.2 Report Description |
2.3 Market Scope & Segmentation |
2.4 Research Methodology |
2.5 Assumptions |
3 Malta Silicon Dioxide Market Overview |
3.1 Malta Country Macro Economic Indicators |
3.2 Malta Silicon Dioxide Market Revenues & Volume, 2022 & 2032F |
3.3 Malta Silicon Dioxide Market - Industry Life Cycle |
3.4 Malta Silicon Dioxide Market - Porter's Five Forces |
3.5 Malta Silicon Dioxide Market Revenues & Volume Share, By Form, 2022 & 2032F |
3.6 Malta Silicon Dioxide Market Revenues & Volume Share, By Source, 2022 & 2032F |
3.7 Malta Silicon Dioxide Market Revenues & Volume Share, By Industry, 2022 & 2032F |
3.8 Malta Silicon Dioxide Market Revenues & Volume Share, By Application, 2022 & 2032F |
4 Malta Silicon Dioxide Market Dynamics |
4.1 Impact Analysis |
4.2 Market Drivers |
4.3 Market Restraints |
5 Malta Silicon Dioxide Market Trends |
6 Malta Silicon Dioxide Market Segmentations |
6.1 Malta Silicon Dioxide Market, By Form |
6.1.1 Overview and Analysis |
6.1.2 Malta Silicon Dioxide Market Revenues & Volume, By Amorphous, 2022 - 2032F |
6.1.3 Malta Silicon Dioxide Market Revenues & Volume, By Crystalline, 2022 - 2032F |
6.1.4 Malta Silicon Dioxide Market Revenues & Volume, By Quartz, 2022 - 2032F |
6.1.5 Malta Silicon Dioxide Market Revenues & Volume, By Tridymite, 2022 - 2032F |
6.1.6 Malta Silicon Dioxide Market Revenues & Volume, By Cristobalite, 2022 - 2032F |
6.2 Malta Silicon Dioxide Market, By Source |
6.2.1 Overview and Analysis |
6.2.2 Malta Silicon Dioxide Market Revenues & Volume, By Natural, 2022 - 2032F |
6.2.3 Malta Silicon Dioxide Market Revenues & Volume, By Synthetic, 2022 - 2032F |
6.3 Malta Silicon Dioxide Market, By Industry |
6.3.1 Overview and Analysis |
6.3.2 Malta Silicon Dioxide Market Revenues & Volume, By Chemical, 2022 - 2032F |
6.3.3 Malta Silicon Dioxide Market Revenues & Volume, By Electrical, 2022 - 2032F |
6.3.4 Malta Silicon Dioxide Market Revenues & Volume, By Pharmaceutical, 2022 - 2032F |
6.3.5 Malta Silicon Dioxide Market Revenues & Volume, By Food & Beverage, 2022 - 2032F |
6.3.6 Malta Silicon Dioxide Market Revenues & Volume, By Others, 2022 - 2032F |
6.4 Malta Silicon Dioxide Market, By Application |
6.4.1 Overview and Analysis |
6.4.2 Malta Silicon Dioxide Market Revenues & Volume, By Adhesives and sealants, 2022 - 2032F |
6.4.3 Malta Silicon Dioxide Market Revenues & Volume, By Coatings, 2022 - 2032F |
6.4.4 Malta Silicon Dioxide Market Revenues & Volume, By Food additives, 2022 - 2032F |
6.4.5 Malta Silicon Dioxide Market Revenues & Volume, By Greases, 2022 - 2032F |
6.4.6 Malta Silicon Dioxide Market Revenues & Volume, By Composites, 2022 - 2032F |
6.4.7 Malta Silicon Dioxide Market Revenues & Volume, By Printing and packaging, 2022 - 2032F |
7 Malta Silicon Dioxide Market Import-Export Trade Statistics |
7.1 Malta Silicon Dioxide Market Export to Major Countries |
7.2 Malta Silicon Dioxide Market Imports from Major Countries |
8 Malta Silicon Dioxide Market Key Performance Indicators |
9 Malta Silicon Dioxide Market - Opportunity Assessment |
9.1 Malta Silicon Dioxide Market Opportunity Assessment, By Form, 2022 & 2032F |
9.2 Malta Silicon Dioxide Market Opportunity Assessment, By Source, 2022 & 2032F |
9.3 Malta Silicon Dioxide Market Opportunity Assessment, By Industry, 2022 & 2032F |
9.4 Malta Silicon Dioxide Market Opportunity Assessment, By Application, 2022 & 2032F |
10 Malta Silicon Dioxide Market - Competitive Landscape |
10.1 Malta Silicon Dioxide Market Revenue Share, By Companies, 2025 |
10.2 Malta Silicon Dioxide Market Competitive Benchmarking, By Operating and Technical Parameters |
11 Company Profiles |
12 Recommendations | 13 Disclaimer |
Global Go To Market Strategy - 2030
Export potential enables firms to identify high-growth global markets with greater confidence by combining advanced trade intelligence with a structured quantitative methodology. The framework analyzes emerging demand trends and country-level import patterns while integrating macroeconomic and trade datasets such as GDP and population forecasts, bilateral import–export flows, tariff structures, elasticity differentials between developed and developing economies, geographic distance, and import demand projections. Using weighted trade values from 2020–2024 as the base period to project country-to-country export potential for 2030, these inputs are operationalized through calculated drivers such as gravity model parameters, tariff impact factors, and projected GDP per-capita growth. Through an analysis of hidden potentials, demand hotspots, and market conditions that are most favorable to success, this method enables firms to focus on target countries, maximize returns, and global expansion with data, backed by accuracy.
By factoring in the projected importer demand gap that is currently unmet and could be potential opportunity, it identifies the potential for the Exporter (Country) among 190 countries, against the general trade analysis, which identifies the biggest importer or exporter.
To discover high-growth global markets and optimize your business strategy:
Click Here
Pricing
- Single User License$ 1,995
- Department License$ 2,400
- Site License$ 3,120
- Global License$ 3,795

Leadership Perspectives from Industry Events
Search
Thought Leadership and Analyst Meet


Our Clients
6WResearch In News
- Doha a strategic location for EV manufacturing hub: IPA Qatar
- Demand for luxury TVs surging in the GCC, says Samsung
- Empowering Growth: The Thriving Journey of Bangladesh’s Cable Industry
- Demand for luxury TVs surging in the GCC, says Samsung
- Video call with a traditional healer? Once unthinkable, it’s now common in South Africa
- Intelligent Buildings To Smooth GCC’s Path To Net Zero
Latest Reports
- Taiwan Airport Wireless Infrastructure Market (2026-2032)
- Vietnam Airport Wireless Infrastructure Market (2026-2032)
- Thailand Airport Wireless Infrastructure Market (2026-2032)
- South Korea Airport Wireless Infrastructure Market (2026-2032)
- Romania Airport Wireless Infrastructure Market (2026-2032)
- Qatar Airport Wireless Infrastructure Market (2026-2032)
- Philippines Airport Wireless Infrastructure Market (2026-2032)
- Japan Airport Wireless Infrastructure Market (2026-2032)
- Taiwan Airport Winter Services Market (2026-2032)
- Vietnam Airport Winter Services Market (2026-2032)
Industry Events and Analyst Meet

HIMTEX 2026

India Refining Summit 2026

India EV Show 2026

EV tech India Expo 2026

Auto Tech Asia 2026
Whitepaper
- Middle East & Africa Commercial Security Market Click here to view more.
- Middle East & Africa Fire Safety Systems & Equipment Market Click here to view more.
- GCC Drone Market Click here to view more.
- Middle East Lighting Fixture Market Click here to view more.
- GCC Physical & Perimeter Security Market Click here to view more.