Mauritius CAD/CAM Dental Devices Market (2026-2032) | Size & Revenue, Analysis, Industry, Growth, Outlook, Value, Share, Trends, Companies, Competitive Landscape, Forecast, Segmentation
Market Forecast By Product Type (Integrated Systems, Milling Equipment, Furnaces, Sintering Furnaces Scanner, Dental CAD/CAM Software, Accessories), By Material (Silica-Based Ceramics, Metal, Infiltration Ceramics, Oxide-High Performance Ceramics, Resin), By Restoration Type (Implant Abutment, Inlays & Onlays, Veneers, Crowns & Bridges, Fixed Partial Denture, Full Mouth Reconstruction, Complete Dentures), By Application (3D Printing, Dental Milling, Dental Scanning, Dental Software), By System (Chair Side Systems, Lab Systems), By Modality (Portable, Standalone), By End-User (Dental Clinics & Laboratories, Dental Hospitals, Research/Academic Institutes) And Competitive Landscape
| Product Code: ETC8252707 | Publication Date: Sep 2024 | Updated Date: Apr 2026 | Product Type: Market Research Report | |
| Publisher: 6Wresearch | Author: Summon Dutta | No. of Pages: 75 | No. of Figures: 35 | No. of Tables: 20 |
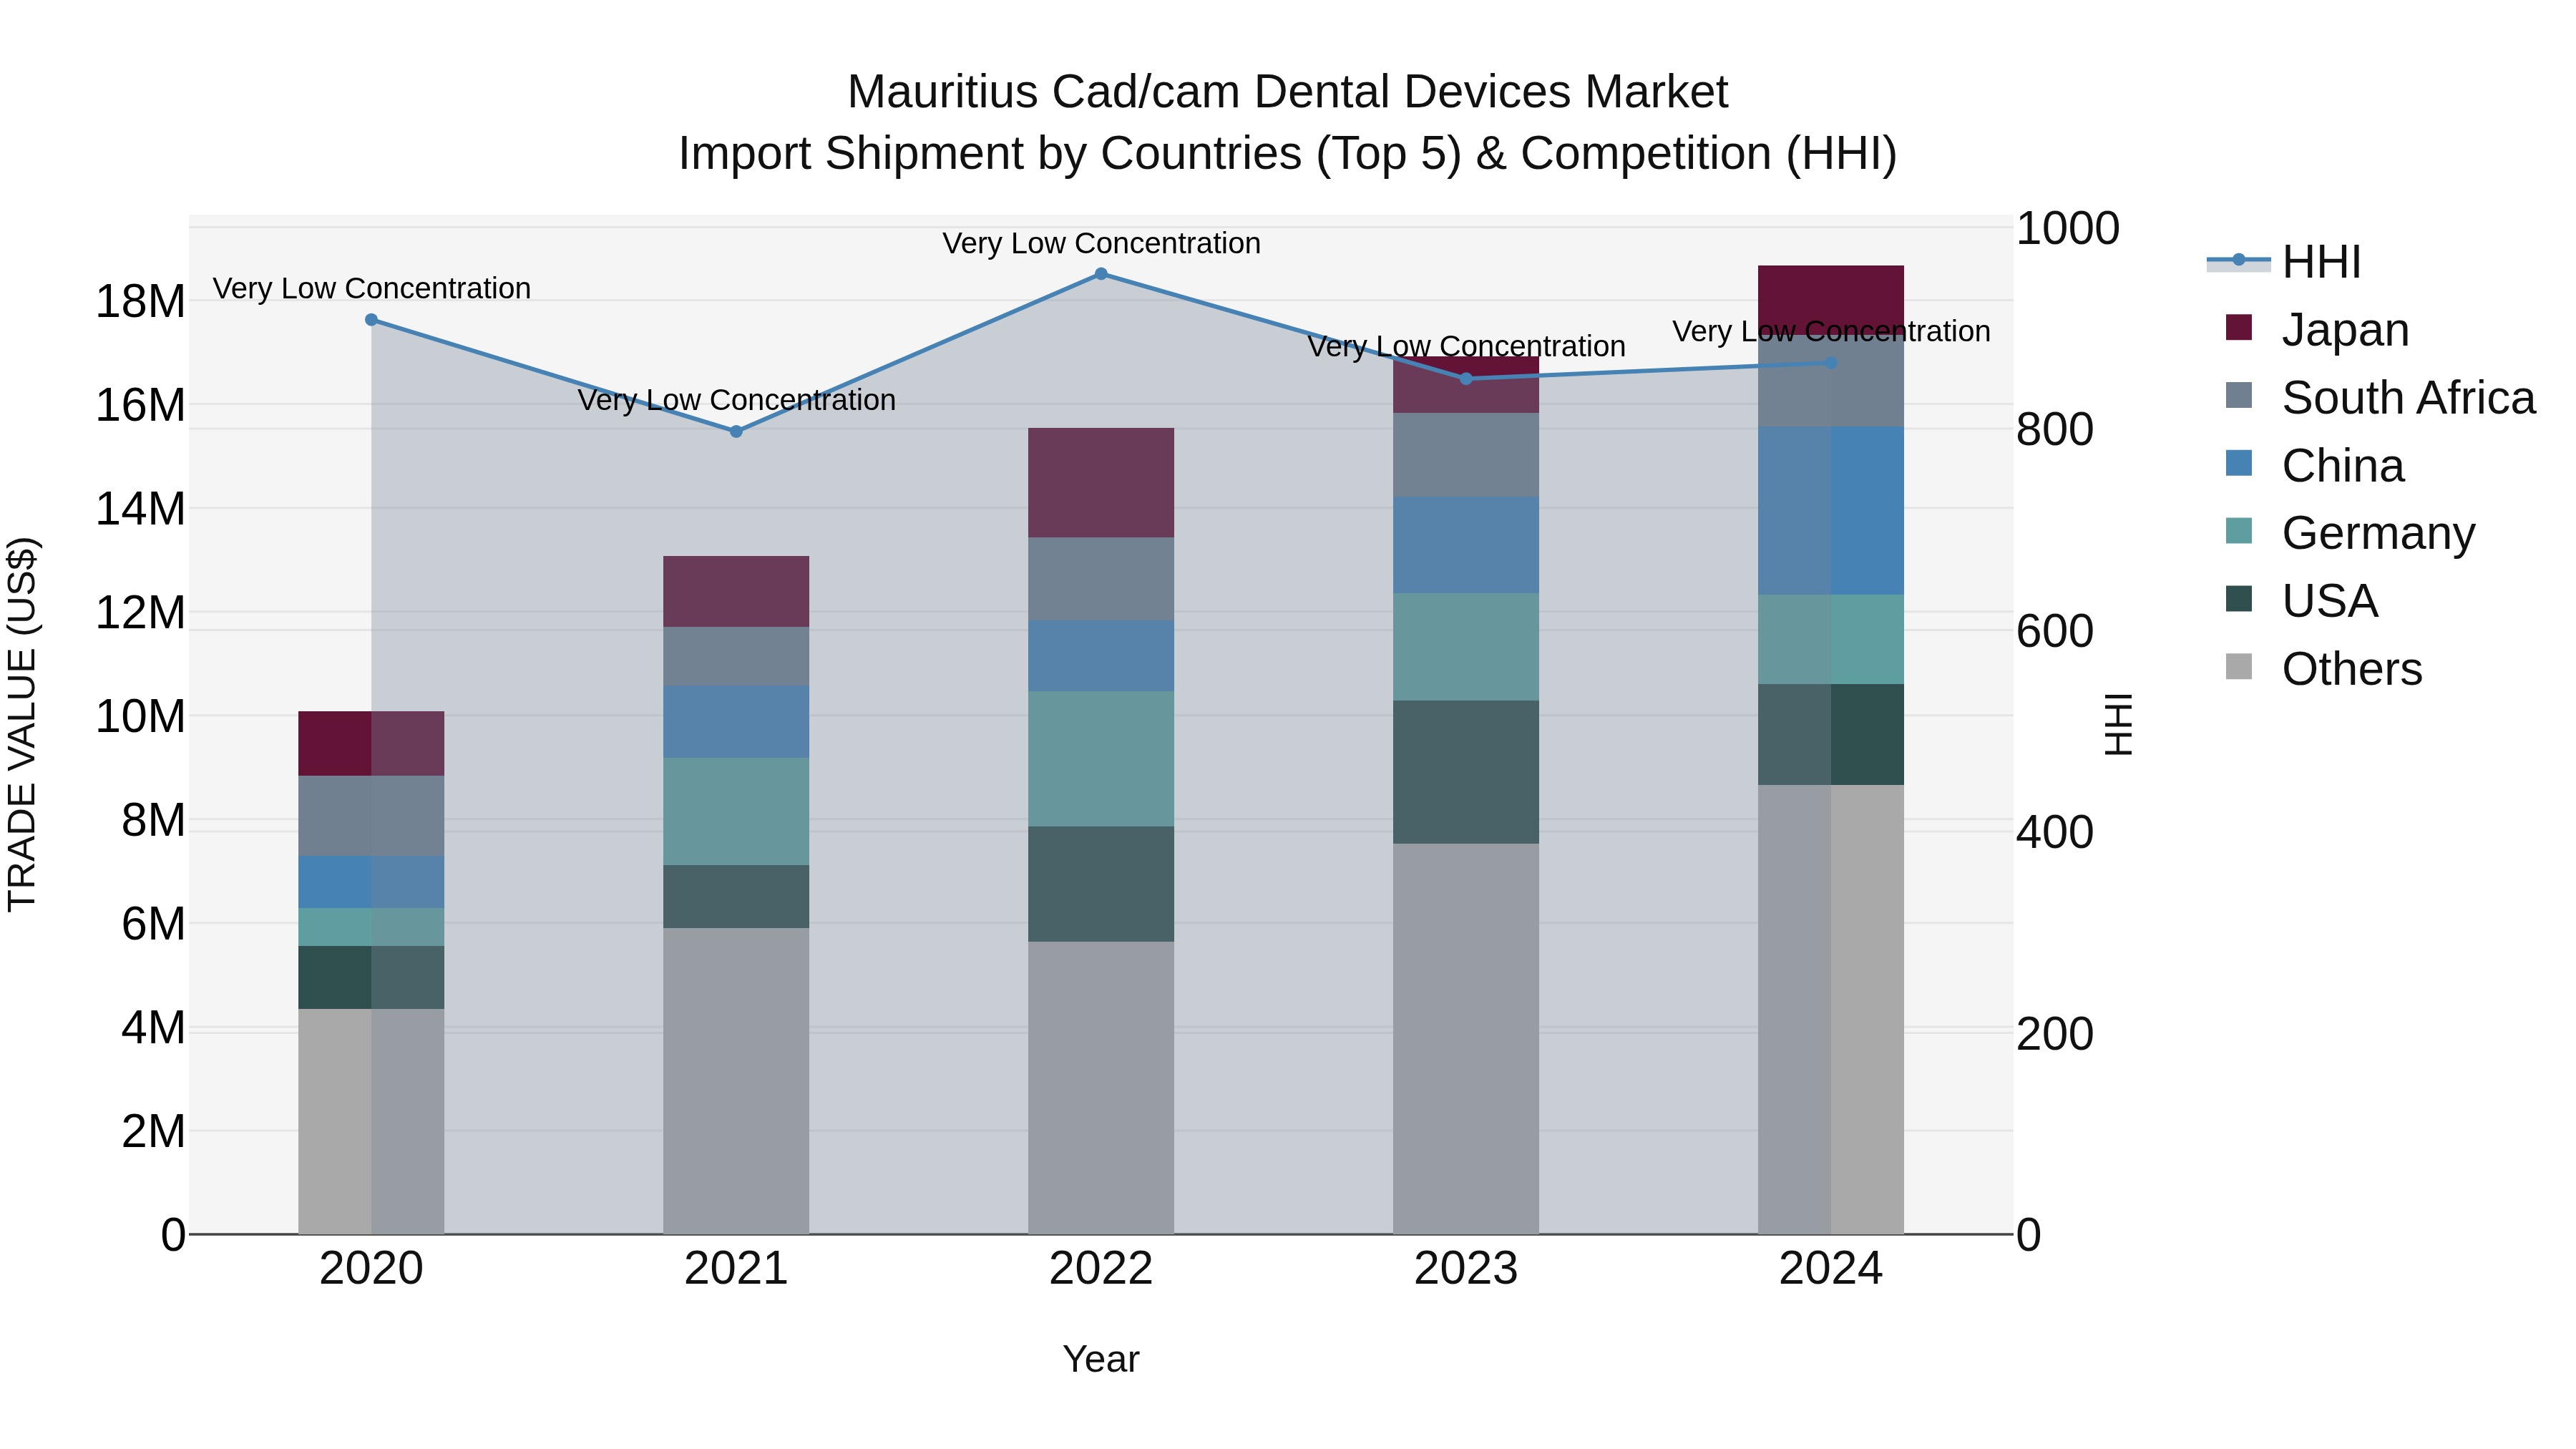
Mauritius Cad/Cam Dental Devices Market Top 5 Importing Countries and Market Competition (HHI) Analysis
The import shipments of CAD/CAM dental devices to Mauritius in 2024 continued to see a diverse range of top exporting countries, including China, USA, Metropolitan France, South Africa, and Germany. The market showed a low concentration with a low Herfindahl-Hirschman Index (HHI) in 2024, indicating a competitive landscape. The industry experienced a strong compound annual growth rate (CAGR) of 16.66% from 2020 to 2024, with a notable growth rate of 10.33% from 2023 to 2024, highlighting the increasing demand and adoption of CAD/CAM dental technology in Mauritius.
Key Highlights of the Report:
- Mauritius CAD/CAM Dental Devices Market Outlook
- Market Size of Mauritius CAD/CAM Dental Devices Market, 2025
- Forecast of Mauritius CAD/CAM Dental Devices Market, 2032
- Historical Data and Forecast of Mauritius CAD/CAM Dental Devices Revenues & Volume for the Period 2022 - 2032
- Mauritius CAD/CAM Dental Devices Market Trend Evolution
- Mauritius CAD/CAM Dental Devices Market Drivers and Challenges
- Mauritius CAD/CAM Dental Devices Price Trends
- Mauritius CAD/CAM Dental Devices Porter's Five Forces
- Mauritius CAD/CAM Dental Devices Industry Life Cycle
- Historical Data and Forecast of Mauritius CAD/CAM Dental Devices Market Revenues & Volume By Product Type for the Period 2022 - 2032
- Historical Data and Forecast of Mauritius CAD/CAM Dental Devices Market Revenues & Volume By Integrated Systems for the Period 2022 - 2032
- Historical Data and Forecast of Mauritius CAD/CAM Dental Devices Market Revenues & Volume By Milling Equipment for the Period 2022 - 2032
- Historical Data and Forecast of Mauritius CAD/CAM Dental Devices Market Revenues & Volume By Furnaces for the Period 2022 - 2032
- Historical Data and Forecast of Mauritius CAD/CAM Dental Devices Market Revenues & Volume By Sintering Furnaces Scanner for the Period 2022 - 2032
- Historical Data and Forecast of Mauritius CAD/CAM Dental Devices Market Revenues & Volume By Dental CAD/CAM Software for the Period 2022 - 2032
- Historical Data and Forecast of Mauritius CAD/CAM Dental Devices Market Revenues & Volume By Accessories for the Period 2022 - 2032
- Historical Data and Forecast of Mauritius CAD/CAM Dental Devices Market Revenues & Volume By Material for the Period 2022 - 2032
- Historical Data and Forecast of Mauritius CAD/CAM Dental Devices Market Revenues & Volume By Silica-Based Ceramics for the Period 2022 - 2032
- Historical Data and Forecast of Mauritius CAD/CAM Dental Devices Market Revenues & Volume By Metal for the Period 2022 - 2032
- Historical Data and Forecast of Mauritius CAD/CAM Dental Devices Market Revenues & Volume By Infiltration Ceramics for the Period 2022 - 2032
- Historical Data and Forecast of Mauritius CAD/CAM Dental Devices Market Revenues & Volume By Oxide-High Performance Ceramics for the Period 2022 - 2032
- Historical Data and Forecast of Mauritius CAD/CAM Dental Devices Market Revenues & Volume By Resin for the Period 2022 - 2032
- Historical Data and Forecast of Mauritius CAD/CAM Dental Devices Market Revenues & Volume By Restoration Type for the Period 2022 - 2032
- Historical Data and Forecast of Mauritius CAD/CAM Dental Devices Market Revenues & Volume By Implant Abutment for the Period 2022 - 2032
- Historical Data and Forecast of Mauritius CAD/CAM Dental Devices Market Revenues & Volume By Inlays & Onlays for the Period 2022 - 2032
- Historical Data and Forecast of Mauritius CAD/CAM Dental Devices Market Revenues & Volume By Veneers for the Period 2022 - 2032
- Historical Data and Forecast of Mauritius CAD/CAM Dental Devices Market Revenues & Volume By Crowns & Bridges for the Period 2022 - 2032
- Historical Data and Forecast of Mauritius CAD/CAM Dental Devices Market Revenues & Volume By Fixed Partial Denture for the Period 2022 - 2032
- Historical Data and Forecast of Mauritius CAD/CAM Dental Devices Market Revenues & Volume By Full Mouth Reconstruction for the Period 2022 - 2032
- Historical Data and Forecast of Mauritius CAD/CAM Dental Devices Market Revenues & Volume By Complete Dentures for the Period 2022 - 2032
- Historical Data and Forecast of Mauritius CAD/CAM Dental Devices Market Revenues & Volume By Application for the Period 2022 - 2032
- Historical Data and Forecast of Mauritius CAD/CAM Dental Devices Market Revenues & Volume By 3D Printing for the Period 2022 - 2032
- Historical Data and Forecast of Mauritius CAD/CAM Dental Devices Market Revenues & Volume By Dental Milling for the Period 2022 - 2032
- Historical Data and Forecast of Mauritius CAD/CAM Dental Devices Market Revenues & Volume By Dental Scanning for the Period 2022 - 2032
- Historical Data and Forecast of Mauritius CAD/CAM Dental Devices Market Revenues & Volume By Dental Software for the Period 2022 - 2032
- Historical Data and Forecast of Mauritius CAD/CAM Dental Devices Market Revenues & Volume By System for the Period 2022 - 2032
- Historical Data and Forecast of Mauritius CAD/CAM Dental Devices Market Revenues & Volume By Chair Side Systems for the Period 2022 - 2032
- Historical Data and Forecast of Mauritius CAD/CAM Dental Devices Market Revenues & Volume By Lab Systems for the Period 2022 - 2032
- Historical Data and Forecast of Mauritius CAD/CAM Dental Devices Market Revenues & Volume By Modality for the Period 2022 - 2032
- Historical Data and Forecast of Mauritius CAD/CAM Dental Devices Market Revenues & Volume By Portable for the Period 2022 - 2032
- Historical Data and Forecast of Mauritius CAD/CAM Dental Devices Market Revenues & Volume By Standalone for the Period 2022 - 2032
- Historical Data and Forecast of Mauritius CAD/CAM Dental Devices Market Revenues & Volume By End-User for the Period 2022 - 2032
- Historical Data and Forecast of Mauritius CAD/CAM Dental Devices Market Revenues & Volume By Dental Clinics & Laboratories for the Period 2022 - 2032
- Historical Data and Forecast of Mauritius CAD/CAM Dental Devices Market Revenues & Volume By Dental Hospitals for the Period 2022 - 2032
- Historical Data and Forecast of Mauritius CAD/CAM Dental Devices Market Revenues & Volume By Research/Academic Institutes for the Period 2022 - 2032
- Mauritius CAD/CAM Dental Devices Import Export Trade Statistics
- Market Opportunity Assessment By Product Type
- Market Opportunity Assessment By Material
- Market Opportunity Assessment By Restoration Type
- Market Opportunity Assessment By Application
- Market Opportunity Assessment By System
- Market Opportunity Assessment By Modality
- Market Opportunity Assessment By End-User
- Mauritius CAD/CAM Dental Devices Top Companies Market Share
- Mauritius CAD/CAM Dental Devices Competitive Benchmarking By Technical and Operational Parameters
- Mauritius CAD/CAM Dental Devices Company Profiles
- Mauritius CAD/CAM Dental Devices Key Strategic Recommendations
Frequently Asked Questions About the Market Study (FAQs):
6Wresearch actively monitors the Mauritius CAD/CAM Dental Devices Market and publishes its comprehensive annual report, highlighting emerging trends, growth drivers, revenue analysis, and forecast outlook. Our insights help businesses to make data-backed strategic decisions with ongoing market dynamics. Our analysts track relevent industries related to the Mauritius CAD/CAM Dental Devices Market, allowing our clients with actionable intelligence and reliable forecasts tailored to emerging regional needs.
Yes, we provide customisation as per your requirements. To learn more, feel free to contact us on sales@6wresearch.com
1 Executive Summary |
2 Introduction |
2.1 Key Highlights of the Report |
2.2 Report Description |
2.3 Market Scope & Segmentation |
2.4 Research Methodology |
2.5 Assumptions |
3 Mauritius CAD/CAM Dental Devices Market Overview |
3.1 Mauritius Country Macro Economic Indicators |
3.2 Mauritius CAD/CAM Dental Devices Market Revenues & Volume, 2022 & 2032F |
3.3 Mauritius CAD/CAM Dental Devices Market - Industry Life Cycle |
3.4 Mauritius CAD/CAM Dental Devices Market - Porter's Five Forces |
3.5 Mauritius CAD/CAM Dental Devices Market Revenues & Volume Share, By Product Type, 2022 & 2032F |
3.6 Mauritius CAD/CAM Dental Devices Market Revenues & Volume Share, By Material, 2022 & 2032F |
3.7 Mauritius CAD/CAM Dental Devices Market Revenues & Volume Share, By Restoration Type, 2022 & 2032F |
3.8 Mauritius CAD/CAM Dental Devices Market Revenues & Volume Share, By Application, 2022 & 2032F |
3.9 Mauritius CAD/CAM Dental Devices Market Revenues & Volume Share, By System, 2022 & 2032F |
3.10 Mauritius CAD/CAM Dental Devices Market Revenues & Volume Share, By Modality, 2022 & 2032F |
3.11 Mauritius CAD/CAM Dental Devices Market Revenues & Volume Share, By End-User, 2022 & 2032F |
4 Mauritius CAD/CAM Dental Devices Market Dynamics |
4.1 Impact Analysis |
4.2 Market Drivers |
4.2.1 Increasing demand for cosmetic dentistry procedures in Mauritius |
4.2.2 Technological advancements in CAD/CAM dental devices leading to improved efficiency and accuracy |
4.2.3 Growing awareness and adoption of digital dentistry practices in the region |
4.3 Market Restraints |
4.3.1 High initial investment cost associated with CAD/CAM dental devices |
4.3.2 Limited availability of skilled professionals proficient in operating CAD/CAM systems in Mauritius |
4.3.3 Concerns regarding data security and patient privacy with the use of digital dental technologies |
5 Mauritius CAD/CAM Dental Devices Market Trends |
6 Mauritius CAD/CAM Dental Devices Market, By Types |
6.1 Mauritius CAD/CAM Dental Devices Market, By Product Type |
6.1.1 Overview and Analysis |
6.1.2 Mauritius CAD/CAM Dental Devices Market Revenues & Volume, By Product Type, 2022 - 2032F |
6.1.3 Mauritius CAD/CAM Dental Devices Market Revenues & Volume, By Integrated Systems, 2022 - 2032F |
6.1.4 Mauritius CAD/CAM Dental Devices Market Revenues & Volume, By Milling Equipment, 2022 - 2032F |
6.1.5 Mauritius CAD/CAM Dental Devices Market Revenues & Volume, By Furnaces, 2022 - 2032F |
6.1.6 Mauritius CAD/CAM Dental Devices Market Revenues & Volume, By Sintering Furnaces Scanner, 2022 - 2032F |
6.1.7 Mauritius CAD/CAM Dental Devices Market Revenues & Volume, By Dental CAD/CAM Software, 2022 - 2032F |
6.1.8 Mauritius CAD/CAM Dental Devices Market Revenues & Volume, By Accessories, 2022 - 2032F |
6.2 Mauritius CAD/CAM Dental Devices Market, By Material |
6.2.1 Overview and Analysis |
6.2.2 Mauritius CAD/CAM Dental Devices Market Revenues & Volume, By Silica-Based Ceramics, 2022 - 2032F |
6.2.3 Mauritius CAD/CAM Dental Devices Market Revenues & Volume, By Metal, 2022 - 2032F |
6.2.4 Mauritius CAD/CAM Dental Devices Market Revenues & Volume, By Infiltration Ceramics, 2022 - 2032F |
6.2.5 Mauritius CAD/CAM Dental Devices Market Revenues & Volume, By Oxide-High Performance Ceramics, 2022 - 2032F |
6.2.6 Mauritius CAD/CAM Dental Devices Market Revenues & Volume, By Resin, 2022 - 2032F |
6.3 Mauritius CAD/CAM Dental Devices Market, By Restoration Type |
6.3.1 Overview and Analysis |
6.3.2 Mauritius CAD/CAM Dental Devices Market Revenues & Volume, By Implant Abutment, 2022 - 2032F |
6.3.3 Mauritius CAD/CAM Dental Devices Market Revenues & Volume, By Inlays & Onlays, 2022 - 2032F |
6.3.4 Mauritius CAD/CAM Dental Devices Market Revenues & Volume, By Veneers, 2022 - 2032F |
6.3.5 Mauritius CAD/CAM Dental Devices Market Revenues & Volume, By Crowns & Bridges, 2022 - 2032F |
6.3.6 Mauritius CAD/CAM Dental Devices Market Revenues & Volume, By Fixed Partial Denture, 2022 - 2032F |
6.3.7 Mauritius CAD/CAM Dental Devices Market Revenues & Volume, By Full Mouth Reconstruction, 2022 - 2032F |
6.4 Mauritius CAD/CAM Dental Devices Market, By Application |
6.4.1 Overview and Analysis |
6.4.2 Mauritius CAD/CAM Dental Devices Market Revenues & Volume, By 3D Printing, 2022 - 2032F |
6.4.3 Mauritius CAD/CAM Dental Devices Market Revenues & Volume, By Dental Milling, 2022 - 2032F |
6.4.4 Mauritius CAD/CAM Dental Devices Market Revenues & Volume, By Dental Scanning, 2022 - 2032F |
6.4.5 Mauritius CAD/CAM Dental Devices Market Revenues & Volume, By Dental Software, 2022 - 2032F |
6.5 Mauritius CAD/CAM Dental Devices Market, By System |
6.5.1 Overview and Analysis |
6.5.2 Mauritius CAD/CAM Dental Devices Market Revenues & Volume, By Chair Side Systems, 2022 - 2032F |
6.5.3 Mauritius CAD/CAM Dental Devices Market Revenues & Volume, By Lab Systems, 2022 - 2032F |
6.6 Mauritius CAD/CAM Dental Devices Market, By Modality |
6.6.1 Overview and Analysis |
6.6.2 Mauritius CAD/CAM Dental Devices Market Revenues & Volume, By Portable, 2022 - 2032F |
6.6.3 Mauritius CAD/CAM Dental Devices Market Revenues & Volume, By Standalone, 2022 - 2032F |
6.7 Mauritius CAD/CAM Dental Devices Market, By End-User |
6.7.1 Overview and Analysis |
6.7.2 Mauritius CAD/CAM Dental Devices Market Revenues & Volume, By Dental Clinics & Laboratories, 2022 - 2032F |
6.7.3 Mauritius CAD/CAM Dental Devices Market Revenues & Volume, By Dental Hospitals, 2022 - 2032F |
6.7.4 Mauritius CAD/CAM Dental Devices Market Revenues & Volume, By , 2022 - 2032F |
7 Mauritius CAD/CAM Dental Devices Market Import-Export Trade Statistics |
7.1 Mauritius CAD/CAM Dental Devices Market Export to Major Countries |
7.2 Mauritius CAD/CAM Dental Devices Market Imports from Major Countries |
8 Mauritius CAD/CAM Dental Devices Market Key Performance Indicators |
8.1 Adoption rate of CAD/CAM technology among dental practices in Mauritius |
8.2 Number of training programs and workshops conducted to enhance skills in operating CAD/CAM systems |
8.3 Rate of integration of CAD/CAM devices with other digital dental technologies in Mauritius |
9 Mauritius CAD/CAM Dental Devices Market - Opportunity Assessment |
9.1 Mauritius CAD/CAM Dental Devices Market Opportunity Assessment, By Product Type, 2022 & 2032F |
9.2 Mauritius CAD/CAM Dental Devices Market Opportunity Assessment, By Material, 2022 & 2032F |
9.3 Mauritius CAD/CAM Dental Devices Market Opportunity Assessment, By Restoration Type, 2022 & 2032F |
9.4 Mauritius CAD/CAM Dental Devices Market Opportunity Assessment, By Application, 2022 & 2032F |
9.5 Mauritius CAD/CAM Dental Devices Market Opportunity Assessment, By System, 2022 & 2032F |
9.6 Mauritius CAD/CAM Dental Devices Market Opportunity Assessment, By Modality, 2022 & 2032F |
9.7 Mauritius CAD/CAM Dental Devices Market Opportunity Assessment, By End-User, 2022 & 2032F |
10 Mauritius CAD/CAM Dental Devices Market - Competitive Landscape |
10.1 Mauritius CAD/CAM Dental Devices Market Revenue Share, By Companies, 2025 |
10.2 Mauritius CAD/CAM Dental Devices Market Competitive Benchmarking, By Operating and Technical Parameters |
11 Company Profiles |
12 Recommendations |
13 Disclaimer |
Export potential assessment - trade Analytics for 2030
Export potential enables firms to identify high-growth global markets with greater confidence by combining advanced trade intelligence with a structured quantitative methodology. The framework analyzes emerging demand trends and country-level import patterns while integrating macroeconomic and trade datasets such as GDP and population forecasts, bilateral import–export flows, tariff structures, elasticity differentials between developed and developing economies, geographic distance, and import demand projections. Using weighted trade values from 2020–2024 as the base period to project country-to-country export potential for 2030, these inputs are operationalized through calculated drivers such as gravity model parameters, tariff impact factors, and projected GDP per-capita growth. Through an analysis of hidden potentials, demand hotspots, and market conditions that are most favorable to success, this method enables firms to focus on target countries, maximize returns, and global expansion with data, backed by accuracy.
By factoring in the projected importer demand gap that is currently unmet and could be potential opportunity, it identifies the potential for the Exporter (Country) among 190 countries, against the general trade analysis, which identifies the biggest importer or exporter.
To discover high-growth global markets and optimize your business strategy:
Click Here
Pricing
- Single User License$ 1,995
- Department License$ 2,400
- Site License$ 3,120
- Global License$ 3,795

Search
Thought Leadership and Analyst Meet


Our Clients
Latest Reports
- Canada Cloud CFD Market (2026-2032) | Size & Revenue, Industry, Growth, Competitive Landscape, Forecast, Segmentation, Value, Outlook, Trends, Share, Analysis, Companies
- Taiwan Food Delivery Platform Market (2026-2032) | Companies, Outlook, Analysis, Trends, Value, Revenue, Segmentation, Share, Forecast, Competitive Landscape, Growth, Size & Forecast
- United Kingdom (UK) Long-term Care Insurance Market (2026-2032) | Growth, Share, Consumer Insights, Drivers, Opportunities, Competition, Pricing Analysis, Segments, Restraints, Companies, Competitive, Value, Outlook, Size, Demand, Analysis, Challenges, Strategic Insights, Investment Trends, Revenue, Trends, Supply, Forecast
- United Kingdom (UK) Long Term Care Market (2026-2032) | Companies, Outlook, Analysis, Trends, Value, Revenue, Segmentation, Share, Forecast, Competitive Landscape, Growth, Size & Forecast
- Iraq Insulation and Waterproofing Market (2026-2032) | Outlook, Drivers, Growth, Size, Share, Industry, Revenue, Trends, Demand, Competitive, Strategic Insights, Opportunities, Segments, Companies, Challenges, Strategy, Consumer Insights, Analysis, Investment Trends, Value, Segmentation, Forecast, Restraints
- India Switchgear Market Outlook (2026-2032) | Size, Share, Trends, Growth, Revenue, Forecast, Analysis, Value, Outlook
- Pakistan Contraceptive Implants Market (2025-2031) | Demand, Growth, Size, Share, Industry, Pricing Analysis, Competitive, Strategic Insights, Strategy, Consumer Insights, Analysis, Investment Trends, Opportunities, Revenue, Segments, Value, Segmentation, Supply, Forecast, Restraints, Outlook, Competition, Drivers, Trends, Companies, Challenges
- Sri Lanka Packaging Market (2026-2032) | Outlook, Competition, Drivers, Trends, Demand, Pricing Analysis, Competitive, Strategic Insights, Companies, Challenges, Strategy, Consumer Insights, Analysis, Investment Trends, Opportunities, Growth, Size, Share, Industry, Revenue, Segments, Value, Segmentation, Supply, Forecast, Restraints
- India Kids Watches Market (2026-2032) | Strategy, Consumer Insights, Analysis, Investment Trends, Opportunities, Growth, Size, Share, Industry, Revenue, Segments, Value, Segmentation, Supply, Forecast, Restraints, Outlook, Competition, Drivers, Trends, Demand, Pricing Analysis, Competitive, Strategic Insights, Companies, Challenges
- Saudi Arabia Core Assurance Service Market (2025-2031) | Strategy, Consumer Insights, Analysis, Investment Trends, Opportunities, Growth, Size, Share, Industry, Revenue, Segments, Value, Segmentation, Supply, Forecast, Restraints, Outlook, Competition, Drivers, Trends, Demand, Pricing Analysis, Competitive, Strategic Insights, Companies, Challenges
Industry Events and Analyst Meet

India EV Show 2026

EV tech India Expo 2026

Auto Tech Asia 2026

Battery Tech India 2026

Smart Production Solutions Guangzhou 2026
Whitepaper
- Middle East & Africa Commercial Security Market Click here to view more.
- Middle East & Africa Fire Safety Systems & Equipment Market Click here to view more.
- GCC Drone Market Click here to view more.
- Middle East Lighting Fixture Market Click here to view more.
- GCC Physical & Perimeter Security Market Click here to view more.
6WResearch In News
- Doha a strategic location for EV manufacturing hub: IPA Qatar
- Demand for luxury TVs surging in the GCC, says Samsung
- Empowering Growth: The Thriving Journey of Bangladesh’s Cable Industry
- Demand for luxury TVs surging in the GCC, says Samsung
- Video call with a traditional healer? Once unthinkable, it’s now common in South Africa
- Intelligent Buildings To Smooth GCC’s Path To Net Zero