Mexico Mobile Asset Management (MAM) Market (2026-2032) Outlook | Forecast, Revenue, Size, Share, Value, Analysis, Growth, Trends, Companies & Industry
Market Forecast By Components (Solutions, Services), By Asset Types (Fixed Assets, Mobile Assets), By Organization Size (SMEs, Large Enterprises), By Vertical (Building Automation, Manufacturing, Healthcare, Retail, Energy & Utilities, Transportation & Logistics, Metal & Mining, Others), By Deployment Modes (On-premises, Cloud) And Competitive Landscape
| Product Code: ETC067822 | Publication Date: Jun 2021 | Updated Date: Jun 2026 | Product Type: Report | |
| Publisher: 6Wresearch | Author: Ravi Bhandari | No. of Pages: 70 | No. of Figures: 35 | No. of Tables: 5 |
Mexico Mobile Asset Management (MAM) Market Size, Share & Growth Rate
The Mexico Mobile Asset Management (MAM) Market was estimated at USD 242 Million in 2025 and is projected to reach USD 280 Million by 2032, growing at a CAGR of 2.1% from 2026 to 2032. This growth trajectory is fueled by the increasing adoption of mobile technologies, allowing companies to track and manage assets more efficiently. The demand for real-time asset visibility and optimized fleet operations is propelling organizations to invest in mobile asset management solutions, further driving market expansion.
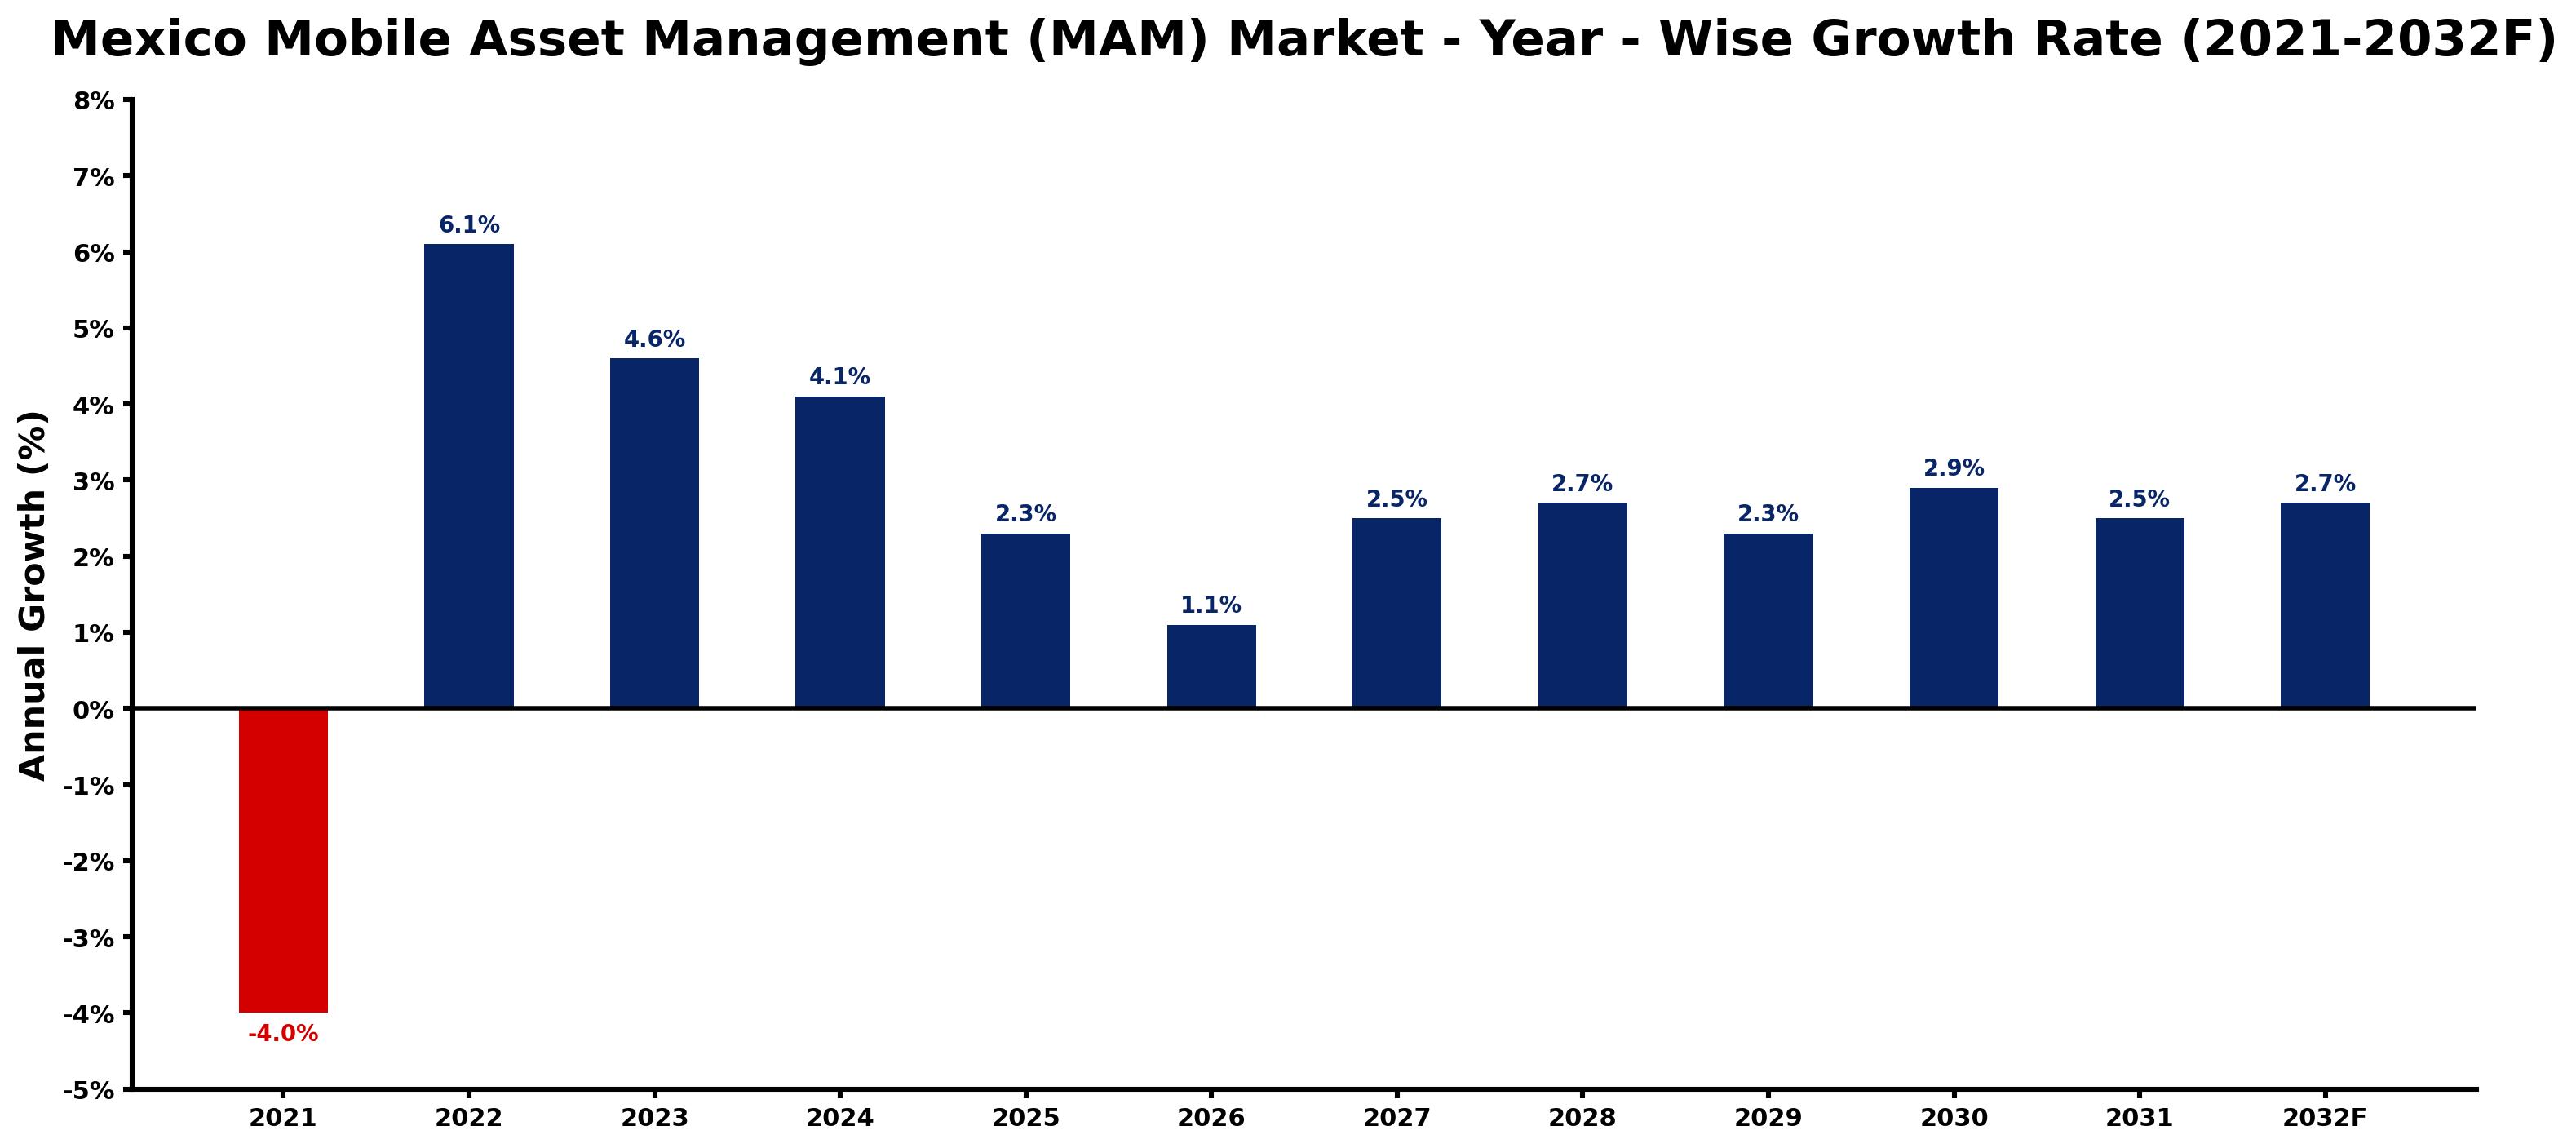
Mexico Mobile Asset Management (MAM) Market Growth Rate Analysis (2021-2032)
The Mobile Asset Management (MAM) market in Mexico is seeing a promising recovery and growth trajectory following a downturn in 2021, which recorded a contraction of 4.0%. The subsequent rebound began in 2022, with a 6.1% growth fueled by increasing consumer demand for streamlined asset tracking and management solutions. As businesses increasingly invest in digitalization and infrastructure, the market is projected to sustain growth rates around 4.6% in 2023 and 4.1% in 2024, driven by advancements in technology and a shift toward comprehensive asset visibility. By 2030, growth is expected to stabilize at approximately 2.9%, reflecting a mature market influenced by ongoing energy transition strategies and evolving industrial needs.
Mexico Mobile Asset Management (MAM) Market Year-wise Growth Rate and Key Drivers
This graph highlights how the Mexico Mobile Asset Management (MAM) Market has steadily grown over the past five years, supported by major growth factors.
The table below presents the year‑wise growth rates along with the key drivers influencing the market
| Year | Growth Rate | Major Drivers |
| 2021 | -4.0% | Increasing smart city development projects |
| 2022 | 6.1% | Expansion of transportation and logistics networks |
| 2023 | 4.6% | Rising electricity demand across industries |
| 2024 | 4.1% | Increasing adoption of advanced technologies |
| 2025 | 2.3% | Increasing adoption of advanced technologies |
| 2026 | 1.1% | Increasing industrial automation investments |
| 2027 | 2.5% | Growing urbanization and commercial development |
| 2028 | 2.7% | Increasing adoption of advanced technologies |
| 2029 | 2.3% | Increasing adoption of advanced technologies |
| 2030 | 2.9% | Expansion of manufacturing activities |
| 2031 | 2.5% | Increasing industrial infrastructure investments |
| 2032 | 2.7% | Rapid growth in telecom and data center sectors |
Note - Market size estimations and growth projections presented in this report are based on 6Wresearch’s advanced forecasting approach, validated with industry datasets as of June 2026.
Mexico Mobile Asset Management (MAM) Market Synopsis
In Mexico, mobile asset management solutions are becoming integral to various sectors, especially in logistics and transportation. As businesses seek to enhance asset visibility and operational efficiency, the push towards mobile technologies has become increasingly pronounced.
Additionally, the proliferation of mobile devices within business ecosystems is creating a fertile ground for MAM solutions. This trend not only boosts productivity but also facilitates real-time decision-making, essential for navigating today’s dynamic market landscape.
Mexico Mobile Asset Management (MAM) Market Key Takeaways
- Integration of mobile technologies is a key driver for market growth.
- Real-time tracking is essential for enhancing operational efficiency.
- Challenges related to technology integration and data security remain significant.
- Government initiatives are fostering the adoption of MAM solutions across various sectors.
- Companies increasingly recognize the necessity of MAM solutions to remain competitive.
Evaluation of Restraints in Mexico Mobile Asset Management (MAM) Market
The Mexico Mobile Asset Management market faces notable restraints, particularly in the realms of technology integration and data security. Many businesses operate within complex technology ecosystems that can make the implementation of new MAM solutions challenging. Additionally, organizations are increasingly concerned about protecting sensitive asset data from potential breaches. Addressing these issues requires collaborative efforts between technology vendors and businesses to ensure smooth integration and robust security measures, which are vital for gaining market confidence and achieving widespread adoption.
Mexico Mobile Asset Management (MAM) Market Trends
The mobile asset management landscape in Mexico is witnessing several trends that are reshaping its growth. One prominent trend is the rise of data analytics capabilities integrated within MAM solutions. Companies are leveraging advanced analytics to gain deeper insights into asset utilization, enabling smarter decision-making.
Moreover, as sustainability becomes a focal point for many organizations, MAM solutions are evolving to support green initiatives by optimizing asset usage, thus minimizing environmental impact. This convergence of technology and sustainability is expected to propel market growth in the coming years.
Mexico Mobile Asset Management (MAM) Market Opportunities
There are substantial opportunities for growth within the Mexico Mobile Asset Management market. As the demand for more efficient asset management processes continues to rise, companies are encouraged to invest in advanced mobile solutions that integrate seamlessly with existing systems. Additionally, the growth of e-commerce and logistics sectors offers fertile ground for mobile asset management innovations, providing opportunities for businesses to enhance their operational efficiency and customer satisfaction.
Government Initiatives in the Mexico Mobile Asset Management (MAM) Market
The Mexican government has recognized the strategic importance of mobile asset management technologies across various industries. Policies have been introduced to promote the integration of MAM systems, particularly in sectors such as transportation, logistics, and manufacturing. By facilitating public procurement programs and fostering industry partnerships, the government aims to enhance operational efficiency and reduce costs associated with asset maintenance.
Future Insights of the Mexico Mobile Asset Management (MAM) Market
Looking ahead to 2026-2032, the Mexico Mobile Asset Management market is positioned for significant growth. With ongoing advancements in mobile technologies and a greater emphasis on data security, the landscape will evolve to meet the changing needs of businesses. Organizations will increasingly prioritize MAM solutions to drive efficiency, and as mobile devices become more ubiquitous, the potential for real-time tracking and monitoring will expand further.
Mexico Mobile Asset Management (MAM) Market Latest Developments (May 2025 - June 2026)
In recent months, the Mexico Mobile Asset Management market has seen a surge in interest and investment. New partnerships between technology vendors and businesses are emerging, focusing on enhancing interoperability and security features of MAM solutions. Additionally, there has been increased public-sector engagement in the promotion of mobile asset management practices, with initiatives aimed at supporting their deployment in critical industries.
Mexico Mobile Asset Management (MAM) Market - Key Attractiveness of the Report
- 10 Years of Market Numbers
- Historical Data Starting from 2022 to 2025
- Base Year: 2025
- Forecast Data until 2032
- Key Performance Indicators Impacting the Market
- Major Upcoming Developments and Projects
Key Highlights of the Report:
- Mexico Mobile Asset Management (MAM) Market Outlook
- Market Size of Mexico Mobile Asset Management (MAM) Market, 2025
- Forecast of Mexico Mobile Asset Management (MAM) Market, 2032
- Historical Data and Forecast of Mexico Mobile Asset Management (MAM) Revenues & Volume for the Period 2022-2032F
- Mexico Mobile Asset Management (MAM) Market Trend Evolution
- Mexico Mobile Asset Management (MAM) Market Drivers and Challenges
- Mexico Mobile Asset Management (MAM) Price Trends
- Mexico Mobile Asset Management (MAM) Porter's Five Forces
- Mexico Mobile Asset Management (MAM) Industry Life Cycle
- Historical Data and Forecast of Mexico Mobile Asset Management (MAM) Market Revenues & Volume By Components for the Period 2022-2032F
- Historical Data and Forecast of Mexico Mobile Asset Management (MAM) Market Revenues & Volume By Solutions for the Period 2022-2032F
- Historical Data and Forecast of Mexico Mobile Asset Management (MAM) Market Revenues & Volume By Services for the Period 2022-2032F
- Historical Data and Forecast of Mexico Mobile Asset Management (MAM) Market Revenues & Volume By Asset Types for the Period 2022-2032F
- Historical Data and Forecast of Mexico Mobile Asset Management (MAM) Market Revenues & Volume By Fixed Assets for the Period 2022-2032F
- Historical Data and Forecast of Mexico Mobile Asset Management (MAM) Market Revenues & Volume By Mobile Assets for the Period 2022-2032F
- Historical Data and Forecast of Mexico Mobile Asset Management (MAM) Market Revenues & Volume By Organization Size for the Period 2022-2032F
- Historical Data and Forecast of Mexico Mobile Asset Management (MAM) Market Revenues & Volume By SMEs for the Period 2022-2032F
- Historical Data and Forecast of Mexico Mobile Asset Management (MAM) Market Revenues & Volume By Large Enterprises for the Period 2022-2032F
- Historical Data and Forecast of Mexico Mobile Asset Management (MAM) Market Revenues & Volume By Vertical for the Period 2022-2032F
- Historical Data and Forecast of Mexico Mobile Asset Management (MAM) Market Revenues & Volume By Building Automation for the Period 2022-2032F
- Historical Data and Forecast of Mexico Mobile Asset Management (MAM) Market Revenues & Volume By Manufacturing for the Period 2022-2032F
- Historical Data and Forecast of Mexico Mobile Asset Management (MAM) Market Revenues & Volume By Healthcare for the Period 2022-2032F
- Historical Data and Forecast of Mexico Mobile Asset Management (MAM) Market Revenues & Volume By Retail for the Period 2022-2032F
- Historical Data and Forecast of Mexico Mobile Asset Management (MAM) Market Revenues & Volume By Energy & Utilities for the Period 2022-2032F
- Historical Data and Forecast of Mexico Mobile Asset Management (MAM) Market Revenues & Volume By Transportation & Logistics for the Period 2022-2032F
- Historical Data and Forecast of Mexico Mobile Asset Management (MAM) Market Revenues & Volume By Metal & Mining for the Period 2022-2032F
- Historical Data and Forecast of Mexico Mobile Asset Management (MAM) Market Revenues & Volume By Others for the Period 2022-2032F
- Historical Data and Forecast of Mexico Mobile Asset Management (MAM) Market Revenues & Volume By Deployment Modes for the Period 2022-2032F
- Historical Data and Forecast of Mexico Mobile Asset Management (MAM) Market Revenues & Volume By On-premises for the Period 2022-2032F
- Historical Data and Forecast of Mexico Mobile Asset Management (MAM) Market Revenues & Volume By Cloud for the Period 2022-2032F
- Mexico Mobile Asset Management (MAM) Import Export Trade Statistics
- Market Opportunity Assessment By Components
- Market Opportunity Assessment By Asset Types
- Market Opportunity Assessment By Organization Size
- Market Opportunity Assessment By Vertical
- Market Opportunity Assessment By Deployment Modes
- Mexico Mobile Asset Management (MAM) Top Companies Market Share
- Mexico Mobile Asset Management (MAM) Competitive Benchmarking By Technical and Operational Parameters
- Mexico Mobile Asset Management (MAM) Company Profiles
- Mexico Mobile Asset Management (MAM) Key Strategic Recommendations
Mexico Mobile Asset Management (MAM) Market - Frequently Asked Questions
The growth is primarily driven by the adoption of mobile technologies that facilitate efficient tracking and monitoring of assets. Organizations are increasingly prioritizing real-time visibility, which enhances operational productivity.
The Mexico Mobile Asset Management (MAM) Market was estimated at USD 242 Million in 2025 and is projected to reach USD 280 Million by 2032, growing at a CAGR of 2.1% from 2026 to 2032.
Government initiatives are critical as they promote the integration of MAM solutions across various sectors. By facilitating public procurement and establishing regulatory frameworks, the government enhances operational efficiency and supports technology adoption.
Companies often encounter difficulties in seamlessly integrating MAM solutions with existing systems, particularly in diverse technology landscapes. Data security concerns also present significant challenges.
Yes, the market is seeing a rise in data analytics capabilities and an increasing focus on sustainability. Businesses are leveraging these trends to optimize asset utilization and reduce environmental impacts.
6Wresearch actively monitors the Mexico Mobile Asset Management (MAM) Market and publishes its comprehensive annual report, highlighting emerging trends, growth drivers, revenue analysis, and forecast outlook. Our insights help businesses to make data-backed strategic decisions with ongoing market dynamics. Our analysts track relevent industries related to the Mexico Mobile Asset Management (MAM) Market, allowing our clients with actionable intelligence and reliable forecasts tailored to emerging regional needs.
Yes, we provide customisation as per your requirements. To learn more, feel free to contact us on sales@6wresearch.com
1 Executive Summary |
2 Introduction |
2.1 Key Highlights of the Report |
2.2 Report Description |
2.3 Market Scope & Segmentation |
2.4 Research Methodology |
2.5 Assumptions |
3 Mexico Mobile Asset Management (MAM) Market Overview |
3.1 Mexico Country Macro Economic Indicators |
3.2 Mexico Mobile Asset Management (MAM) Market Revenues & Volume, 2022 & 2032F |
3.3 Mexico Mobile Asset Management (MAM) Market - Industry Life Cycle |
3.4 Mexico Mobile Asset Management (MAM) Market - Porter's Five Forces |
3.5 Mexico Mobile Asset Management (MAM) Market Revenues & Volume Share, By Components, 2022 & 2032F |
3.6 Mexico Mobile Asset Management (MAM) Market Revenues & Volume Share, By Asset Types, 2022 & 2032F |
3.7 Mexico Mobile Asset Management (MAM) Market Revenues & Volume Share, By Organization Size, 2022 & 2032F |
3.8 Mexico Mobile Asset Management (MAM) Market Revenues & Volume Share, By Vertical, 2022 & 2032F |
3.9 Mexico Mobile Asset Management (MAM) Market Revenues & Volume Share, By Deployment Modes, 2022 & 2032F |
4 Mexico Mobile Asset Management (MAM) Market Dynamics |
4.1 Impact Analysis |
4.2 Market Drivers |
4.2.1 Increasing demand for efficient asset tracking and management solutions |
4.2.2 Growing adoption of IoT technology in various industries |
4.2.3 Government initiatives promoting the use of mobile asset management solutions |
4.3 Market Restraints |
4.3.1 High initial investment costs associated with implementing mobile asset management solutions |
4.3.2 Concerns regarding data security and privacy |
4.3.3 Lack of skilled professionals to effectively utilize mobile asset management systems |
5 Mexico Mobile Asset Management (MAM) Market Trends |
6 Mexico Mobile Asset Management (MAM) Market, By Types |
6.1 Mexico Mobile Asset Management (MAM) Market, By Components |
6.1.1 Overview and Analysis |
6.1.2 Mexico Mobile Asset Management (MAM) Market Revenues & Volume, By Components, 2022-2032F |
6.1.3 Mexico Mobile Asset Management (MAM) Market Revenues & Volume, By Solutions, 2022-2032F |
6.1.4 Mexico Mobile Asset Management (MAM) Market Revenues & Volume, By Services, 2022-2032F |
6.2 Mexico Mobile Asset Management (MAM) Market, By Asset Types |
6.2.1 Overview and Analysis |
6.2.2 Mexico Mobile Asset Management (MAM) Market Revenues & Volume, By Fixed Assets, 2022-2032F |
6.2.3 Mexico Mobile Asset Management (MAM) Market Revenues & Volume, By Mobile Assets, 2022-2032F |
6.3 Mexico Mobile Asset Management (MAM) Market, By Organization Size |
6.3.1 Overview and Analysis |
6.3.2 Mexico Mobile Asset Management (MAM) Market Revenues & Volume, By SMEs, 2022-2032F |
6.3.3 Mexico Mobile Asset Management (MAM) Market Revenues & Volume, By Large Enterprises, 2022-2032F |
6.4 Mexico Mobile Asset Management (MAM) Market, By Vertical |
6.4.1 Overview and Analysis |
6.4.2 Mexico Mobile Asset Management (MAM) Market Revenues & Volume, By Building Automation, 2022-2032F |
6.4.3 Mexico Mobile Asset Management (MAM) Market Revenues & Volume, By Manufacturing, 2022-2032F |
6.4.4 Mexico Mobile Asset Management (MAM) Market Revenues & Volume, By Healthcare, 2022-2032F |
6.4.5 Mexico Mobile Asset Management (MAM) Market Revenues & Volume, By Retail, 2022-2032F |
6.4.6 Mexico Mobile Asset Management (MAM) Market Revenues & Volume, By Energy & Utilities, 2022-2032F |
6.4.7 Mexico Mobile Asset Management (MAM) Market Revenues & Volume, By Transportation & Logistics, 2022-2032F |
6.4.8 Mexico Mobile Asset Management (MAM) Market Revenues & Volume, By Others, 2022-2032F |
6.4.9 Mexico Mobile Asset Management (MAM) Market Revenues & Volume, By Others, 2022-2032F |
6.5 Mexico Mobile Asset Management (MAM) Market, By Deployment Modes |
6.5.1 Overview and Analysis |
6.5.2 Mexico Mobile Asset Management (MAM) Market Revenues & Volume, By On-premises, 2022-2032F |
6.5.3 Mexico Mobile Asset Management (MAM) Market Revenues & Volume, By Cloud, 2022-2032F |
7 Mexico Mobile Asset Management (MAM) Market Import-Export Trade Statistics |
7.1 Mexico Mobile Asset Management (MAM) Market Export to Major Countries |
7.2 Mexico Mobile Asset Management (MAM) Market Imports from Major Countries |
8 Mexico Mobile Asset Management (MAM) Market Key Performance Indicators |
8.1 Percentage increase in the number of connected assets being managed |
8.2 Average time saved in asset tracking and management processes |
8.3 Reduction in maintenance costs due to mobile asset management implementation |
9 Mexico Mobile Asset Management (MAM) Market - Opportunity Assessment |
9.1 Mexico Mobile Asset Management (MAM) Market Opportunity Assessment, By Components, 2022 & 2032F |
9.2 Mexico Mobile Asset Management (MAM) Market Opportunity Assessment, By Asset Types, 2022 & 2032F |
9.3 Mexico Mobile Asset Management (MAM) Market Opportunity Assessment, By Organization Size, 2022 & 2032F |
9.4 Mexico Mobile Asset Management (MAM) Market Opportunity Assessment, By Vertical, 2022 & 2032F |
9.5 Mexico Mobile Asset Management (MAM) Market Opportunity Assessment, By Deployment Modes, 2022 & 2032F |
10 Mexico Mobile Asset Management (MAM) Market - Competitive Landscape |
10.1 Mexico Mobile Asset Management (MAM) Market Revenue Share, By Companies, 2025 |
10.2 Mexico Mobile Asset Management (MAM) Market Competitive Benchmarking, By Operating and Technical Parameters |
11 Company Profiles |
12 Recommendations |
13 Disclaimer |
Global Go To Market Strategy - 2030
Export potential enables firms to identify high-growth global markets with greater confidence by combining advanced trade intelligence with a structured quantitative methodology. The framework analyzes emerging demand trends and country-level import patterns while integrating macroeconomic and trade datasets such as GDP and population forecasts, bilateral import–export flows, tariff structures, elasticity differentials between developed and developing economies, geographic distance, and import demand projections. Using weighted trade values from 2020–2024 as the base period to project country-to-country export potential for 2030, these inputs are operationalized through calculated drivers such as gravity model parameters, tariff impact factors, and projected GDP per-capita growth. Through an analysis of hidden potentials, demand hotspots, and market conditions that are most favorable to success, this method enables firms to focus on target countries, maximize returns, and global expansion with data, backed by accuracy.
By factoring in the projected importer demand gap that is currently unmet and could be potential opportunity, it identifies the potential for the Exporter (Country) among 190 countries, against the general trade analysis, which identifies the biggest importer or exporter.
To discover high-growth global markets and optimize your business strategy:
Click Here
Pricing
- Single User License$ 1,995
- Department License$ 2,400
- Site License$ 3,120
- Global License$ 3,795

Leadership Perspectives from Industry Events
Search
Thought Leadership and Analyst Meet


Our Clients
6WResearch In News
- India Air Conditioner Market Set for Strong Rebound in 2026 After Weather-Led Correction and GST-Driven Recovery: 6Wresearch
- ADAS in India: How Automatic Emergency Braking, Blind Spot Detection & Driver Monitoring are Transforming Road Safety
- Doha a strategic location for EV manufacturing hub: IPA Qatar
- Demand for luxury TVs surging in the GCC, says Samsung
- Empowering Growth: The Thriving Journey of Bangladesh’s Cable Industry
- Demand for luxury TVs surging in the GCC, says Samsung
Latest Reports
- Nicaragua RPG Gaming Market (2026-2032)
- New Zealand RPG Gaming Market (2026-2032)
- Netherlands RPG Gaming Market (2026-2032)
- Nauru RPG Gaming Market (2026-2032)
- Namibia RPG Gaming Market (2026-2032)
- Mozambique RPG Gaming Market (2026-2032)
- Montenegro RPG Gaming Market (2026-2032)
- Mongolia RPG Gaming Market (2026-2032)
- Monaco RPG Gaming Market (2026-2032)
- Micronesia RPG Gaming Market (2026-2032)
Industry Events and Analyst Meet

HIMTEX 2026

India Refining Summit 2026

India EV Show 2026

EV tech India Expo 2026

Auto Tech Asia 2026
Whitepaper
- Middle East & Africa Commercial Security Market Click here to view more.
- Middle East & Africa Fire Safety Systems & Equipment Market Click here to view more.
- GCC Drone Market Click here to view more.
- Middle East Lighting Fixture Market Click here to view more.
- GCC Physical & Perimeter Security Market Click here to view more.