Mexico Pulleys Market (2026-2032) | Value, Outlook, Companies, Forecast, Share, Industry, Trends, Size, Growth, Revenue & Analysis
Market Forecast By Type (Steel, Cast Iron, Glass Filled Polymer), By Applications (OEM, Aftermarket) And Competitive Landscape
| Product Code: ETC045223 | Publication Date: Jan 2021 | Updated Date: Jun 2026 | Product Type: Report | |
| Publisher: 6Wresearch | Author: Ravi Bhandari | No. of Pages: 70 | No. of Figures: 35 | No. of Tables: 5 |
Mexico Pulleys Market Summary
The mexico pulleys market was estimated at USD 174 Million in 2025 and is projected to reach USD 202 Million by 2032, growing at a CAGR of 1.4% from 2026 to 2032.
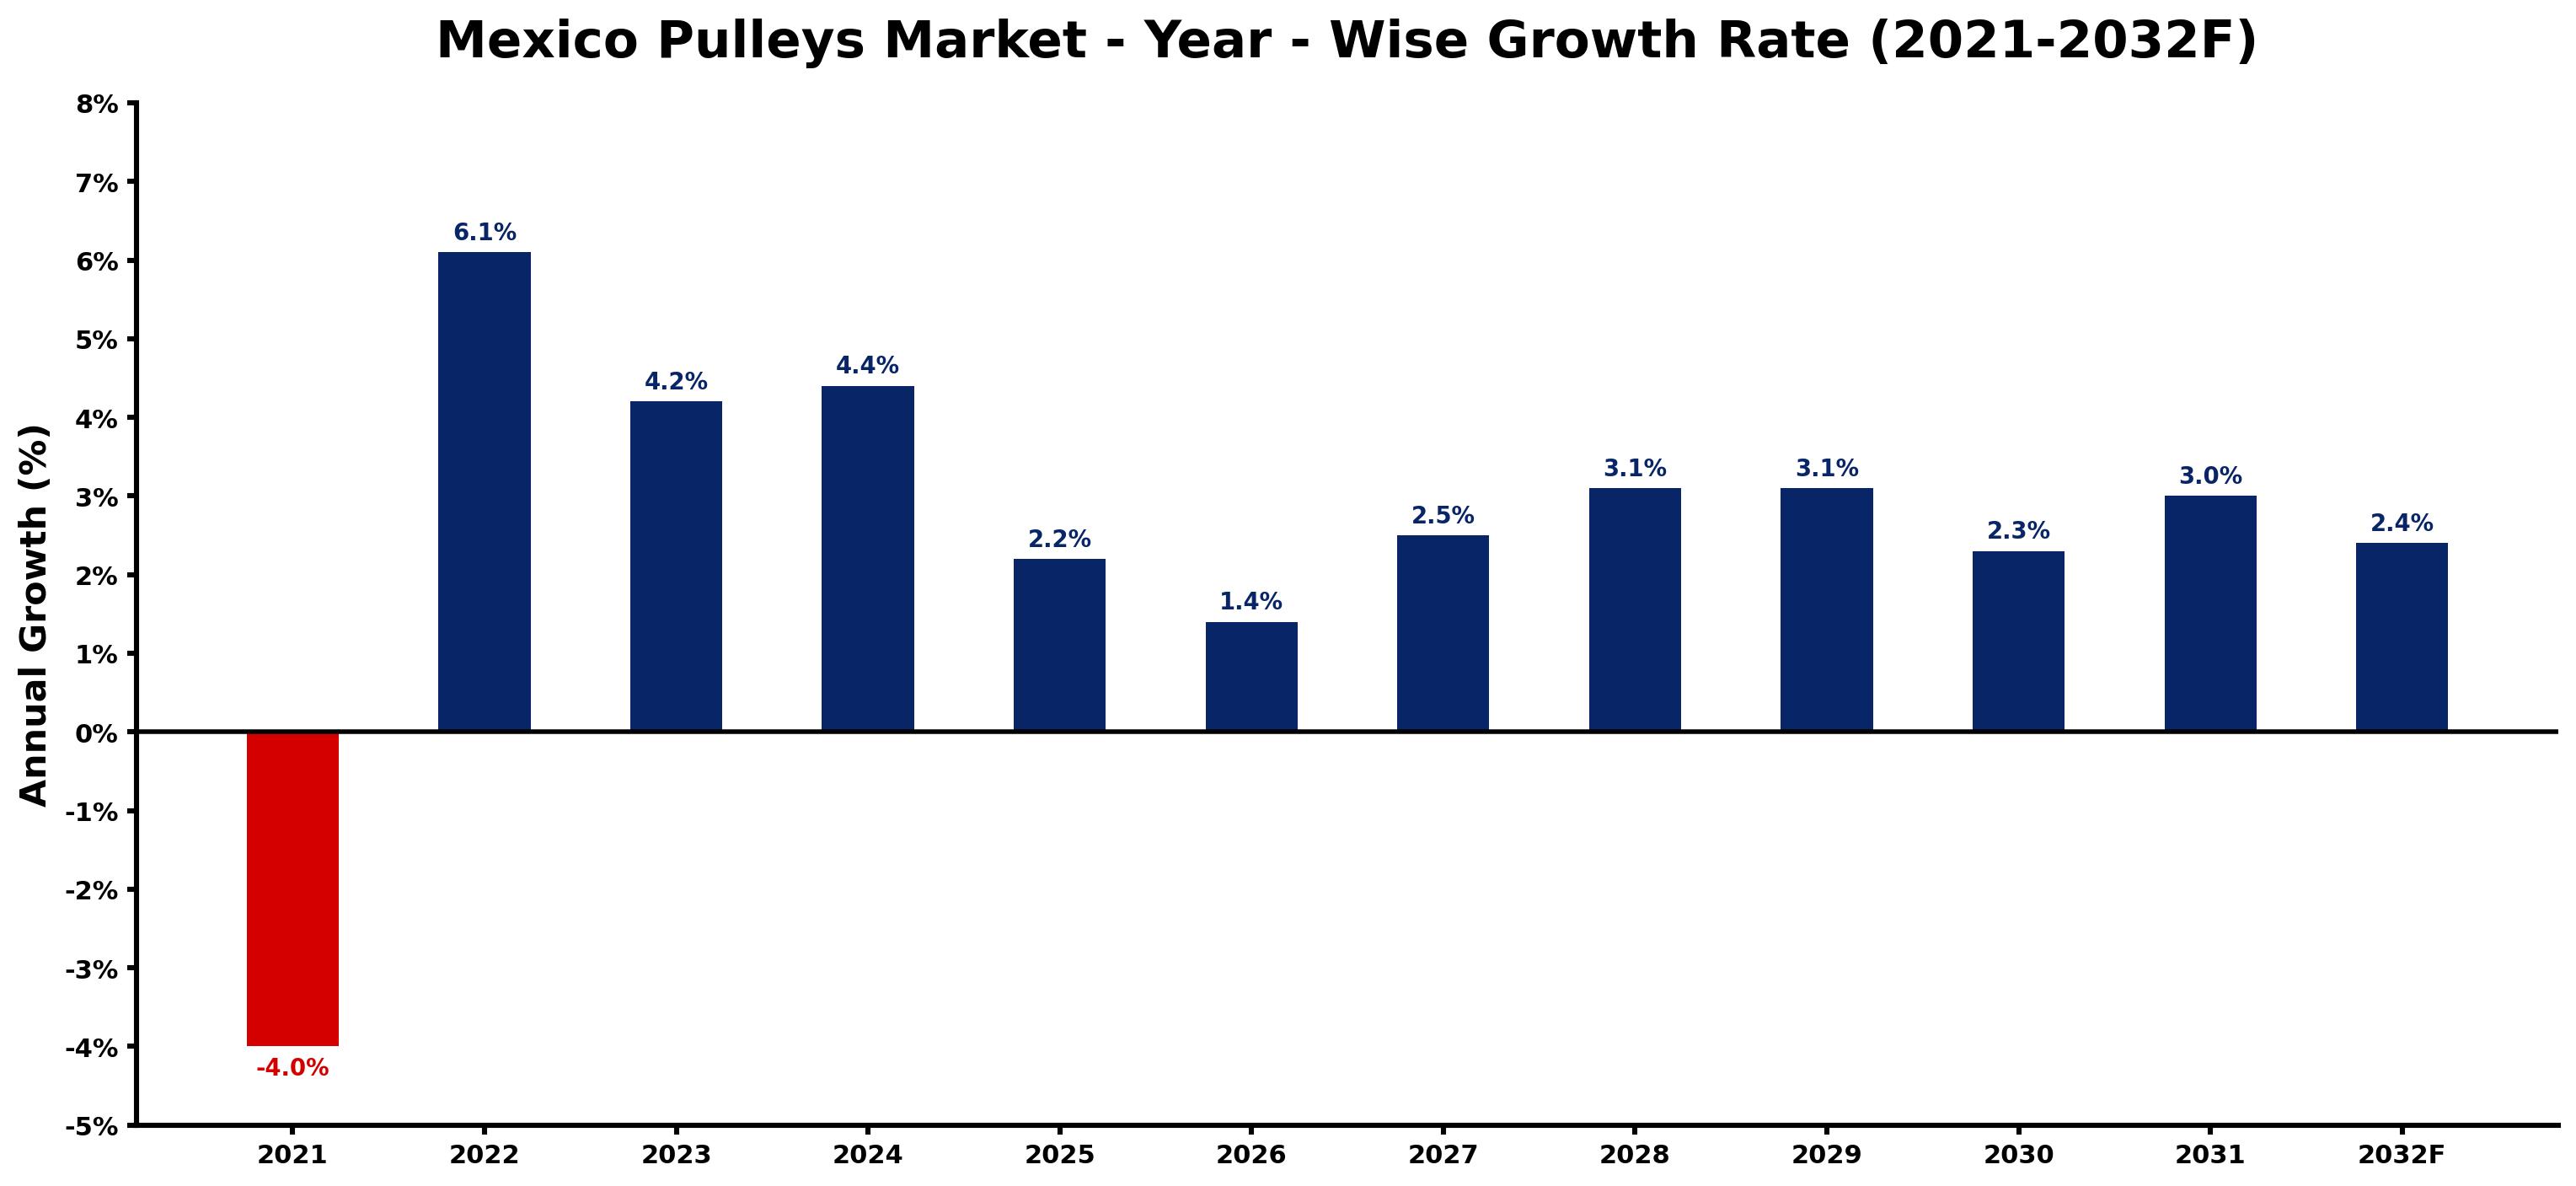
Mexico Pulleys Market Growth Rate Analysis (2021-2032)
The Mexico pulleys market experienced a challenging start, contracting by 4.0% in 2021, largely due to the pandemic's impact on manufacturing and supply chains. However, a recovery began in 2022, with growth reaching 6.1%, fueled by increased investment in infrastructure and a resurgence in industrial activity. As we move into 2023 and 2024, growth is projected at 4.2% and 4.4%, respectively, driven by rising consumer demand and advancements in technology that enhance efficiency. Despite a gradual slowdown thereafter, with 2.2% growth anticipated in 2025, the market shows resilience supported by ongoing energy transition efforts and digitalization, laying a solid foundation for steady growth through the next decade.
Mexico Pulleys Market Year-wise Growth Rate and Key Drivers
This graph highlights how the Mexico Pulleys Market has steadily grown over the past five years, supported by major growth factors.
The table below presents the year wise growth rates along with the key drivers influencing the market
| Year | Growth Rate | Major Drivers |
| 2021 | -4.0% | Supply chain disruptions hindered manufacturing efficiency and delayed project timelines in the construction sector. |
| 2022 | 6.1% | Local manufacturers strengthened supply chains, enhancing access to quality pulley products. |
| 2023 | 4.2% | Emerging construction projects across urban areas increased requirements for heavy-duty pulleys. |
| 2024 | 4.4% | Renewable energy initiatives prompted new applications for pulleys in wind and solar sectors. |
| 2025 | 2.2% | Technological upgrades in mining operations necessitated advanced pulley systems for efficiency. |
| 2026 | 1.4% | Rising globalization encouraged foreign investments in Mexico's manufacturing operations, expanding market potential. |
| 2027 | 2.5% | Innovative designs in automation created new opportunities for pulleys in robotics applications. |
| 2028 | 3.1% | Sustainable practices became central to industries, influencing choices for eco-friendly pulleys. |
| 2029 | 3.1% | Infrastructure development programs directly impacted construction-related pulley demands significantly. |
| 2030 | 2.3% | Workforce training initiatives improved skills, fostering innovation in pulley manufacturing processes. |
| 2031 | 3.0% | Increasing urbanization drove demand for efficient transportation systems utilizing advanced pulleys. |
| 2032 | 2.4% | Digital transformation in industries increased reliance on smart pulley systems for automation. |
Note - Market size estimations and growth projections presented in this report are based on 6Wresearch's advanced forecasting approach, validated with industry datasets as of June 2026.
Mexico Pulleys Market Synopsis
The Mexico Pulleys Market is projected to reach 1.4% and witness significant growth during the forecast period (2026-2032). This market is fundamentally intertwined with the broader industrial and manufacturing sectors, which are increasingly adopting advanced machinery and automation techniques. Pulleys are essential components in power transmission systems, thereby serving a crucial role in enhancing operational efficiency and productivity across various applications.
Mexico Pulleys Market Growth Drivers
A variety of factors are propelling the Mexico Pulleys Market forward. The foremost driver is the ongoing expansion of the industrial and manufacturing sectors. With a focus on modernization, businesses are investing in upgraded machinery that incorporates efficient power transmission solutions. In addition, the rising demand for automation is catalyzing the adoption of pulleys in various applications.
- The shift towards energy efficiency is another significant aspect influencing market growth as businesses strive to reduce operational costs and environmental impact.
- Technological advancements in manufacturing processes are enhancing the performance and durability of pulleys, making them more appealing to new customers.
- Increased construction activities, fueled by urbanization and infrastructure projects, are also driving demand for pulleys in the construction machinery sector.
- The rising emphasis on supply chain optimization and logistics has heightened the necessity for reliable power transmission systems, further supporting market expansion.
- Lastly, the growing trend of maintenance outsourcing in industrial operations is likely to increase the demand for high-quality pulleys and related components.
Mexico Pulleys Market Challenges and Restraints
While the Mexico Pulleys Market showcases promising growth prospects, it is not without its challenges. The primary challenge arises from the diverse requirements of various industries. Each sector utilizing pulleys—ranging from manufacturing to transportation—necessitates specific designs and functionalities.
- This need for customization can lead to increased production complexities, potentially causing delays and impacting overall supply chain efficiency.
- Moreover, fluctuations in the global economy can adversely affect the demand for pulleys as companies may halt investments during economic downturns.
- The presence of inexpensive imports can also pose a challenge to domestic manufacturers, forcing them to innovate continuously and maintain competitive pricing.
- Furthermore, there are regulatory compliance issues that manufacturers must navigate, which can lead to increased costs and longer time-to-market for new products.
- Lastly, securing raw materials at stable prices can sometimes prove problematic, influencing production schedules and profit margins.
Mexico Pulleys Market Government Investment and Initiatives
The government of Mexico plays a crucial role in fostering the growth of the Pulleys Market through various policies and initiatives aimed at industrial development. Key governmental strategies emphasize the importance of infrastructure modernization, energy efficiency, and technological advancement.
- Incentives for investment in modern manufacturing facilities are being provided, encouraging businesses to upgrade their plants with state-of-the-art technologies.
- Support for compliance with quality standards assures that manufacturers can produce high-quality products, which boosts competitiveness on both domestic and international fronts.
- Public spending is directed toward improving transportation networks, which enhances supply chain efficiency and the distribution of pulleys across industries.
- Additionally, there are ongoing initiatives that focus on promoting renewable energy sources, indirectly benefiting manufacturers who utilize pulleys in energy-efficient systems.
- Collaboration among government agencies, industry associations, and academic institutions is also being encouraged to foster innovation and knowledge exchange within the Mexico Pulleys Market.
Mexico Pulleys Market Latest Developments (May 2025 - June 2026)
Recent trends in the Mexico Pulleys Market indicate a positive trajectory towards advanced manufacturing technologies. Several initiatives have been launched aimed at boosting productivity and sustainability in the production of pulleys. Industry players are increasingly exploring automation solutions to enhance precision and reduce lead times in manufacturing processes. Furthermore, partnerships across sectors are gaining traction, focusing on developing innovative pulley designs that cater to specific industrial applications.
- Companies are investing in research and development to improve material durability and performance characteristics, responding to both local and global market demands.
- Moreover, the trend towards integrated supply chains is gaining momentum, enabling quicker and more efficient distribution of products.
- Renewed emphasis is being placed on sustainability, with many manufacturers seeking to adopt eco-friendly production practices.
- The government's support for infrastructure projects has also stimulated demand for pulleys in various construction and logistics applications.
- Trade discussions and agreements are influencing supply dynamics, providing opportunities for market players to expand their reach and optimize production capabilities.
Mexico Pulleys Market - Key Attractiveness of the Report
- 10 Years of Market Numbers
- Historical Data Starting from 2022 to 2025
- Base Year: 2025
- Forecast Data until 2032
- Key Performance Indicators Impacting the Market
- Major Upcoming Developments and Projects
Key Highlights of the Report:
- Mexico Pulleys Market Outlook
- Market Size of Mexico Pulleys Market, 2025
- Forecast of Mexico Pulleys Market, 2032
- Historical Data and Forecast of Mexico Pulleys Revenues & Volume for the Period 2022-2032F
- Mexico Pulleys Market Trend Evolution
- Mexico Pulleys Market Drivers and Challenges
- Mexico Pulleys Price Trends
- Mexico Pulleys Porter's Five Forces
- Mexico Pulleys Industry Life Cycle
- Historical Data and Forecast of Mexico Pulleys Market Revenues & Volume By Type for the Period 2022-2032F
- Historical Data and Forecast of Mexico Pulleys Market Revenues & Volume By Steel for the Period 2022-2032F
- Historical Data and Forecast of Mexico Pulleys Market Revenues & Volume By Cast Iron for the Period 2022-2032F
- Historical Data and Forecast of Mexico Pulleys Market Revenues & Volume By Glass Filled Polymer for the Period 2022-2032F
- Historical Data and Forecast of Mexico Pulleys Market Revenues & Volume By Applications for the Period 2022-2032F
- Historical Data and Forecast of Mexico Pulleys Market Revenues & Volume By OEM for the Period 2022-2032F
- Historical Data and Forecast of Mexico Pulleys Market Revenues & Volume By Aftermarket for the Period 2022-2032F
- Mexico Pulleys Import Export Trade Statistics
- Market Opportunity Assessment By Type
- Market Opportunity Assessment By Applications
- Mexico Pulleys Top Companies Market Share
- Mexico Pulleys Competitive Benchmarking By Technical and Operational Parameters
- Mexico Pulleys Company Profiles
- Mexico Pulleys Key Strategic Recommendations
Frequently Asked Questions About the Market Study (FAQs):
The main driving factors include the expansion of the industrial sector, increased automation, demand for energy efficiency, and infrastructure development.
Challenges include the need for customization across diverse applications, economic fluctuations, and competition from imported products.
The government provides incentives for investments in manufacturing, focuses on energy efficiency, and promotes collaboration among industry stakeholders.
The forecast period for the Mexico Pulleys Market is from 2026 to 2032.
6Wresearch actively monitors the Mexico Pulleys Market and publishes its comprehensive annual report, highlighting emerging trends, growth drivers, revenue analysis, and forecast outlook. Our insights help businesses to make data-backed strategic decisions with ongoing market dynamics. Our analysts track relevent industries related to the Mexico Pulleys Market, allowing our clients with actionable intelligence and reliable forecasts tailored to emerging regional needs.
Yes, we provide customisation as per your requirements. To learn more, feel free to contact us on sales@6wresearch.com
1 Executive Summary |
2 Introduction |
2.1 Key Highlights of the Report |
2.2 Report Description |
2.3 Market Scope & Segmentation |
2.4 Research Methodology |
2.5 Assumptions |
3 Mexico Pulleys Market Overview |
3.1 Mexico Country Macro Economic Indicators |
3.2 Mexico Pulleys Market Revenues & Volume, 2022 & 2032F |
3.3 Mexico Pulleys Market - Industry Life Cycle |
3.4 Mexico Pulleys Market - Porter's Five Forces |
3.5 Mexico Pulleys Market Revenues & Volume Share, By Type, 2022 & 2032F |
3.6 Mexico Pulleys Market Revenues & Volume Share, By Applications, 2022 & 2032F |
4 Mexico Pulleys Market Dynamics |
4.1 Impact Analysis |
4.2 Market Drivers |
4.2.1 Increasing industrialization in Mexico leading to higher demand for pulleys |
4.2.2 Growth in the automotive sector driving the need for pulleys in manufacturing processes |
4.2.3 Rising investments in infrastructure projects requiring pulleys for construction and machinery |
4.3 Market Restraints |
4.3.1 Fluctuating raw material prices impacting production costs |
4.3.2 Competition from substitute products like gears and belts affecting market penetration |
4.3.3 Economic uncertainties influencing investment decisions and infrastructure projects |
5 Mexico Pulleys Market Trends |
6 Mexico Pulleys Market, By Types |
6.1 Mexico Pulleys Market, By Type |
6.1.1 Overview and Analysis |
6.1.2 Mexico Pulleys Market Revenues & Volume, By Type, 2022-2032F |
6.1.3 Mexico Pulleys Market Revenues & Volume, By Steel, 2022-2032F |
6.1.4 Mexico Pulleys Market Revenues & Volume, By Cast Iron, 2022-2032F |
6.1.5 Mexico Pulleys Market Revenues & Volume, By Glass Filled Polymer, 2022-2032F |
6.2 Mexico Pulleys Market, By Applications |
6.2.1 Overview and Analysis |
6.2.2 Mexico Pulleys Market Revenues & Volume, By OEM, 2022-2032F |
6.2.3 Mexico Pulleys Market Revenues & Volume, By Aftermarket, 2022-2032F |
7 Mexico Pulleys Market Import-Export Trade Statistics |
7.1 Mexico Pulleys Market Export to Major Countries |
7.2 Mexico Pulleys Market Imports from Major Countries |
8 Mexico Pulleys Market Key Performance Indicators |
8.1 Number of industrial projects in Mexico utilizing pulleys |
8.2 Percentage increase in automotive production in Mexico |
8.3 Growth rate of infrastructure investments in the country |
8.4 Adoption rate of advanced pulley technologies in manufacturing processes |
8.5 Number of new entrants or competitors in the pulleys market in Mexico |
9 Mexico Pulleys Market - Opportunity Assessment |
9.1 Mexico Pulleys Market Opportunity Assessment, By Type, 2022 & 2032F |
9.2 Mexico Pulleys Market Opportunity Assessment, By Applications, 2022 & 2032F |
10 Mexico Pulleys Market - Competitive Landscape |
10.1 Mexico Pulleys Market Revenue Share, By Companies, 2025 |
10.2 Mexico Pulleys Market Competitive Benchmarking, By Operating and Technical Parameters |
11 Company Profiles |
12 Recommendations |
13 Disclaimer |
Global Go To Market Strategy - 2030
Export potential enables firms to identify high-growth global markets with greater confidence by combining advanced trade intelligence with a structured quantitative methodology. The framework analyzes emerging demand trends and country-level import patterns while integrating macroeconomic and trade datasets such as GDP and population forecasts, bilateral import–export flows, tariff structures, elasticity differentials between developed and developing economies, geographic distance, and import demand projections. Using weighted trade values from 2020–2024 as the base period to project country-to-country export potential for 2030, these inputs are operationalized through calculated drivers such as gravity model parameters, tariff impact factors, and projected GDP per-capita growth. Through an analysis of hidden potentials, demand hotspots, and market conditions that are most favorable to success, this method enables firms to focus on target countries, maximize returns, and global expansion with data, backed by accuracy.
By factoring in the projected importer demand gap that is currently unmet and could be potential opportunity, it identifies the potential for the Exporter (Country) among 190 countries, against the general trade analysis, which identifies the biggest importer or exporter.
To discover high-growth global markets and optimize your business strategy:
Click Here
Pricing
- Single User License$ 1,995
- Department License$ 2,400
- Site License$ 3,120
- Global License$ 3,795

Leadership Perspectives from Industry Events
Search
Thought Leadership and Analyst Meet


Our Clients
6WResearch In News
- India Air Conditioner Market Set for Strong Rebound in 2026 After Weather-Led Correction and GST-Driven Recovery: 6Wresearch
- ADAS in India: How Automatic Emergency Braking, Blind Spot Detection & Driver Monitoring are Transforming Road Safety
- Doha a strategic location for EV manufacturing hub: IPA Qatar
- Demand for luxury TVs surging in the GCC, says Samsung
- Empowering Growth: The Thriving Journey of Bangladesh’s Cable Industry
- Demand for luxury TVs surging in the GCC, says Samsung
Latest Reports
- Nicaragua RPG Gaming Market (2026-2032)
- New Zealand RPG Gaming Market (2026-2032)
- Netherlands RPG Gaming Market (2026-2032)
- Nauru RPG Gaming Market (2026-2032)
- Namibia RPG Gaming Market (2026-2032)
- Mozambique RPG Gaming Market (2026-2032)
- Montenegro RPG Gaming Market (2026-2032)
- Mongolia RPG Gaming Market (2026-2032)
- Monaco RPG Gaming Market (2026-2032)
- Micronesia RPG Gaming Market (2026-2032)
Industry Events and Analyst Meet

HIMTEX 2026

India Refining Summit 2026

India EV Show 2026

EV tech India Expo 2026

Auto Tech Asia 2026
Whitepaper
- Middle East & Africa Commercial Security Market Click here to view more.
- Middle East & Africa Fire Safety Systems & Equipment Market Click here to view more.
- GCC Drone Market Click here to view more.
- Middle East Lighting Fixture Market Click here to view more.
- GCC Physical & Perimeter Security Market Click here to view more.