Myanmar 3D Holographic Display and Services Market (2026-2032) Outlook | Revenue, Value, Analysis, Trends, Forecast, Companies, Industry, Size, Growth & Share
Market Forecast By End-users (Media and Entertainment, Consumer Electronics, Healthcare, Automotive, Retail, Others) And Competitive Landscape
| Product Code: ETC066773 | Publication Date: Aug 2021 | Updated Date: Jun 2026 | Product Type: Report | |
| Publisher: 6Wresearch | Author: Dhaval Chaurasia | No. of Pages: 70 | No. of Figures: 35 | No. of Tables: 5 |
Myanmar 3D Holographic Display and Services Market Size, Share & Growth Rate
The Myanmar 3D Holographic Display and Services Market was estimated at USD 1445 Million in 2025 and is projected to reach USD 2078 Million by 2032, growing at a CAGR of 5.3% from 2026 to 2032. This growth is fueled by a burgeoning interest in cutting-edge advertising techniques and the need for immersive customer interactions across various sectors. As businesses increasingly pivot towards digital solutions, the demand for innovative technologies like 3D holographic displays is set to soar, particularly in retail, education, and entertainment.
Myanmar 3D Holographic Display and Services Market Year-wise Growth Rate and Key Drivers
This graph highlights how the Myanmar 3D Holographic Display and Services Market has steadily grown over the years, supported by major growth factors.
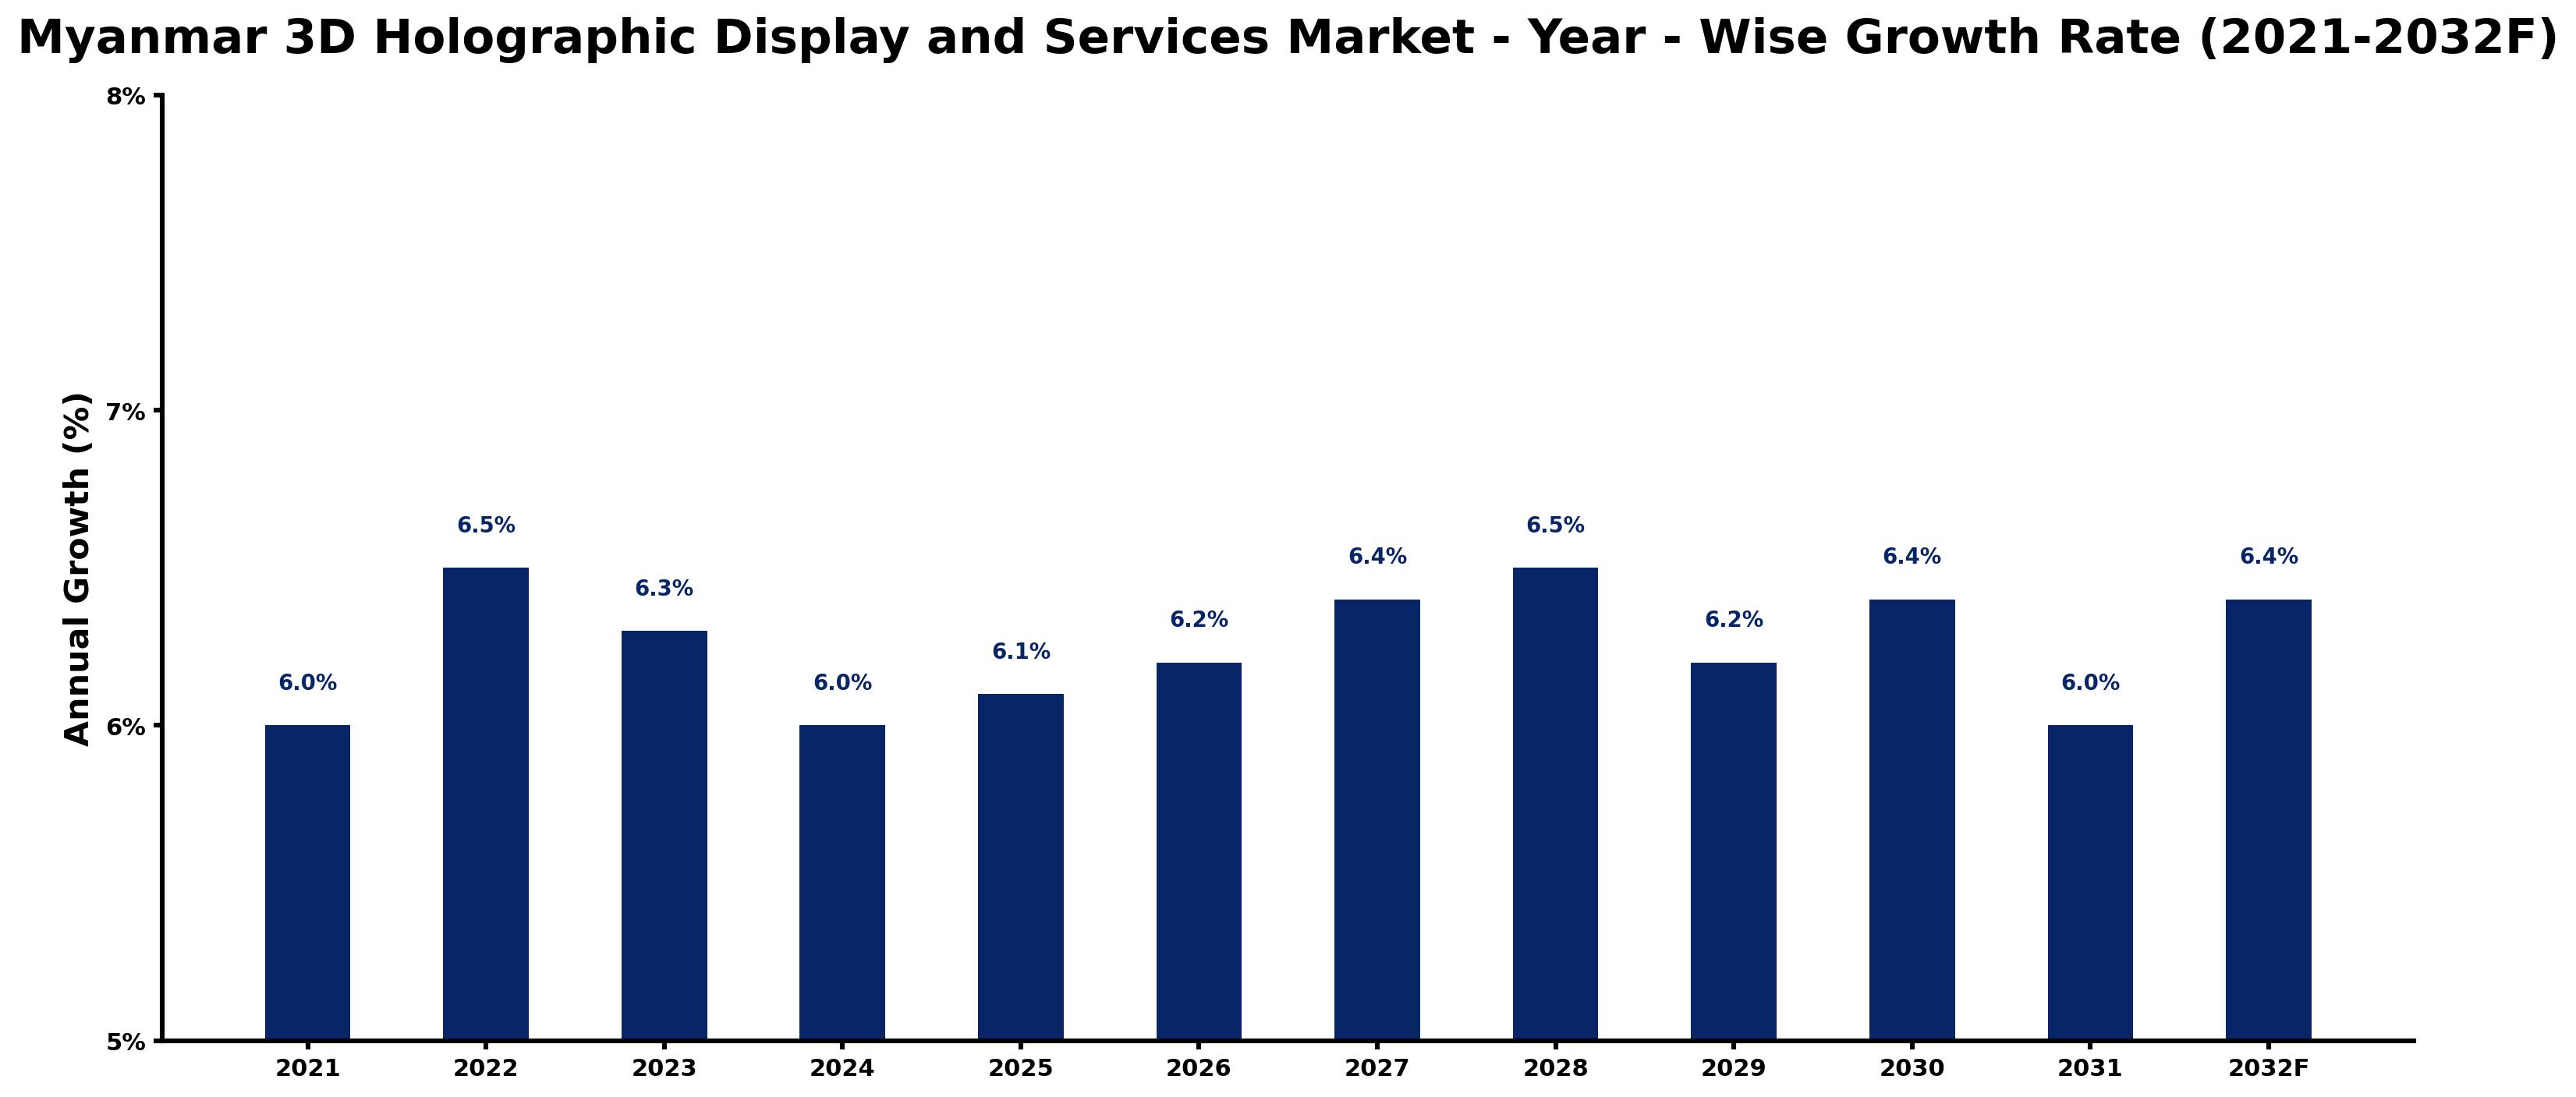
The table below presents the year‑wise growth rates along with the key drivers influencing the market
| Year | Growth Rate | Major Drivers |
| 2021 | 6.0% | Increasing industrial automation investments |
| 2022 | 6.5% | Increasing industrial automation investments |
| 2023 | 6.3% | Growing urbanization and commercial development |
| 2024 | 6.0% | Increasing adoption of advanced technologies |
| 2025 | 6.1% | Expansion of manufacturing activities |
| 2026 | 6.2% | Increasing adoption of advanced technologies |
| 2027 | 6.4% | Increasing industrial infrastructure investments |
| 2028 | 6.5% | Expansion of commercial construction activities |
| 2029 | 6.2% | Government infrastructure modernization initiatives |
| 2030 | 6.4% | Expansion of transportation and logistics networks |
| 2031 | 6.0% | Expansion of transportation and logistics networks |
| 2032 | 6.4% | Expansion of commercial construction activities |
Note - Market size estimations and growth projections presented in this report are based on 6Wresearch’s advanced forecasting approach, validated with industry datasets as of June 2026.
Myanmar 3D Holographic Display and Services Market Synopsis
In recent years, the Myanmar 3D holographic display and services market has gained considerable momentum, driven by advancements in technology and an evolving consumer landscape. However, this burgeoning market is still in its formative stages, with significant potential for further growth as businesses begin to understand and embrace the power of holographic solutions.
Looking ahead, the market is poised for transformation as more companies explore the benefits of engaging displays. The rising prevalence of immersive experiences in advertising and education signals a trend toward broader adoption, enhancing market dynamics while providing unique opportunities for innovation and investment.
Myanmar 3D Holographic Display and Services Market Key Takeaways
- The market is expected to reach USD 2078 Million by 2032, reflecting a strong growth trajectory.
- Innovative applications in retail and education are driving increased demand for 3D holographic displays.
- Emerging content creation services are expanding the market, meeting diverse business needs.
- Technological advancements, including glasses-free displays, are enhancing user experience and engagement.
- Government initiatives are fostering a supportive environment for growth in this sector.
Evaluation of Restraints in Myanmar 3D Holographic Display and Services Market
Despite its promising trajectory, the Myanmar 3D holographic display and services market grapples with certain constraints. A primary challenge is the limited awareness and understanding of holographic technology among potential users. Many businesses still lack exposure to the advantages and applications of 3D displays, resulting in hesitant adoption. Furthermore, the high costs associated with implementing these technologies can deter smaller enterprises from participating. A critical shortage of skilled professionals equipped to develop and support holographic solutions further compounds these issues, highlighting the need for educational initiatives and affordable technological options to stimulate growth.
Myanmar 3D Holographic Display and Services Market Trends
Several key trends are shaping the Myanmar 3D holographic display and services market. The growing integration of artificial intelligence and augmented reality within holographic solutions is enhancing interactivity and user engagement. Furthermore, the development of cost-effective holographic displays is making this technology more accessible to a wider range of businesses. As digital transformation accelerates, there's also an increasing reliance on holographic content creation services, allowing brands to better connect with their audiences through captivating visual narratives.
Myanmar 3D Holographic Display and Services Market Opportunities
The Myanmar 3D holographic display and services market presents a wealth of opportunities for investment and development. The growing demand for unique advertising solutions offers an enticing landscape for companies that specialize in holographic displays and services. Additionally, sectors such as healthcare and education are ripe for disruption through immersive technologies. By focusing on creating engaging experiences, businesses can leverage 3D holographic displays to attract customers and enhance communication, ensuring a robust return on investment in this evolving market.
Government Initiatives in the Myanmar 3D Holographic Display and Services Market
The Myanmar government is actively nurturing the 3D holographic display and services market through supportive policies and initiatives. By implementing regulations that promote technological innovation, the government is laying the groundwork for growth in this sector. Tax incentives and investment opportunities are encouraging local and international companies to engage in the market. Furthermore, collaborations with industry stakeholders are fostering research and development efforts, aimed at bolstering the capabilities of Myanmar's holographic display industry and positioning it competitively in the regional landscape.
Future Insights of the Myanmar 3D Holographic Display and Services Market
Looking ahead to 2026-2032, the Myanmar 3D holographic display and services market is set for remarkable growth. Increased investments in digital marketing and a heightened demand for immersive experiences will drive this expansion. As businesses continue to recognize the value of 3D holographic displays in enhancing communication and engagement, the adoption of these technologies is anticipated to rise steadily. Continuous innovations, coupled with the development of affordable solutions, will further stimulate market growth, enabling a vibrant ecosystem for both local and international players.
Myanmar 3D Holographic Display and Services Market Latest Developments (May 2025 - June 2026)
Recent developments in the Myanmar 3D holographic display and services market indicate a shift towards more interactive and engaging technologies. Industry players are increasingly focused on enhancing user experience through the integration of advanced technologies like augmented reality. Additionally, there is a notable increase in the demand for holographic content creation, reflecting a trend toward customized visual solutions tailored to specific business needs. As the market evolves, partnerships between technology providers and local businesses are expected to enhance the availability of innovative products and services.
Myanmar 3D Holographic Display and Services Market - Key Attractiveness of the Report
- 10 Years of Market Numbers
- Historical Data Starting from 2022 to 2025
- Base Year: 2025
- Forecast Data until 2032
- Key Performance Indicators Impacting the Market
- Major Upcoming Developments and Projects
Key Highlights of the Report:
- Myanmar 3D Holographic Display and Services Market Outlook
- Market Size of Myanmar 3D Holographic Display and Services Market, 2025
- Forecast of Myanmar 3D Holographic Display and Services Market, 2032
- Historical Data and Forecast of Myanmar 3D Holographic Display and Services Revenues & Volume for the Period 2022-2032F
- Myanmar 3D Holographic Display and Services Market Trend Evolution
- Myanmar 3D Holographic Display and Services Market Drivers and Challenges
- Myanmar 3D Holographic Display and Services Price Trends
- Myanmar 3D Holographic Display and Services Porter's Five Forces
- Myanmar 3D Holographic Display and Services Industry Life Cycle
- Historical Data and Forecast of Myanmar 3D Holographic Display and Services Market Revenues & Volume By End-users for the Period 2022-2032F
- Historical Data and Forecast of Myanmar 3D Holographic Display and Services Market Revenues & Volume By Media and Entertainment for the Period 2022-2032F
- Historical Data and Forecast of Myanmar 3D Holographic Display and Services Market Revenues & Volume By Consumer Electronics for the Period 2022-2032F
- Historical Data and Forecast of Myanmar 3D Holographic Display and Services Market Revenues & Volume By Healthcare for the Period 2022-2032F
- Historical Data and Forecast of Myanmar 3D Holographic Display and Services Market Revenues & Volume By Automotive for the Period 2022-2032F
- Historical Data and Forecast of Myanmar 3D Holographic Display and Services Market Revenues & Volume By Retail for the Period 2022-2032F
- Historical Data and Forecast of Myanmar 3D Holographic Display and Services Market Revenues & Volume By Others for the Period 2022-2032F
- Myanmar 3D Holographic Display and Services Import Export Trade Statistics
- Market Opportunity Assessment By End-users
- Myanmar 3D Holographic Display and Services Top Companies Market Share
- Myanmar 3D Holographic Display and Services Competitive Benchmarking By Technical and Operational Parameters
- Myanmar 3D Holographic Display and Services Company Profiles
- Myanmar 3D Holographic Display and Services Key Strategic Recommendations
Myanmar 3D Holographic Display and Services Market - Frequently Asked Questions
The market is primarily driven by a surge in demand for innovative advertising and immersive customer experiences across various industries such as retail and education.
The rise in virtual events and digital engagement strategies due to the pandemic has significantly increased the demand for 3D holographic displays.
The Myanmar 3D Holographic Display and Services Market was estimated at USD 1445 Million in 2025 and is projected to reach USD 2078 Million by 2032, growing at a CAGR of 5.3% from 2026 to 2032.
A significant challenge is the limited awareness of holographic technology's benefits, combined with high implementation costs, which can deter small businesses from investing.
Key sectors include advertising, education, and healthcare, where immersive visual experiences can greatly enhance communication and engagement.
6Wresearch actively monitors the Myanmar 3D Holographic Display and Services Market and publishes its comprehensive annual report, highlighting emerging trends, growth drivers, revenue analysis, and forecast outlook. Our insights help businesses to make data-backed strategic decisions with ongoing market dynamics. Our analysts track relevent industries related to the Myanmar 3D Holographic Display and Services Market, allowing our clients with actionable intelligence and reliable forecasts tailored to emerging regional needs.
Yes, we provide customisation as per your requirements. To learn more, feel free to contact us on sales@6wresearch.com
1 Executive Summary |
2 Introduction |
2.1 Key Highlights of the Report |
2.2 Report Description |
2.3 Market Scope & Segmentation |
2.4 Research Methodology |
2.5 Assumptions |
3 Myanmar 3D Holographic Display and Services Market Overview |
3.1 Myanmar Country Macro Economic Indicators |
3.2 Myanmar 3D Holographic Display and Services Market Revenues & Volume, 2022 & 2032F |
3.3 Myanmar 3D Holographic Display and Services Market - Industry Life Cycle |
3.4 Myanmar 3D Holographic Display and Services Market - Porter's Five Forces |
3.5 Myanmar 3D Holographic Display and Services Market Revenues & Volume Share, By End-users, 2022 & 2032F |
4 Myanmar 3D Holographic Display and Services Market Dynamics |
4.1 Impact Analysis |
4.2 Market Drivers |
4.3 Market Restraints |
5 Myanmar 3D Holographic Display and Services Market Trends |
6 Myanmar 3D Holographic Display and Services Market, By Types |
6.1 Myanmar 3D Holographic Display and Services Market, By End-users |
6.1.1 Overview and Analysis |
6.1.2 Myanmar 3D Holographic Display and Services Market Revenues & Volume, By End-users, 2022-2032F |
6.1.3 Myanmar 3D Holographic Display and Services Market Revenues & Volume, By Media and Entertainment, 2022-2032F |
6.1.4 Myanmar 3D Holographic Display and Services Market Revenues & Volume, By Consumer Electronics, 2022-2032F |
6.1.5 Myanmar 3D Holographic Display and Services Market Revenues & Volume, By Healthcare, 2022-2032F |
6.1.6 Myanmar 3D Holographic Display and Services Market Revenues & Volume, By Automotive, 2022-2032F |
6.1.7 Myanmar 3D Holographic Display and Services Market Revenues & Volume, By Retail, 2022-2032F |
6.1.8 Myanmar 3D Holographic Display and Services Market Revenues & Volume, By Others, 2022-2032F |
7 Myanmar 3D Holographic Display and Services Market Import-Export Trade Statistics |
7.1 Myanmar 3D Holographic Display and Services Market Export to Major Countries |
7.2 Myanmar 3D Holographic Display and Services Market Imports from Major Countries |
8 Myanmar 3D Holographic Display and Services Market Key Performance Indicators |
9 Myanmar 3D Holographic Display and Services Market - Opportunity Assessment |
9.1 Myanmar 3D Holographic Display and Services Market Opportunity Assessment, By End-users, 2022 & 2032F |
10 Myanmar 3D Holographic Display and Services Market - Competitive Landscape |
10.1 Myanmar 3D Holographic Display and Services Market Revenue Share, By Companies, 2025 |
10.2 Myanmar 3D Holographic Display and Services Market Competitive Benchmarking, By Operating and Technical Parameters |
11 Company Profiles |
12 Recommendations |
13 Disclaimer |
Global Go To Market Strategy - 2030
Export potential enables firms to identify high-growth global markets with greater confidence by combining advanced trade intelligence with a structured quantitative methodology. The framework analyzes emerging demand trends and country-level import patterns while integrating macroeconomic and trade datasets such as GDP and population forecasts, bilateral import–export flows, tariff structures, elasticity differentials between developed and developing economies, geographic distance, and import demand projections. Using weighted trade values from 2020–2024 as the base period to project country-to-country export potential for 2030, these inputs are operationalized through calculated drivers such as gravity model parameters, tariff impact factors, and projected GDP per-capita growth. Through an analysis of hidden potentials, demand hotspots, and market conditions that are most favorable to success, this method enables firms to focus on target countries, maximize returns, and global expansion with data, backed by accuracy.
By factoring in the projected importer demand gap that is currently unmet and could be potential opportunity, it identifies the potential for the Exporter (Country) among 190 countries, against the general trade analysis, which identifies the biggest importer or exporter.
To discover high-growth global markets and optimize your business strategy:
Click Here
Pricing
- Single User License$ 1,995
- Department License$ 2,400
- Site License$ 3,120
- Global License$ 3,795

Leadership Perspectives from Industry Events
Search
Thought Leadership and Analyst Meet


Our Clients
6WResearch In News
- India Air Conditioner Market Set for Strong Rebound in 2026 After Weather-Led Correction and GST-Driven Recovery: 6Wresearch
- ADAS in India: How Automatic Emergency Braking, Blind Spot Detection & Driver Monitoring are Transforming Road Safety
- Doha a strategic location for EV manufacturing hub: IPA Qatar
- Demand for luxury TVs surging in the GCC, says Samsung
- Empowering Growth: The Thriving Journey of Bangladesh’s Cable Industry
- Demand for luxury TVs surging in the GCC, says Samsung
Latest Reports
- Nicaragua RPG Gaming Market (2026-2032)
- New Zealand RPG Gaming Market (2026-2032)
- Netherlands RPG Gaming Market (2026-2032)
- Nauru RPG Gaming Market (2026-2032)
- Namibia RPG Gaming Market (2026-2032)
- Mozambique RPG Gaming Market (2026-2032)
- Montenegro RPG Gaming Market (2026-2032)
- Mongolia RPG Gaming Market (2026-2032)
- Monaco RPG Gaming Market (2026-2032)
- Micronesia RPG Gaming Market (2026-2032)
Industry Events and Analyst Meet

EV India Expo 2026

HIMTEX 2026

India Refining Summit 2026

India EV Show 2026

EV tech India Expo 2026
Whitepaper
- Middle East & Africa Commercial Security Market Click here to view more.
- Middle East & Africa Fire Safety Systems & Equipment Market Click here to view more.
- GCC Drone Market Click here to view more.
- Middle East Lighting Fixture Market Click here to view more.
- GCC Physical & Perimeter Security Market Click here to view more.