Myanmar Electronic parts Market (2026-2032) | Trends, Companies, Forecast, Size, Revenue, Value, Analysis, Industry, Growth, Outlook & Share
Market Forecast By Type (Passive, Active, Electro Mechanic), By Application (Automotive, Communications, Computing Applications, Others) And Competitive Landscape
| Product Code: ETC035574 | Publication Date: Oct 2020 | Updated Date: Jun 2026 | Product Type: Report | |
| Publisher: 6Wresearch | Author: Sumit Sagar | No. of Pages: 70 | No. of Figures: 35 | No. of Tables: 5 |
Myanmar Electronic parts Market Summary
The myanmar electronic parts market was estimated at USD 1086 Million in 2025 and is projected to reach USD 1575 Million by 2032, growing at a CAGR of 6.2% from 2026 to 2032.
Myanmar Electronic parts Market Growth Rate Analysis (2021-2032)
The Myanmar electronic parts market has exhibited stable growth, marked by a 6.5% increase in 2021 and an uptick to 6.7% in 2022, driven by heightened consumer demand and investments in local manufacturing capabilities. However, growth moderated to 6.2% in 2023, attributed to global supply chain disruptions. From 2024 onward, the market is expected to recover, forecasting a return to 6.7% growth in 2025 as infrastructure improvements boost production efficiency. Subsequent fluctuations, such as a dip to 6.1% in 2031, can be linked to shifts in technology and competitive pressures. Overall, the steady trajectory persists, reflecting ongoing digitalization efforts and an evolving industrial landscape in Myanmar.
Myanmar Electronic parts Market Year-wise Growth Rate and Key Drivers
This graph highlights how the Myanmar Electronic parts Market has steadily grown over the past five years, supported by major growth factors.
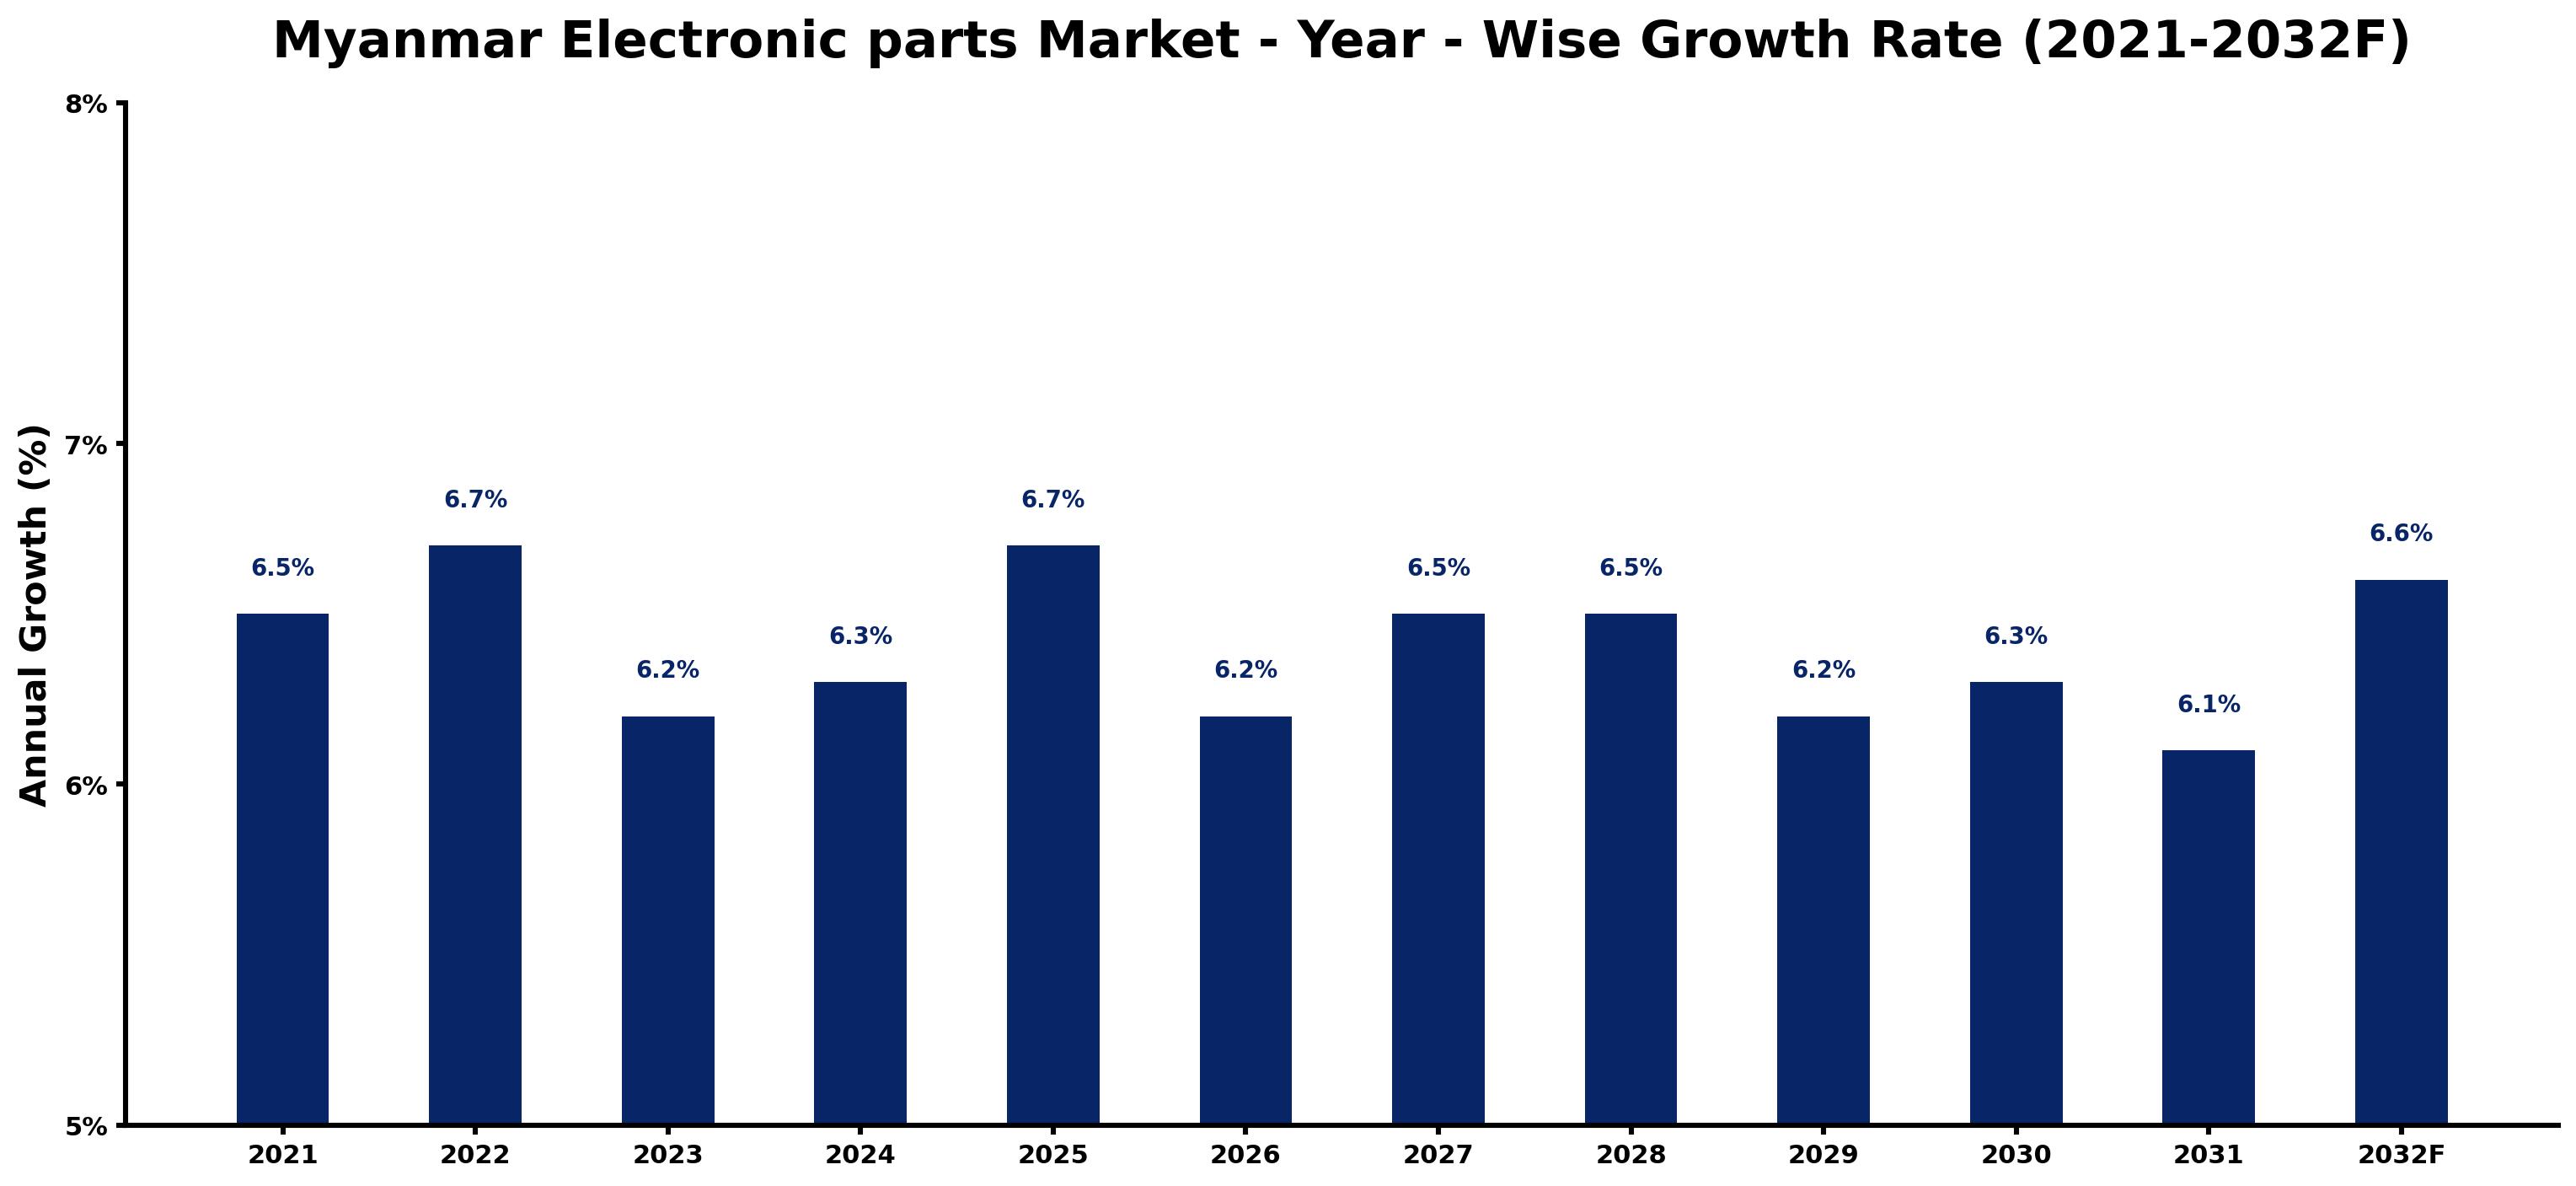
The table below presents the year wise growth rates along with the key drivers influencing the market
| Year | Growth Rate | Major Drivers |
| 2021 | 6.5% | Supply chain disruptions highlighted the need for local manufacturing capabilities in electronics. |
| 2022 | 6.7% | Emerging tech startups began focusing on innovative electronic solutions tailored for Myanmar. |
| 2023 | 6.2% | Investment in education improved workforce skills, enhancing local electronics production quality. |
| 2024 | 6.3% | Consumers increasingly sought affordable electronic components for personal and business use. |
| 2025 | 6.7% | International partnerships expanded, fostering knowledge transfer and investment in local industries. |
| 2026 | 6.2% | Infrastructural improvements facilitated easier logistics for importing electronic components. |
| 2027 | 6.5% | Urbanization trends shifted consumer preferences toward smart electronic devices and solutions. |
| 2028 | 6.5% | Sustainable practices gained traction, influencing electronic design and manufacturing processes. |
| 2029 | 6.2% | Increased internet access spurred the growth of e-commerce for electronic parts sales. |
| 2030 | 6.3% | Collaborative efforts among local manufacturers drove innovation in product development. |
| 2031 | 6.1% | Rising disposable incomes enabled households to invest more in electronic devices. |
| 2032 | 6.6% | A competitive landscape emerged as new entrants introduced diverse electronic products. |
Note - Market size estimations and growth projections presented in this report are based on 6Wresearch's advanced forecasting approach, validated with industry datasets as of June 2026.
Myanmar Electronic parts Market Synopsis
The Myanmar Electronic parts Market is projected to reach 6.2% and witness significant growth during the forecast period (2026-2032). This growth is primarily driven by an escalating demand for consumer electronics, telecommunications equipment, and automotive electronics. As the domestic manufacturing capabilities remain limited, the market is predominantly dependent on imported components. The industry is characterized by a diverse range of electronic components including integrated circuits, resistors, capacitors, and connectors which are supplied through various distributors and wholesalers.
Myanmar Electronic parts Market Growth Drivers
The growth trajectory of the Myanmar Electronic parts Market can be attributed to several key drivers:
- The increasing penetration of consumer electronics, propelled by a young, tech-savvy population eager to adopt the latest devices.
- Expansion of telecommunication networks, necessitating advanced and reliable electronic components to support connectivity solutions.
- Automotive electronics demand is rising, with the growing interest in electric vehicles and smart automotive technologies.
- Government initiatives aimed at enhancing digital infrastructure and promoting foreign investments within the electronics sector.
- The shift towards energy-efficient technologies, such as LED lighting and power-saving devices, spurred by sustainability goals across various industries.
Myanmar Electronic parts Market Trends and Opportunities
Current trends in the Myanmar Electronic parts Market indicate a shift towards more advanced and specialized components:
- Rising demand for Internet of Things (IoT) devices, driving the need for advanced semiconductor components, sensors, and connectors.
- Increased focus on sourcing high-quality electronic parts from reliable suppliers to ensure product durability and performance.
- Adoption of automation solutions is gaining traction, creating opportunities for suppliers of specialized electronic parts tailored to various industries.
- Investments in renewable energy technologies are stimulating interest in energy-efficient electronic components.
- The ongoing digital transformation across sectors, including healthcare and transportation, is advancing the market for sophisticated electronic parts.
Myanmar Electronic parts Market Challenges and Restraints
Despite its growth prospects, the Myanmar Electronic parts Market encounters several challenges that could hamper its development:
- Limited access to high-quality components hampers local manufacturers who struggle to meet increasing consumer expectations.
- Inadequate infrastructure, particularly in transportation and logistics, restricts the efficient distribution of electronic parts.
- A notable shortage of skilled labor in the electronics sector complicates operations and hampers overall productivity.
- The heavy reliance on imports results in supply chain vulnerabilities, leading to potential disruptions and escalated costs.
- Political and economic instability may deter foreign investment, impacting the market dynamics and growth potential.
Myanmar Electronic parts Market Investment Opportunities
The Myanmar Electronic parts Market presents numerous investment opportunities, fueled by the country's burgeoning industrial landscape:
- Increased demand for semiconductors and electronic components provides a fertile ground for establishing local production facilities.
- Investment in distribution channels specifically designed for electronic parts can improve accessibility and reduce sourcing challenges.
- Forming strategic partnerships with local manufacturers can enhance market penetration and expand supply chain efficiencies.
- Participation in government-led initiatives aimed at improving infrastructure and attracting foreign capital can yield substantial benefits.
- Leveraging emerging technologies and trends, such as IoT and renewable energy, can position investors advantageously within the market.
Myanmar Electronic parts Market Government Investment and Initiatives
Government policies are pivotal in shaping the Myanmar Electronic parts Market. The Myanmar Investment Commission (MIC) plays a crucial role in facilitating foreign investment, while the Industrial Zone Management Committee oversees industrial development. The Import and Export Registration Office regulates trade, ensuring compliance with market standards. Furthermore, the government has introduced various tax incentives and duty exemptions to attract investments into the electronic parts sector. Despite these initiatives, challenges related to infrastructure limitations and a skilled workforce persist, necessitating ongoing public and private collaboration to foster growth.
Myanmar Electronic parts Market Latest Developments (May 2025 - June 2026)
Recent developments in the Myanmar Electronic parts Market highlight a heightened focus on technology adoption and infrastructure upgrades. Increased investment in telecommunications networks has been observed, reflecting the government's strategic commitment to enhance connectivity. Additionally, there is a noticeable uptick in partnerships aimed at boosting local manufacturing capabilities. The shift toward sustainability is also prominent, with more companies exploring energy-efficient technologies and components. Overall, these developments underscore a forward momentum within the market, setting the stage for long-term growth and innovation.
Myanmar Electronic parts Market - Key Attractiveness of the Report
- 10 Years of Market Numbers
- Historical Data Starting from 2022 to 2025
- Base Year: 2025
- Forecast Data until 2032
- Key Performance Indicators Impacting the Market
- Major Upcoming Developments and Projects
Key Highlights of the Report:
- Myanmar Electronic parts Market Outlook
- Market Size of Myanmar Electronic parts Market, 2025
- Forecast of Myanmar Electronic parts Market, 2032F
- Historical Data and Forecast of Myanmar Electronic parts Revenues & Volume for the Period 2022-2032F
- Myanmar Electronic parts Market Trend Evolution
- Myanmar Electronic parts Market Drivers and Challenges
- Myanmar Electronic parts Price Trends
- Myanmar Electronic parts Porter's Five Forces
- Myanmar Electronic parts Industry Life Cycle
- Historical Data and Forecast of Myanmar Electronic parts Market Revenues & Volume By Type for the Period 2022-2032F
- Historical Data and Forecast of Myanmar Electronic parts Market Revenues & Volume By Passive for the Period 2022-2032F
- Historical Data and Forecast of Myanmar Electronic parts Market Revenues & Volume By Active for the Period 2022-2032F
- Historical Data and Forecast of Myanmar Electronic parts Market Revenues & Volume By Electro Mechanic for the Period 2022-2032F
- Historical Data and Forecast of Myanmar Electronic parts Market Revenues & Volume By Application for the Period 2022-2032F
- Historical Data and Forecast of Myanmar Electronic parts Market Revenues & Volume By Automotive for the Period 2022-2032F
- Historical Data and Forecast of Myanmar Electronic parts Market Revenues & Volume By Communications for the Period 2022-2032F
- Historical Data and Forecast of Myanmar Electronic parts Market Revenues & Volume By Computing Applications for the Period 2022-2032F
- Historical Data and Forecast of Myanmar Electronic parts Market Revenues & Volume By Others for the Period 2022-2032F
- Myanmar Electronic parts Import Export Trade Statistics
- Market Opportunity Assessment By Type
- Market Opportunity Assessment By Application
- Myanmar Electronic parts Top Companies Market Share
- Myanmar Electronic parts Competitive Benchmarking By Technical and Operational Parameters
- Myanmar Electronic parts Company Profiles
- Myanmar Electronic parts Key Strategic Recommendations
Frequently Asked Questions About the Market Study (FAQs):
The growth is primarily driven by increasing demand for consumer electronics, telecommunications, and automotive electronics, alongside government initiatives promoting investment in the electronics sector.
Challenges include limited access to quality components, inadequate infrastructure, and skilled labor shortages, which collectively impact market productivity and growth potential.
The government supports the market through the Myanmar Investment Commission, tax incentives, and industrial development initiatives aimed at bolstering local production capabilities.
The future outlook is promising, driven by growing industrialization and demand for electronic devices, although infrastructure limitations and regulatory hurdles may pose challenges to sustained growth.
6Wresearch actively monitors the Myanmar Electronic parts Market and publishes its comprehensive annual report, highlighting emerging trends, growth drivers, revenue analysis, and forecast outlook. Our insights help businesses to make data-backed strategic decisions with ongoing market dynamics. Our analysts track relevent industries related to the Myanmar Electronic parts Market, allowing our clients with actionable intelligence and reliable forecasts tailored to emerging regional needs.
Yes, we provide customisation as per your requirements. To learn more, feel free to contact us on sales@6wresearch.com
1 Executive Summary |
2 Introduction |
2.1 Key Highlights of the Report |
2.2 Report Description |
2.3 Market Scope & Segmentation |
2.4 Research Methodology |
2.5 Assumptions |
3 Myanmar Electronic parts Market Overview |
3.1 Myanmar Country Macro Economic Indicators |
3.2 Myanmar Electronic parts Market Revenues & Volume, 2022 & 2032F |
3.3 Myanmar Electronic parts Market - Industry Life Cycle |
3.4 Myanmar Electronic parts Market - Porter's Five Forces |
3.5 Myanmar Electronic parts Market Revenues & Volume Share, By Type, 2022 & 2032F |
3.6 Myanmar Electronic parts Market Revenues & Volume Share, By Application, 2022 & 2032F |
4 Myanmar Electronic parts Market Dynamics |
4.1 Impact Analysis |
4.2 Market Drivers |
4.3 Market Restraints |
5 Myanmar Electronic parts Market Trends |
6 Myanmar Electronic parts Market, By Types |
6.1 Myanmar Electronic parts Market, By Type |
6.1.1 Overview and Analysis |
6.1.2 Myanmar Electronic parts Market Revenues & Volume, By Type, 2022-2032F |
6.1.3 Myanmar Electronic parts Market Revenues & Volume, By Passive, 2022-2032F |
6.1.4 Myanmar Electronic parts Market Revenues & Volume, By Active, 2022-2032F |
6.1.5 Myanmar Electronic parts Market Revenues & Volume, By Electro Mechanic, 2022-2032F |
6.2 Myanmar Electronic parts Market, By Application |
6.2.1 Overview and Analysis |
6.2.2 Myanmar Electronic parts Market Revenues & Volume, By Automotive, 2022-2032F |
6.2.3 Myanmar Electronic parts Market Revenues & Volume, By Communications, 2022-2032F |
6.2.4 Myanmar Electronic parts Market Revenues & Volume, By Computing Applications, 2022-2032F |
6.2.5 Myanmar Electronic parts Market Revenues & Volume, By Others, 2022-2032F |
7 Myanmar Electronic parts Market Import-Export Trade Statistics |
7.1 Myanmar Electronic parts Market Export to Major Countries |
7.2 Myanmar Electronic parts Market Imports from Major Countries |
8 Myanmar Electronic parts Market Key Performance Indicators |
9 Myanmar Electronic parts Market - Opportunity Assessment |
9.1 Myanmar Electronic parts Market Opportunity Assessment, By Type, 2022 & 2032F |
9.2 Myanmar Electronic parts Market Opportunity Assessment, By Application, 2022 & 2032F |
10 Myanmar Electronic parts Market - Competitive Landscape |
10.1 Myanmar Electronic parts Market Revenue Share, By Companies, 2025 |
10.2 Myanmar Electronic parts Market Competitive Benchmarking, By Operating and Technical Parameters |
11 Company Profiles |
12 Recommendations |
13 Disclaimer |
Global Go To Market Strategy - 2030
Export potential enables firms to identify high-growth global markets with greater confidence by combining advanced trade intelligence with a structured quantitative methodology. The framework analyzes emerging demand trends and country-level import patterns while integrating macroeconomic and trade datasets such as GDP and population forecasts, bilateral import–export flows, tariff structures, elasticity differentials between developed and developing economies, geographic distance, and import demand projections. Using weighted trade values from 2020–2024 as the base period to project country-to-country export potential for 2030, these inputs are operationalized through calculated drivers such as gravity model parameters, tariff impact factors, and projected GDP per-capita growth. Through an analysis of hidden potentials, demand hotspots, and market conditions that are most favorable to success, this method enables firms to focus on target countries, maximize returns, and global expansion with data, backed by accuracy.
By factoring in the projected importer demand gap that is currently unmet and could be potential opportunity, it identifies the potential for the Exporter (Country) among 190 countries, against the general trade analysis, which identifies the biggest importer or exporter.
To discover high-growth global markets and optimize your business strategy:
Click Here
Pricing
- Single User License$ 1,995
- Department License$ 2,400
- Site License$ 3,120
- Global License$ 3,795

Leadership Perspectives from Industry Events
Search
Thought Leadership and Analyst Meet


Our Clients
6WResearch In News
- India Air Conditioner Market Set for Strong Rebound in 2026 After Weather-Led Correction and GST-Driven Recovery: 6Wresearch
- ADAS in India: How Automatic Emergency Braking, Blind Spot Detection & Driver Monitoring are Transforming Road Safety
- Doha a strategic location for EV manufacturing hub: IPA Qatar
- Demand for luxury TVs surging in the GCC, says Samsung
- Empowering Growth: The Thriving Journey of Bangladesh’s Cable Industry
- Demand for luxury TVs surging in the GCC, says Samsung
Latest Reports
- Nicaragua RPG Gaming Market (2026-2032)
- New Zealand RPG Gaming Market (2026-2032)
- Netherlands RPG Gaming Market (2026-2032)
- Nauru RPG Gaming Market (2026-2032)
- Namibia RPG Gaming Market (2026-2032)
- Mozambique RPG Gaming Market (2026-2032)
- Montenegro RPG Gaming Market (2026-2032)
- Mongolia RPG Gaming Market (2026-2032)
- Monaco RPG Gaming Market (2026-2032)
- Micronesia RPG Gaming Market (2026-2032)
Industry Events and Analyst Meet

HIMTEX 2026

India Refining Summit 2026

India EV Show 2026

EV tech India Expo 2026

Auto Tech Asia 2026
Whitepaper
- Middle East & Africa Commercial Security Market Click here to view more.
- Middle East & Africa Fire Safety Systems & Equipment Market Click here to view more.
- GCC Drone Market Click here to view more.
- Middle East Lighting Fixture Market Click here to view more.
- GCC Physical & Perimeter Security Market Click here to view more.