Myanmar industrial vehicles Market (2026-2032) | Analysis, Forecast, Share, Industry, Value, Size, Revenue, Growth, Companies, Outlook & Trends
Market Forecast By Product Type (Forklift, Aisle Truck, Tow Tractor, Container Handler), By Drive Type (Internal Combustion Engine, Battery-Operated, Gas-Powered), By Application (Industrial , Cargo) And Competitive Landscape
| Product Code: ETC029754 | Publication Date: Oct 2020 | Updated Date: Jun 2026 | Product Type: Report | |
| Publisher: 6Wresearch | Author: Ravi Bhandari | No. of Pages: 70 | No. of Figures: 35 | No. of Tables: 5 |
Myanmar industrial vehicles Market Summary
The myanmar industrial vehicles market was estimated at USD 132 Million in 2025 and is projected to reach USD 144 Million by 2032, growing at a CAGR of 1.1% from 2026 to 2032.
Myanmar industrial vehicles Market Growth Rate Analysis (2021-2032)
The Myanmar industrial vehicles market in the U.S. has experienced fluctuations in growth, characterized by a significant decline of 3.6% in 2021, likely driven by supply chain disruptions and reduced consumer demand amid geopolitical uncertainties. However, a rebound began in 2022 with a notable surge of 5.6%, as investments in infrastructure and energy transition initiatives gained momentum. This upward trend continued into 2023 and 2024 with growth rates of 5.3% and a slight 0.2%, respectively. Market activities are increasingly supported by digitalization and improved technology, fostering demand expansion. Looking ahead, growth is expected to stabilize, averaging around 1.5% to 2.4% per year through 2032, as the focus on sustainable practices solidifies.
Myanmar industrial vehicles Market Year-wise Growth Rate and Key Drivers
This graph highlights how the Myanmar industrial vehicles Market has steadily grown over the past five years, supported by major growth factors.
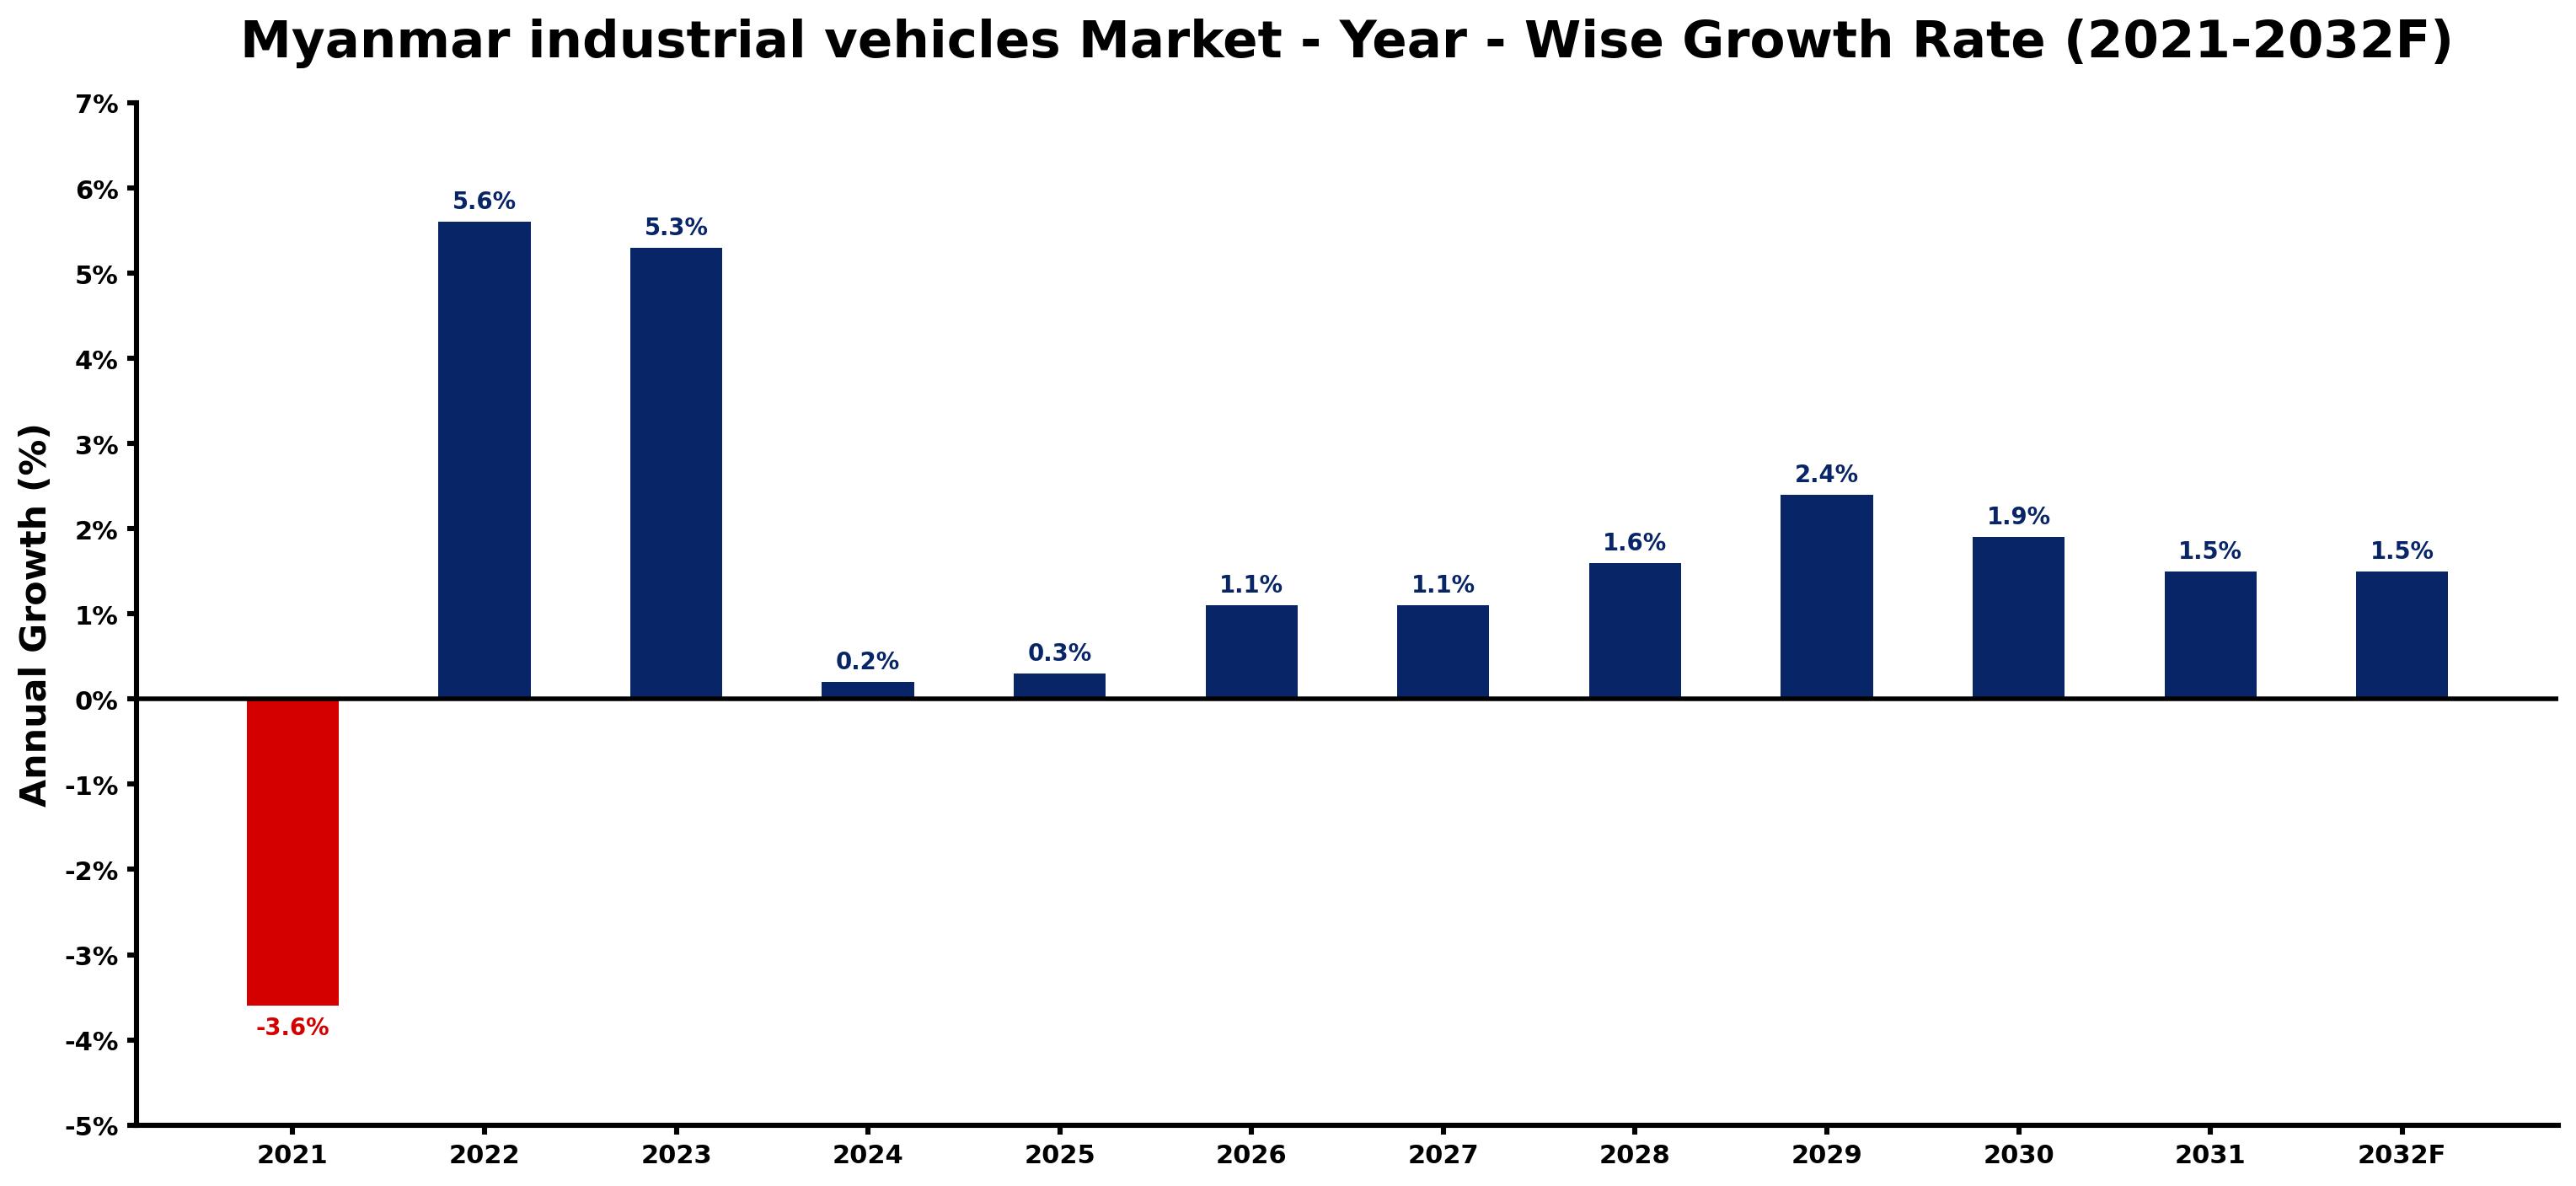
The table below presents the year wise growth rates along with the key drivers influencing the market
| Year | Growth Rate | Major Drivers |
| 2021 | -3.6% | Disruptions in supply chains and political instability hampered industrial vehicle production and delivery schedules. |
| 2022 | 5.6% | Foreign investments targeted industrial sectors, enhancing vehicle procurement and operational efficiency. |
| 2023 | 5.3% | Local assembly plants emerged, reducing costs and boosting the domestic vehicle market. |
| 2024 | 0.2% | Technological enhancements in hybrid vehicles attracted attention from logistics companies. |
| 2025 | 0.3% | Supply chain improvements facilitated faster delivery of industrial vehicles to key sectors. |
| 2026 | 1.1% | Rural electrification projects expanded, increasing demand for agricultural vehicles and equipment. |
| 2027 | 1.1% | Urbanization trends contributed to heightened needs for construction-related industrial vehicles. |
| 2028 | 1.6% | Demand for eco-friendly alternatives began reshaping the industrial vehicle landscape significantly. |
| 2029 | 2.4% | Partnerships between local manufacturers and overseas brands strengthened market competitiveness. |
| 2030 | 1.9% | Large-scale energy projects required robust vehicle fleets to support logistical demands. |
| 2031 | 1.5% | A focus on enhancing trade routes invigorated the industrial vehicle supply chain. |
| 2032 | 1.5% | Digital transformation initiatives in logistics provided new opportunities for vehicle integration. |
Note - Market size estimations and growth projections presented in this report are based on 6Wresearch's advanced forecasting approach, validated with industry datasets as of June 2026.
Myanmar industrial vehicles Market Synopsis
The Myanmar industrial vehicles Market is projected to reach 1.1% and witness significant growth during the forecast period (2026-2032). This market encompasses a diverse array of vehicles crucial for the manufacturing, construction, and logistics sectors. Vehicles such as forklifts, cranes, and loaders are fundamental to optimizing material handling, transportation, and workflow efficiencies across various industrial environments.
Myanmar industrial vehicles Market Growth Drivers
The demand for industrial vehicles in Myanmar is propelled by several dynamic factors:
- Expansion of the construction sector, driven by increasing infrastructure projects, is boosting the need for industrial vehicles.
- The logistics sector's growth, spurred by rising trade activities, necessitates advanced material handling solutions.
- Increased operational efficiency requirements among local enterprises are driving the adoption of modern industrial vehicles.
- The demand for vehicles equipped with smart technologies, such as telematics and automation, is on the rise.
- There is a notable shift towards environmentally friendly vehicles, enhancing the appeal of electric and hybrid options.
Myanmar industrial vehicles Market Challenges and Restraints
While the Myanmar industrial vehicles Market is experiencing growth, several challenges impede its full potential:
- The inadequate state of transportation infrastructure, including roads, limits the accessibility and utility of industrial vehicles in certain areas.
- Compliance with stringent safety and emission regulations is critical, requiring investments in upgrading existing fleets.
- The financial burden of acquiring advanced industrial vehicles can deter businesses from expanding their fleets.
- Limited access to financing options may hinder smaller enterprises from modernizing their operations.
- Market players must navigate the complexities of regulatory environments, which can vary significantly across regions.
Myanmar industrial vehicles Market Trends and Opportunities
The Myanmar industrial vehicles Market is characterized by emerging trends that present various opportunities for growth:
- The introduction of IoT-enabled devices within industrial vehicles is enhancing fleet management and operational insights.
- Increased focus on sustainability is prompting a shift toward electric vehicles, which are becoming increasingly popular in industrial applications.
- Technological advancements in automation are leading to the development of autonomous industrial vehicles, reshaping operational methodologies.
- Collaboration among local and international stakeholders is fostering knowledge transfer and access to advanced technologies.
- Government initiatives aimed at modernizing industrial infrastructure are creating a favorable environment for market expansion.
Myanmar industrial vehicles Market Regional Analysis
Geographically, the Myanmar industrial vehicles Market is influenced by regional economic activities:
- The urban areas, particularly those experiencing rapid industrialization, show higher demand for industrial vehicles compared to rural locations.
- Regions with ongoing infrastructure projects are likely to witness a surge in industrial vehicle adoption, particularly cranes and loaders.
- Logistics hubs, such as ports and distribution centers, are critical areas for the deployment of forklifts and material handling equipment.
- The government's focus on regional development is expected to enhance the connectivity and infrastructure necessary for efficient industrial vehicle utilization.
- Emerging markets within Myanmar are ripe for investment, presenting opportunities for businesses to cater to growing industrial demands.
Myanmar industrial vehicles Market Government Investment and Initiatives
The government of Myanmar has enacted various policies aimed at fostering the industrial vehicles Market:
- Regulatory frameworks have been established to ensure vehicle safety and emissions standards, promoting environmentally responsible practices.
- Incentives are being offered to manufacturers and companies for investing in electric or hybrid vehicles, aligning with global sustainability goals.
- Public spending on transportation infrastructure is set to improve road networks, facilitating better access for industrial vehicles.
- The government is actively collaborating with private sectors to enhance logistics capabilities, which is expected to positively influence the industrial vehicles Market.
- Investment in technology upgrades is encouraged, particularly in urban areas, to support more efficient operational practices within industries.
Myanmar industrial vehicles Market Latest Developments (May 2025 - June 2026)
Recent industry developments indicate a robust trajectory for the Myanmar industrial vehicles Market:
- There has been a noticeable increase in the adoption of electric industrial vehicles as companies respond to regulatory pressures and sustainability initiatives.
- Technological advancements are propelling automation in industrial vehicles, with new models featuring enhanced safety and efficiency technologies.
- Public-private partnerships are gaining traction, leading to improved infrastructure projects that support better logistics and vehicle deployment.
- Industry forums and conferences have facilitated knowledge sharing, promoting a collaborative approach to overcoming market challenges.
- Emerging startups are entering the market, focusing on innovative solutions for material handling and fleet management, further stimulating competition.
Myanmar industrial vehicles Market - Key Attractiveness of the Report
- 10 Years of Market Numbers
- Historical Data Starting from 2022 to 2025
- Base Year: 2025
- Forecast Data until 2032
- Key Performance Indicators Impacting the Market
- Major Upcoming Developments and Projects
Key Highlights of the Report:
- Myanmar industrial vehicles Market Outlook
- Market Size of Myanmar industrial vehicles Market, 2025
- Forecast of Myanmar industrial vehicles Market, 2032
- Historical Data and Forecast of Myanmar industrial vehicles Revenues & Volume for the Period 2022-2032F
- Myanmar industrial vehicles Market Trend Evolution
- Myanmar industrial vehicles Market Drivers and Challenges
- Myanmar industrial vehicles Price Trends
- Myanmar industrial vehicles Porter's Five Forces
- Myanmar industrial vehicles Industry Life Cycle
- Historical Data and Forecast of Myanmar industrial vehicles Market Revenues & Volume By Product Type for the Period 2022-2032F
- Historical Data and Forecast of Myanmar industrial vehicles Market Revenues & Volume By Forklift for the Period 2022-2032F
- Historical Data and Forecast of Myanmar industrial vehicles Market Revenues & Volume By Aisle Truck for the Period 2022-2032F
- Historical Data and Forecast of Myanmar industrial vehicles Market Revenues & Volume By Tow Tractor for the Period 2022-2032F
- Historical Data and Forecast of Myanmar industrial vehicles Market Revenues & Volume By Container Handler for the Period 2022-2032F
- Historical Data and Forecast of Myanmar industrial vehicles Market Revenues & Volume By Drive Type for the Period 2022-2032F
- Historical Data and Forecast of Myanmar industrial vehicles Market Revenues & Volume By Internal Combustion Engine for the Period 2022-2032F
- Historical Data and Forecast of Myanmar industrial vehicles Market Revenues & Volume By Battery-Operated for the Period 2022-2032F
- Historical Data and Forecast of Myanmar industrial vehicles Market Revenues & Volume By Gas-Powered for the Period 2022-2032F
- Historical Data and Forecast of Myanmar industrial vehicles Market Revenues & Volume By Application for the Period 2022-2032F
- Historical Data and Forecast of Myanmar industrial vehicles Market Revenues & Volume By Industrial for the Period 2022-2032F
- Historical Data and Forecast of Myanmar industrial vehicles Market Revenues & Volume By Cargo for the Period 2022-2032F
- Myanmar industrial vehicles Import Export Trade Statistics
- Market Opportunity Assessment By Product Type
- Market Opportunity Assessment By Drive Type
- Market Opportunity Assessment By Application
- Myanmar industrial vehicles Top Companies Market Share
- Myanmar industrial vehicles Competitive Benchmarking By Technical and Operational Parameters
- Myanmar industrial vehicles Company Profiles
- Myanmar industrial vehicles Key Strategic Recommendations
Frequently Asked Questions About the Market Study (FAQs):
The growth is primarily driven by the expansion of the construction and logistics sectors, increasing operational efficiency demands, and a shift towards environmentally friendly vehicles.
The market faces challenges related to infrastructure limitations, regulatory compliance issues, and access to financing for businesses looking to invest in new vehicles.
The government is implementing policies that include safety and emissions regulations, incentives for electric vehicle adoption, and investment in infrastructure improvements.
Emerging trends include the growing adoption of automated vehicles, the integration of IoT technologies, and an increasing focus on sustainability through the use of electric vehicles.
6Wresearch actively monitors the Myanmar industrial vehicles Market and publishes its comprehensive annual report, highlighting emerging trends, growth drivers, revenue analysis, and forecast outlook. Our insights help businesses to make data-backed strategic decisions with ongoing market dynamics. Our analysts track relevent industries related to the Myanmar industrial vehicles Market, allowing our clients with actionable intelligence and reliable forecasts tailored to emerging regional needs.
Yes, we provide customisation as per your requirements. To learn more, feel free to contact us on sales@6wresearch.com
1 Executive Summary |
2 Introduction |
2.1 Key Highlights of the Report |
2.2 Report Description |
2.3 Market Scope & Segmentation |
2.4 Research Methodology |
2.5 Assumptions |
3 Myanmar industrial vehicles Market Overview |
3.1 Myanmar Country Macro Economic Indicators |
3.2 Myanmar industrial vehicles Market Revenues & Volume, 2022 & 2032F |
3.3 Myanmar industrial vehicles Market - Industry Life Cycle |
3.4 Myanmar industrial vehicles Market - Porter's Five Forces |
3.5 Myanmar industrial vehicles Market Revenues & Volume Share, By Product Type, 2022 & 2032F |
3.6 Myanmar industrial vehicles Market Revenues & Volume Share, By Drive Type, 2022 & 2032F |
3.7 Myanmar industrial vehicles Market Revenues & Volume Share, By Application, 2022 & 2032F |
4 Myanmar industrial vehicles Market Dynamics |
4.1 Impact Analysis |
4.2 Market Drivers |
4.2.1 Growing industrialization and infrastructure development in Myanmar |
4.2.2 Increasing demand for efficient material handling solutions in industries |
4.2.3 Government initiatives to promote manufacturing and industrial sectors |
4.3 Market Restraints |
4.3.1 Lack of skilled labor for operating industrial vehicles |
4.3.2 High initial investment and maintenance costs of industrial vehicles |
4.3.3 Limited availability of spare parts and servicing facilities in certain regions |
5 Myanmar industrial vehicles Market Trends |
6 Myanmar industrial vehicles Market, By Types |
6.1 Myanmar industrial vehicles Market, By Product Type |
6.1.1 Overview and Analysis |
6.1.2 Myanmar industrial vehicles Market Revenues & Volume, By Product Type, 2022-2032F |
6.1.3 Myanmar industrial vehicles Market Revenues & Volume, By Forklift, 2022-2032F |
6.1.4 Myanmar industrial vehicles Market Revenues & Volume, By Aisle Truck, 2022-2032F |
6.1.5 Myanmar industrial vehicles Market Revenues & Volume, By Tow Tractor, 2022-2032F |
6.1.6 Myanmar industrial vehicles Market Revenues & Volume, By Container Handler, 2022-2032F |
6.2 Myanmar industrial vehicles Market, By Drive Type |
6.2.1 Overview and Analysis |
6.2.2 Myanmar industrial vehicles Market Revenues & Volume, By Internal Combustion Engine, 2022-2032F |
6.2.3 Myanmar industrial vehicles Market Revenues & Volume, By Battery-Operated, 2022-2032F |
6.2.4 Myanmar industrial vehicles Market Revenues & Volume, By Gas-Powered, 2022-2032F |
6.3 Myanmar industrial vehicles Market, By Application |
6.3.1 Overview and Analysis |
6.3.2 Myanmar industrial vehicles Market Revenues & Volume, By Industrial , 2022-2032F |
6.3.3 Myanmar industrial vehicles Market Revenues & Volume, By Cargo, 2022-2032F |
7 Myanmar industrial vehicles Market Import-Export Trade Statistics |
7.1 Myanmar industrial vehicles Market Export to Major Countries |
7.2 Myanmar industrial vehicles Market Imports from Major Countries |
8 Myanmar industrial vehicles Market Key Performance Indicators |
8.1 Average age of industrial vehicles in operation |
8.2 Adoption rate of advanced technology in industrial vehicles |
8.3 Utilization rate of industrial vehicles in key industries |
9 Myanmar industrial vehicles Market - Opportunity Assessment |
9.1 Myanmar industrial vehicles Market Opportunity Assessment, By Product Type, 2022 & 2032F |
9.2 Myanmar industrial vehicles Market Opportunity Assessment, By Drive Type, 2022 & 2032F |
9.3 Myanmar industrial vehicles Market Opportunity Assessment, By Application, 2022 & 2032F |
10 Myanmar industrial vehicles Market - Competitive Landscape |
10.1 Myanmar industrial vehicles Market Revenue Share, By Companies, 2025 |
10.2 Myanmar industrial vehicles Market Competitive Benchmarking, By Operating and Technical Parameters |
11 Company Profiles |
12 Recommendations |
13 Disclaimer |
Global Go To Market Strategy - 2030
Export potential enables firms to identify high-growth global markets with greater confidence by combining advanced trade intelligence with a structured quantitative methodology. The framework analyzes emerging demand trends and country-level import patterns while integrating macroeconomic and trade datasets such as GDP and population forecasts, bilateral import–export flows, tariff structures, elasticity differentials between developed and developing economies, geographic distance, and import demand projections. Using weighted trade values from 2020–2024 as the base period to project country-to-country export potential for 2030, these inputs are operationalized through calculated drivers such as gravity model parameters, tariff impact factors, and projected GDP per-capita growth. Through an analysis of hidden potentials, demand hotspots, and market conditions that are most favorable to success, this method enables firms to focus on target countries, maximize returns, and global expansion with data, backed by accuracy.
By factoring in the projected importer demand gap that is currently unmet and could be potential opportunity, it identifies the potential for the Exporter (Country) among 190 countries, against the general trade analysis, which identifies the biggest importer or exporter.
To discover high-growth global markets and optimize your business strategy:
Click Here
Pricing
- Single User License$ 1,995
- Department License$ 2,400
- Site License$ 3,120
- Global License$ 3,795

Leadership Perspectives from Industry Events
Search
Thought Leadership and Analyst Meet


Our Clients
6WResearch In News
- India Air Conditioner Market Set for Strong Rebound in 2026 After Weather-Led Correction and GST-Driven Recovery: 6Wresearch
- ADAS in India: How Automatic Emergency Braking, Blind Spot Detection & Driver Monitoring are Transforming Road Safety
- Doha a strategic location for EV manufacturing hub: IPA Qatar
- Demand for luxury TVs surging in the GCC, says Samsung
- Empowering Growth: The Thriving Journey of Bangladesh’s Cable Industry
- Demand for luxury TVs surging in the GCC, says Samsung
Latest Reports
- Nicaragua RPG Gaming Market (2026-2032)
- New Zealand RPG Gaming Market (2026-2032)
- Netherlands RPG Gaming Market (2026-2032)
- Nauru RPG Gaming Market (2026-2032)
- Namibia RPG Gaming Market (2026-2032)
- Mozambique RPG Gaming Market (2026-2032)
- Montenegro RPG Gaming Market (2026-2032)
- Mongolia RPG Gaming Market (2026-2032)
- Monaco RPG Gaming Market (2026-2032)
- Micronesia RPG Gaming Market (2026-2032)
Industry Events and Analyst Meet

HIMTEX 2026

India Refining Summit 2026

India EV Show 2026

EV tech India Expo 2026

Auto Tech Asia 2026
Whitepaper
- Middle East & Africa Commercial Security Market Click here to view more.
- Middle East & Africa Fire Safety Systems & Equipment Market Click here to view more.
- GCC Drone Market Click here to view more.
- Middle East Lighting Fixture Market Click here to view more.
- GCC Physical & Perimeter Security Market Click here to view more.