Myanmar Inorganic salts Market (2026-2032) Outlook | Share, Companies, Analysis, Revenue, Growth, Forecast, Trends, Industry, Value & Size
Market Forecast By Application (Chemicals, Food Industry, Pharmaceuticals and Personal Care, Agriculture, Others) And Competitive Landscape
| Product Code: ETC415050 | Publication Date: Oct 2022 | Updated Date: Jul 2026 | Product Type: Market Research Report | |
| Publisher: 6Wresearch | Author: Sumit Sagar | No. of Pages: 75 | No. of Figures: 35 | No. of Tables: 20 |
Myanmar Inorganic salts Market Size, Share & Growth Rate
The Myanmar Inorganic salts Market was estimated at USD 338 Million in 2025 and is projected to reach USD 455 Million by 2032, growing at a CAGR of 4.3% from 2026 to 2032. This growth trajectory is primarily fueled by escalating industrial activities across various sectors, particularly agriculture and pharmaceuticals. As Myanmar's economy continues to diversify, the versatile applications of inorganic salts are increasingly recognized, thereby enhancing their demand.
Myanmar Inorganic salts Market Growth Rate Analysis (2021-2032)
The Myanmar inorganic salts market has exhibited stable growth, with rates fluctuating between 4.8% and 5.4% from 2021 to 2032. Driven by increasing industrial demand, particularly in agriculture and construction, the market expanded by 4.9% in 2021, followed by a slight uptick to 5.4% in 2022 as infrastructural developments gained momentum. This expansion has cooled slightly, with growth projected at 4.9% in 2023 and stabilizing around 5.1% through 2032. The ongoing energy transition and investments in technological advancements have bolstered production capacity. Additionally, rising consumer demand for sustainable materials is expected to further support growth, particularly as Myanmar enhances its digital and logistical infrastructures.
Myanmar Inorganic salts Market Year-wise Growth Rate and Key Drivers
This graph highlights how the Myanmar Inorganic salts Market has steadily grown over the past five years, supported by major growth factors.
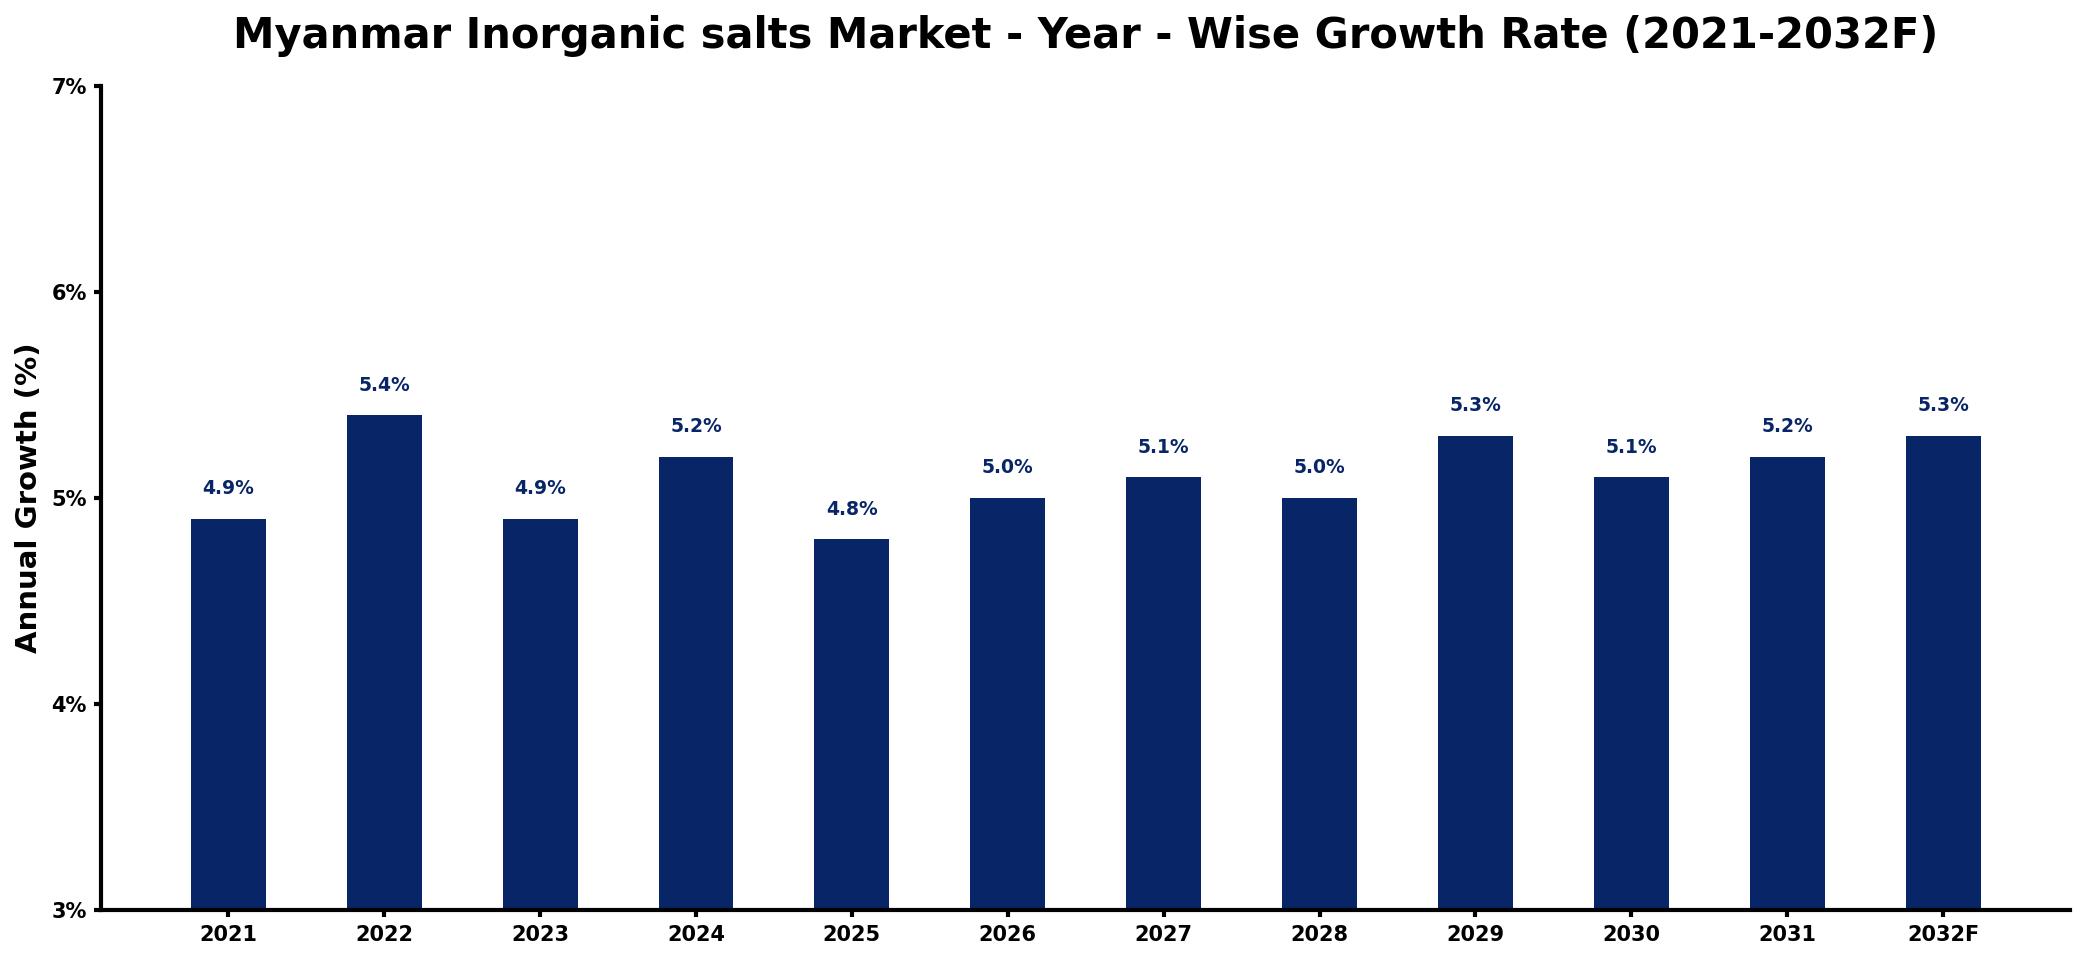
The table below presents the year‑wise growth rates along with the key drivers influencing the market
| Year | Growth Rate | Major Drivers |
| 2021 | 4.9% | Increased agricultural sector investments |
| 2022 | 5.4% | Growing demand from construction industry |
| 2023 | 4.9% | Expansion in food processing applications |
| 2024 | 5.2% | Rising need for wastewater treatment |
| 2025 | 4.8% | Boost in chemical manufacturing activities |
| 2026 | 5.0% | Enhanced research and development funding |
| 2027 | 5.1% | Higher consumer awareness initiatives |
| 2028 | 5.0% | Development of new industrial applications |
| 2029 | 5.3% | Strengthened export market opportunities |
| 2030 | 5.1% | Advancements in energy production technologies |
| 2031 | 5.2% | Surge in livestock farming practices |
| 2032 | 5.3% | Increased focus on sustainable practices |
Note: Market size estimations and growth projections presented in this report are based on 6Wresearch's proprietary forecasting methodology, utilizing the latest available industry data, government publications, and primary research inputs.
Myanmar Inorganic salts Market Synopsis
Currently, the Myanmar inorganic salts market is undergoing a phase of steady growth, driven by robust industrial applications ranging from food processing to water treatment. The demand for essential inorganic salts such as sodium chloride and calcium carbonate is particularly notable, as they play crucial roles in various manufacturing processes.
Furthermore, strategic partnerships and product innovations are emerging as focal points among market participants, aiming to enhance their competitive edge. As domestic production ramps up, there is a growing awareness of the benefits of inorganic salts, setting the stage for an expansive market evolution.
Myanmar Inorganic salts Market Key Takeaways
- The market is experiencing steady growth, driven by increasing industrial activities in agriculture and pharmaceuticals.
- Rising demand for specialty inorganic salts for niche applications is shaping market dynamics.
- Technological advancements are enhancing production processes and efficiency.
- Despite challenges, the market presents attractive opportunities for investors focusing on sustainable practices.
- Infrastructure development and government policies are influencing market growth prospects.
Evaluation of Restraints in Myanmar Inorganic salts Market
The Myanmar inorganic salts market faces several real challenges that may hinder its growth. A significant issue is the limited awareness among consumers and businesses regarding the benefits and applications of inorganic salts. Furthermore, the market struggles with inconsistent quality standards and a lack of modern manufacturing facilities, leading to reliance on imports for certain products. Bureaucratic hurdles and inadequate infrastructure also create a challenging landscape for market expansion, necessitating collaborative efforts from various stakeholders to overcome these limitations.
Myanmar Inorganic salts Market Trends
Key trends influencing the Myanmar inorganic salts market include a heightened demand for sustainable and eco-friendly production methods. Manufacturers are increasingly focusing on specialty inorganic salts that cater to niche applications, such as water treatment and electronics manufacturing. Additionally, the shift towards digitalization and automation within manufacturing processes is driving efficiency and productivity, further shaping the future landscape of the market.
Myanmar Inorganic salts Market Opportunities
Investment opportunities in the Myanmar inorganic salts market abound, particularly within the agriculture, chemicals, and construction sectors. The growing demand for fertilizers is prompting interest in products such as potassium chloride and ammonium sulfate. Additionally, the emphasis on food security opens avenues for specialty salts designed for crop nutrition. The ongoing industrialization and infrastructure development initiatives signal a fertile ground for investors seeking long-term growth within this evolving market.
Government Initiatives in the Myanmar Inorganic salts Market
While there are no specific government policies directly addressing the inorganic salts market, general trade policies significantly influence the landscape. Myanmars liberalized trade policies facilitate the import and export of inorganic salts, fostering a more competitive market environment. Compliance with customs regulations and business requirements established by the government is essential for companies operating in this space. Overall, while regulatory frameworks remain broad, their impact on market dynamics is considerable.
Future Insights of the Myanmar Inorganic salts Market
Looking ahead to 2026-2032, the Myanmar inorganic salts market is positioned for promising growth, propelled by the ongoing expansion of industrial activities and infrastructure development. As awareness of inorganic salts benefits continues to rise, and with technological advancements in production processes, the market is set to evolve. Challenges such as fluctuating raw material prices will need addressing; however, with a focus on sustainability and efficiency, the future for this sector remains bright.
Myanmar Inorganic salts Market Latest Developments (2025 - 2026)
Recent industry developments indicate a growing interest in the production of specialty inorganic salts tailored for niche markets such as water treatment and agriculture. As local manufacturing capabilities improve, companies are increasingly investing in innovative technologies and sustainable practices. Moreover, infrastructure enhancements aimed at improving supply chains are underway, which is expected to bolster market growth and streamline distribution channels.
Myanmar Inorganic salts Market - Key Attractiveness of the Report
- 10 Years of Market Numbers
- Historical Data Starting from 2022 to 2025
- Base Year: 2025
- Forecast Data until 2032
- Key Performance Indicators Impacting the Market
- Major Upcoming Developments and Projects
Key Highlights of the Report:
- Myanmar Inorganic salts Market Outlook
- Market Size of Myanmar Inorganic salts Market, 2025
- Forecast of Myanmar Inorganic salts Market, 2032
- Historical Data and Forecast of Myanmar Inorganic salts Revenues & Volume for the Period 2022-2032F
- Myanmar Inorganic salts Market Trend Evolution
- Myanmar Inorganic salts Market Drivers and Challenges
- Myanmar Inorganic salts Price Trends
- Myanmar Inorganic salts Porter's Five Forces
- Myanmar Inorganic salts Industry Life Cycle
- Historical Data and Forecast of Myanmar Inorganic salts Market Revenues & Volume By Application for the Period 2022-2032F
- Historical Data and Forecast of Myanmar Inorganic salts Market Revenues & Volume By Chemicals for the Period 2022-2032F
- Historical Data and Forecast of Myanmar Inorganic salts Market Revenues & Volume By Food Industry for the Period 2022-2032F
- Historical Data and Forecast of Myanmar Inorganic salts Market Revenues & Volume By Pharmaceuticals and Personal Care for the Period 2022-2032F
- Historical Data and Forecast of Myanmar Inorganic salts Market Revenues & Volume By Agriculture for the Period 2022-2032F
- Historical Data and Forecast of Myanmar Inorganic salts Market Revenues & Volume By Others for the Period 2022-2032F
- Myanmar Inorganic salts Import Export Trade Statistics
- Market Opportunity Assessment By Application
- Myanmar Inorganic salts Top Companies Market Share
- Myanmar Inorganic salts Competitive Benchmarking By Technical and Operational Parameters
- Myanmar Inorganic salts Company Profiles
- Myanmar Inorganic salts Key Strategic Recommendations
Frequently Asked Questions About the Market Study (FAQs):
The growth is largely driven by increasing industrial activities in sectors such as agriculture, pharmaceuticals, and chemicals, where inorganic salts play vital roles.
The Myanmar inorganic salts market was estimated at USD 338 Million in 2025 and is projected to reach USD 455 Million by 2032, growing at a CAGR of 4.3% from 2026 to 2032.
Yes, demand is particularly strong in food processing, water treatment, and the agricultural sector, where they are essential for crop nutrition.
Key challenges include limited consumer awareness, inconsistent quality standards, and inadequate infrastructure that may hinder growth opportunities.
Many manufacturers are increasingly adopting sustainable production processes and developing eco-friendly products to align with evolving regulations and consumer preferences.
The market offers promising investment opportunities particularly in fertilizers, specialty inorganic salts for agriculture, and construction-related applications, presenting long-term growth prospects.
6Wresearch actively monitors the Myanmar Inorganic salts Market and publishes its comprehensive annual report, highlighting emerging trends, growth drivers, revenue analysis, and forecast outlook. Our insights help businesses to make data-backed strategic decisions with ongoing market dynamics. Our analysts track relevent industries related to the Myanmar Inorganic salts Market, allowing our clients with actionable intelligence and reliable forecasts tailored to emerging regional needs.
Yes, we provide customisation as per your requirements. To learn more, feel free to contact us on sales@6wresearch.com
1 Executive Summary |
2 Introduction |
2.1 Key Highlights of the Report |
2.2 Report Description |
2.3 Market Scope & Segmentation |
2.4 Research Methodology |
2.5 Assumptions |
3 Myanmar Inorganic salts Market Overview |
3.1 Myanmar Country Macro Economic Indicators |
3.2 Myanmar Inorganic salts Market Revenues & Volume, 2022 & 2032F |
3.3 Myanmar Inorganic salts Market - Industry Life Cycle |
3.4 Myanmar Inorganic salts Market - Porter's Five Forces |
3.5 Myanmar Inorganic salts Market Revenues & Volume Share, By Application, 2022 & 2032F |
4 Myanmar Inorganic salts Market Dynamics |
4.1 Impact Analysis |
4.2 Market Drivers |
4.2.1 Increasing demand from industries such as agriculture, pharmaceuticals, and chemicals. |
4.2.2 Growth in population leading to higher consumption of inorganic salts for various applications. |
4.2.3 Rising investments in infrastructure development and construction projects in Myanmar. |
4.3 Market Restraints |
4.3.1 Fluctuating prices of raw materials impacting the production cost of inorganic salts. |
4.3.2 Lack of advanced technology and infrastructure for efficient production and distribution. |
4.3.3 Environmental regulations and concerns regarding the use and disposal of inorganic salts. |
5 Myanmar Inorganic salts Market Trends |
6 Myanmar Inorganic salts Market, By Types |
6.1 Myanmar Inorganic salts Market, By Application |
6.1.1 Overview and Analysis |
6.1.2 Myanmar Inorganic salts Market Revenues & Volume, By Application, 2022-2032F |
6.1.3 Myanmar Inorganic salts Market Revenues & Volume, By Chemicals, 2022-2032F |
6.1.4 Myanmar Inorganic salts Market Revenues & Volume, By Food Industry, 2022-2032F |
6.1.5 Myanmar Inorganic salts Market Revenues & Volume, By Pharmaceuticals and Personal Care, 2022-2032F |
6.1.6 Myanmar Inorganic salts Market Revenues & Volume, By Agriculture, 2022-2032F |
6.1.7 Myanmar Inorganic salts Market Revenues & Volume, By Others, 2022-2032F |
7 Myanmar Inorganic salts Market Import-Export Trade Statistics |
7.1 Myanmar Inorganic salts Market Export to Major Countries |
7.2 Myanmar Inorganic salts Market Imports from Major Countries |
8 Myanmar Inorganic salts Market Key Performance Indicators |
8.1 Production capacity utilization rate. |
8.2 Number of new product developments or innovations in the inorganic salts market. |
8.3 Percentage of market penetration in key industry sectors. |
9 Myanmar Inorganic salts Market - Opportunity Assessment |
9.1 Myanmar Inorganic salts Market Opportunity Assessment, By Application, 2022 & 2032F |
10 Myanmar Inorganic salts Market - Competitive Landscape |
10.1 Myanmar Inorganic salts Market Revenue Share, By Companies, 2025 |
10.2 Myanmar Inorganic salts Market Competitive Benchmarking, By Operating and Technical Parameters |
11 Company Profiles |
12 Recommendations |
13 Disclaimer |
Global Go To Market Strategy - 2030
Export potential enables firms to identify high-growth global markets with greater confidence by combining advanced trade intelligence with a structured quantitative methodology. The framework analyzes emerging demand trends and country-level import patterns while integrating macroeconomic and trade datasets such as GDP and population forecasts, bilateral import–export flows, tariff structures, elasticity differentials between developed and developing economies, geographic distance, and import demand projections. Using weighted trade values from 2020–2024 as the base period to project country-to-country export potential for 2030, these inputs are operationalized through calculated drivers such as gravity model parameters, tariff impact factors, and projected GDP per-capita growth. Through an analysis of hidden potentials, demand hotspots, and market conditions that are most favorable to success, this method enables firms to focus on target countries, maximize returns, and global expansion with data, backed by accuracy.
By factoring in the projected importer demand gap that is currently unmet and could be potential opportunity, it identifies the potential for the Exporter (Country) among 190 countries, against the general trade analysis, which identifies the biggest importer or exporter.
To discover high-growth global markets and optimize your business strategy:
Click Here
Pricing
- Single User License$ 1,995
- Department License$ 2,400
- Site License$ 3,120
- Global License$ 3,795

Leadership Perspectives from Industry Events
Search
Thought Leadership and Analyst Meet


Our Clients
6WResearch In News
- India Air Conditioner Market Set for Strong Rebound in 2026 After Weather-Led Correction and GST-Driven Recovery: 6Wresearch
- ADAS in India: How Automatic Emergency Braking, Blind Spot Detection & Driver Monitoring are Transforming Road Safety
- Doha a strategic location for EV manufacturing hub: IPA Qatar
- Demand for luxury TVs surging in the GCC, says Samsung
- Empowering Growth: The Thriving Journey of Bangladesh’s Cable Industry
- Demand for luxury TVs surging in the GCC, says Samsung
Latest Reports
- Nicaragua RPG Gaming Market (2026-2032)
- New Zealand RPG Gaming Market (2026-2032)
- Netherlands RPG Gaming Market (2026-2032)
- Nauru RPG Gaming Market (2026-2032)
- Namibia RPG Gaming Market (2026-2032)
- Mozambique RPG Gaming Market (2026-2032)
- Montenegro RPG Gaming Market (2026-2032)
- Mongolia RPG Gaming Market (2026-2032)
- Monaco RPG Gaming Market (2026-2032)
- Micronesia RPG Gaming Market (2026-2032)
Industry Events and Analyst Meet

HIMTEX 2026

India Refining Summit 2026

India EV Show 2026

EV tech India Expo 2026

Auto Tech Asia 2026
Whitepaper
- Middle East & Africa Commercial Security Market Click here to view more.
- Middle East & Africa Fire Safety Systems & Equipment Market Click here to view more.
- GCC Drone Market Click here to view more.
- Middle East Lighting Fixture Market Click here to view more.
- GCC Physical & Perimeter Security Market Click here to view more.