Myanmar Metal Packaging Market (2026-2032) | Size, Revenue, Outlook, Analysis, Companies, Growth, Industry, Trends, Forecast, Share & Value
Market Forecast By Material (Steel, Aluminum, Others), By Product Type (Cans, Caps & Closures, Drums & Barrels, Others), By End User (Food, Beverage, Personal Care, Healthcare, Others) And Competitive Landscape
| Product Code: ETC028374 | Publication Date: Oct 2020 | Updated Date: Jun 2026 | Product Type: Report | |
| Publisher: 6Wresearch | Author: Ravi Bhandari | No. of Pages: 70 | No. of Figures: 35 | No. of Tables: 5 |
Myanmar Metal Packaging Market Summary
The myanmar metal packaging market was estimated at USD 286 Million in 2025 and is projected to reach USD 387 Million by 2032, growing at a CAGR of 5.0% from 2026 to 2032.
Myanmar Metal Packaging Market Growth Rate Analysis (2021-2032)
The Myanmar metal packaging market has showcased a stable growth pattern, achieving a notable 5.2% growth in both 2021 and 2022. This momentum continued into 2023 with a slight uptick to 5.3%, driven largely by increased consumer demand in the food and beverage sector, which has been buoyed by rising disposable incomes and urbanization. While growth is projected to moderate slightly to 5.1% in 2024, it is expected to regain momentum with 5.5% in 2025. Factors such as advancements in packaging technology and a shift towards more sustainable solutions will likely sustain long-term investments. However, a slight decline to 4.9% is anticipated by 2031, possibly reflecting increasing competition and market saturation challenges.
Myanmar Metal Packaging Market Year-wise Growth Rate and Key Drivers
This graph highlights how the Myanmar Metal Packaging Market has steadily grown over the past five years, supported by major growth factors.
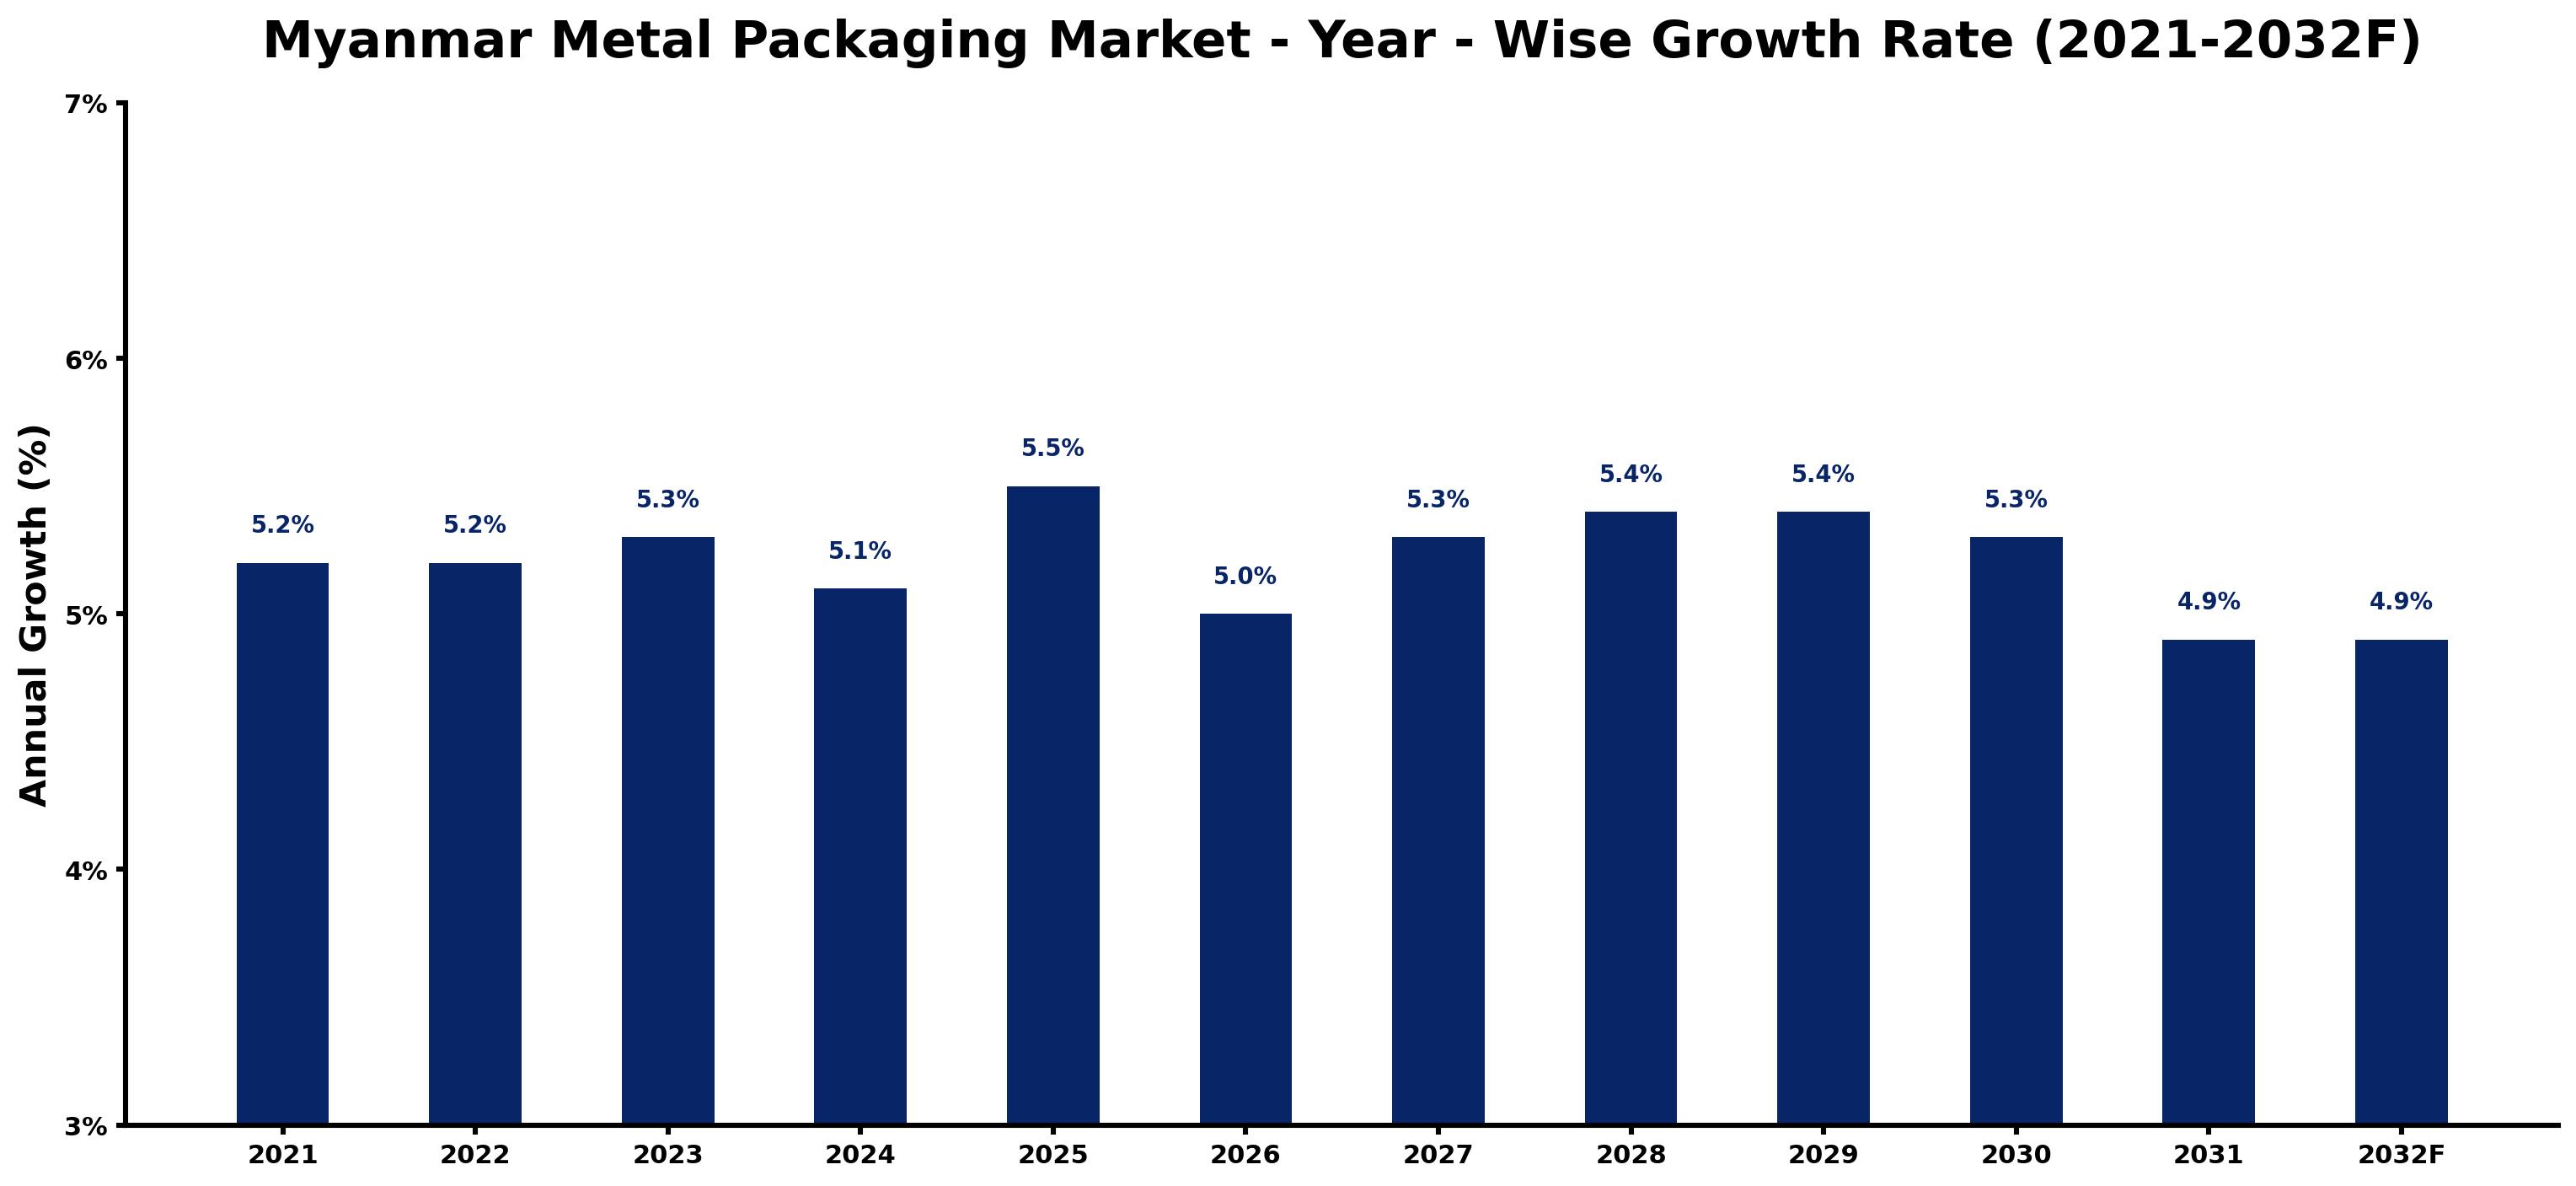
The table below presents the year wise growth rates along with the key drivers influencing the market
| Year | Growth Rate | Major Drivers |
| 2021 | 5.2% | Manufacturers explore sustainable materials to align with global environmental standards. |
| 2022 | 5.2% | E-commerce growth spurs need for efficient, lightweight packaging solutions in urban areas. |
| 2023 | 5.3% | Rising consumer preferences for convenience influence packaging design and functionality expectations. |
| 2024 | 5.1% | Local production facilities emerge, reducing reliance on imported packaging materials significantly. |
| 2025 | 5.5% | Food and beverage sector expansion increases demand for innovative metal packaging solutions. |
| 2026 | 5.0% | Investment in recycling technologies enhances sustainability initiatives across the packaging industry. |
| 2027 | 5.3% | Urbanization trends lead to heightened competition among packaging companies for market share. |
| 2028 | 5.4% | Technological advancements enable enhanced customization options for metal packaging products. |
| 2029 | 5.4% | Collaboration among local brands fosters a culture of innovation within the packaging sector. |
| 2030 | 5.3% | Export opportunities in ASEAN markets encourage manufacturers to upscale production capabilities. |
| 2031 | 4.9% | Consumer health consciousness drives demand for safer, non-toxic packaging materials. |
| 2032 | 4.9% | Market players emphasize circular economy practices, transforming industry competitive landscapes. |
Note - Market size estimations and growth projections presented in this report are based on 6Wresearch's advanced forecasting approach, validated with industry datasets as of June 2026.
Myanmar Metal Packaging Market Synopsis
The Myanmar Metal Packaging Market is projected to reach 5.0% and witness significant growth during the forecast period (2026-2032). This growth is underpinned by an increasing demand for sustainable and durable packaging solutions across a variety of consumer goods, particularly in the food and beverage sector. As manufacturers seek reliable options that extend product shelf life while adhering to environmental regulations, metal packaging is emerging as the preferred choice in the region.
Myanmar Metal Packaging Market Growth Drivers
The expansion of the Myanmar metal packaging market is being driven by several pivotal factors. Firstly, the rising consumption of packaged food and beverages is significantly contributing to the heightened demand for metal packaging solutions. As urbanization accelerates in Myanmar, the lifestyle changes are leading consumers to opt for convenient, ready-to-eat options, thereby increasing the use of metal containers.
- The surge in health consciousness among consumers is prompting manufacturers to utilize metal packaging, which is perceived as safer and more hygienic compared to other materials.
- Technological advancements in metal packaging are facilitating innovations such as easy-open lids and enhanced aesthetic designs, further appealing to consumers and encouraging use.
- The recyclability of metal packaging aligns with growing environmental awareness, making it a favorable option for both manufacturers and environmentally conscious consumers.
- Stringent regulations on food safety and packaging quality are pushing manufacturers towards adopting metal packaging to comply with national and international standards.
- The growth of the e-commerce sector in Myanmar also propels the demand for durable packaging solutions that can withstand transportation, making metal a viable choice.
Myanmar Metal Packaging Market Challenges and Restraints
Despite the positive outlook, the Myanmar metal packaging market is facing several challenges that could impede its growth. A critical issue is the limited local production capabilities, which often necessitates reliance on imported materials and components, resulting in increased costs and supply chain vulnerabilities.
- The competition from alternative packaging materials, such as plastics and glass, poses a significant threat, as these options may offer similar protective qualities at a lower price point.
- Strict environmental regulations concerning waste management and recycling are imposing additional compliance burdens on manufacturers, potentially impacting profitability.
- Economic fluctuations can lead to inconsistencies in demand, particularly from key sectors such as food and beverage, which complicates production planning for metal packaging.
- Investment in advanced manufacturing technologies is essential for competitiveness but can be cost-prohibitive for smaller companies in Myanmar.
- Consumer price sensitivity in a developing market like Myanmar may deter widespread adoption of metal packaging, especially when cheaper alternatives are available.
Myanmar Metal Packaging Market Government Investment and Initiatives
The Myanmar government is actively promoting the metal packaging sector as part of its broader strategy to enhance product quality and sustainability in the manufacturing sector. Policies have been enacted to support the adoption of metal packaging, emphasizing the importance of reducing waste and improving product shelf life.
- Initiatives focused on improving local manufacturing capabilities are underway, which aim to reduce dependence on imported materials and enhance supply chain stability.
- Regulations that set quality standards for packaging materials are helping to fortify the metal packaging industry by ensuring that companies adhere to both health and environmental benchmarks.
- Public spending is being directed towards recycling and waste management programs that encourage the use of recyclable packaging solutions, establishing a circular economy within the sector.
- The government has also been incentivizing research and development in packaging technologies, fostering innovation that can lead to better product offerings in the market.
- Collaborations between public and private sectors are being encouraged, aiming to create an ecosystem that supports sustainable practices in metal packaging.
Myanmar Metal Packaging Market Latest Developments (May 2025 - June 2026)
In the period between May 2025 and June 2026, the Myanmar metal packaging market has seen notable developments, driven by both local demand and international trends. There has been a marked increase in the introduction of innovative packaging solutions that cater to the growing consumer preference for convenience and sustainability.
- Advancements in manufacturing processes have led to the introduction of lighter and more efficient metal packaging options, which not only reduce material usage but also decrease transportation costs.
- Market players have increasingly focused on enhancing the aesthetic appeal of metal packaging through improved printing technologies, which has proven effective in attracting environmentally-conscious consumers.
- Environmental policies have begun to shape the industry, with more companies committing to sustainable practices by investing in recycling programs and eco-friendly manufacturing techniques.
- The effects of global economic conditions have spurred local manufacturers to adopt more resilient supply chain strategies to mitigate risks associated with material imports.
- Consumer education campaigns advocating for the benefits of using metal packaging in terms of safety and sustainability have gained momentum, contributing to a positive perception of the material.
Myanmar Metal Packaging Market - Key Attractiveness of the Report
- 10 Years of Market Numbers
- Historical Data Starting from 2022 to 2025
- Base Year: 2025
- Forecast Data until 2032
- Key Performance Indicators Impacting the Market
- Major Upcoming Developments and Projects
Key Highlights of the Report:
- Myanmar Metal Packaging Market Outlook
- Market Size of Myanmar Metal Packaging Market, 2025
- Forecast of Myanmar Metal Packaging Market, 2032
- Historical Data and Forecast of Myanmar Metal Packaging Revenues & Volume for the Period 2022-2032F
- Myanmar Metal Packaging Market Trend Evolution
- Myanmar Metal Packaging Market Drivers and Challenges
- Myanmar Metal Packaging Price Trends
- Myanmar Metal Packaging Porter's Five Forces
- Myanmar Metal Packaging Industry Life Cycle
- Historical Data and Forecast of Myanmar Metal Packaging Market Revenues & Volume By Material for the Period 2022-2032F
- Historical Data and Forecast of Myanmar Metal Packaging Market Revenues & Volume By Steel for the Period 2022-2032F
- Historical Data and Forecast of Myanmar Metal Packaging Market Revenues & Volume By Aluminum for the Period 2022-2032F
- Historical Data and Forecast of Myanmar Metal Packaging Market Revenues & Volume By Others for the Period 2022-2032F
- Historical Data and Forecast of Myanmar Metal Packaging Market Revenues & Volume By Product Type for the Period 2022-2032F
- Historical Data and Forecast of Myanmar Metal Packaging Market Revenues & Volume By Cans for the Period 2022-2032F
- Historical Data and Forecast of Myanmar Metal Packaging Market Revenues & Volume By Caps & Closures for the Period 2022-2032F
- Historical Data and Forecast of Myanmar Metal Packaging Market Revenues & Volume By Drums & Barrels for the Period 2022-2032F
- Historical Data and Forecast of Myanmar Metal Packaging Market Revenues & Volume By Others for the Period 2022-2032F
- Historical Data and Forecast of Myanmar Metal Packaging Market Revenues & Volume By End User for the Period 2022-2032F
- Historical Data and Forecast of Myanmar Metal Packaging Market Revenues & Volume By Food for the Period 2022-2032F
- Historical Data and Forecast of Myanmar Metal Packaging Market Revenues & Volume By Beverage for the Period 2022-2032F
- Historical Data and Forecast of Myanmar Metal Packaging Market Revenues & Volume By Personal Care for the Period 2022-2032F
- Historical Data and Forecast of Myanmar Metal Packaging Market Revenues & Volume By Healthcare for the Period 2022-2032F
- Historical Data and Forecast of Myanmar Metal Packaging Market Revenues & Volume By Others for the Period 2022-2032F
- Myanmar Metal Packaging Import Export Trade Statistics
- Market Opportunity Assessment By Material
- Market Opportunity Assessment By Product Type
- Market Opportunity Assessment By End User
- Myanmar Metal Packaging Top Companies Market Share
- Myanmar Metal Packaging Competitive Benchmarking By Technical and Operational Parameters
- Myanmar Metal Packaging Company Profiles
- Myanmar Metal Packaging Key Strategic Recommendations
Frequently Asked Questions About the Market Study (FAQs):
The growth of the Myanmar Metal Packaging Market is primarily driven by the rising demand for durable and sustainable packaging solutions in the food, beverage, pharmaceuticals, and personal care sectors.
The government is promoting the use of metal packaging through quality standards, environmental regulations, and initiatives aimed at supporting local manufacturing and recycling.
Key challenges include limited local production capabilities, reliance on imports, economic fluctuations, and competition from alternative packaging materials.
Innovations such as easy-open lids, improved printing capabilities, and lighter materials are being introduced to enhance product appeal and convenience in the metal packaging sector.
6Wresearch actively monitors the Myanmar Metal Packaging Market and publishes its comprehensive annual report, highlighting emerging trends, growth drivers, revenue analysis, and forecast outlook. Our insights help businesses to make data-backed strategic decisions with ongoing market dynamics. Our analysts track relevent industries related to the Myanmar Metal Packaging Market, allowing our clients with actionable intelligence and reliable forecasts tailored to emerging regional needs.
Yes, we provide customisation as per your requirements. To learn more, feel free to contact us on sales@6wresearch.com
1 Executive Summary |
2 Introduction |
2.1 Key Highlights of the Report |
2.2 Report Description |
2.3 Market Scope & Segmentation |
2.4 Research Methodology |
2.5 Assumptions |
3 Myanmar Metal Packaging Market Overview |
3.1 Myanmar Country Macro Economic Indicators |
3.2 Myanmar Metal Packaging Market Revenues & Volume, 2022 & 2032F |
3.3 Myanmar Metal Packaging Market - Industry Life Cycle |
3.4 Myanmar Metal Packaging Market - Porter's Five Forces |
3.5 Myanmar Metal Packaging Market Revenues & Volume Share, By Material, 2022 & 2032F |
3.6 Myanmar Metal Packaging Market Revenues & Volume Share, By Product Type, 2022 & 2032F |
3.7 Myanmar Metal Packaging Market Revenues & Volume Share, By End User, 2022 & 2032F |
4 Myanmar Metal Packaging Market Dynamics |
4.1 Impact Analysis |
4.2 Market Drivers |
4.3 Market Restraints |
5 Myanmar Metal Packaging Market Trends |
6 Myanmar Metal Packaging Market, By Types |
6.1 Myanmar Metal Packaging Market, By Material |
6.1.1 Overview and Analysis |
6.1.2 Myanmar Metal Packaging Market Revenues & Volume, By Material, 2022-2032F |
6.1.3 Myanmar Metal Packaging Market Revenues & Volume, By Steel, 2022-2032F |
6.1.4 Myanmar Metal Packaging Market Revenues & Volume, By Aluminum, 2022-2032F |
6.1.5 Myanmar Metal Packaging Market Revenues & Volume, By Others, 2022-2032F |
6.2 Myanmar Metal Packaging Market, By Product Type |
6.2.1 Overview and Analysis |
6.2.2 Myanmar Metal Packaging Market Revenues & Volume, By Cans, 2022-2032F |
6.2.3 Myanmar Metal Packaging Market Revenues & Volume, By Caps & Closures, 2022-2032F |
6.2.4 Myanmar Metal Packaging Market Revenues & Volume, By Drums & Barrels, 2022-2032F |
6.2.5 Myanmar Metal Packaging Market Revenues & Volume, By Others, 2022-2032F |
6.3 Myanmar Metal Packaging Market, By End User |
6.3.1 Overview and Analysis |
6.3.2 Myanmar Metal Packaging Market Revenues & Volume, By Food, 2022-2032F |
6.3.3 Myanmar Metal Packaging Market Revenues & Volume, By Beverage, 2022-2032F |
6.3.4 Myanmar Metal Packaging Market Revenues & Volume, By Personal Care, 2022-2032F |
6.3.5 Myanmar Metal Packaging Market Revenues & Volume, By Healthcare, 2022-2032F |
6.3.6 Myanmar Metal Packaging Market Revenues & Volume, By Others, 2022-2032F |
7 Myanmar Metal Packaging Market Import-Export Trade Statistics |
7.1 Myanmar Metal Packaging Market Export to Major Countries |
7.2 Myanmar Metal Packaging Market Imports from Major Countries |
8 Myanmar Metal Packaging Market Key Performance Indicators |
9 Myanmar Metal Packaging Market - Opportunity Assessment |
9.1 Myanmar Metal Packaging Market Opportunity Assessment, By Material, 2022 & 2032F |
9.2 Myanmar Metal Packaging Market Opportunity Assessment, By Product Type, 2022 & 2032F |
9.3 Myanmar Metal Packaging Market Opportunity Assessment, By End User, 2022 & 2032F |
10 Myanmar Metal Packaging Market - Competitive Landscape |
10.1 Myanmar Metal Packaging Market Revenue Share, By Companies, 2025 |
10.2 Myanmar Metal Packaging Market Competitive Benchmarking, By Operating and Technical Parameters |
11 Company Profiles |
12 Recommendations |
13 Disclaimer |
Global Go To Market Strategy - 2030
Export potential enables firms to identify high-growth global markets with greater confidence by combining advanced trade intelligence with a structured quantitative methodology. The framework analyzes emerging demand trends and country-level import patterns while integrating macroeconomic and trade datasets such as GDP and population forecasts, bilateral import–export flows, tariff structures, elasticity differentials between developed and developing economies, geographic distance, and import demand projections. Using weighted trade values from 2020–2024 as the base period to project country-to-country export potential for 2030, these inputs are operationalized through calculated drivers such as gravity model parameters, tariff impact factors, and projected GDP per-capita growth. Through an analysis of hidden potentials, demand hotspots, and market conditions that are most favorable to success, this method enables firms to focus on target countries, maximize returns, and global expansion with data, backed by accuracy.
By factoring in the projected importer demand gap that is currently unmet and could be potential opportunity, it identifies the potential for the Exporter (Country) among 190 countries, against the general trade analysis, which identifies the biggest importer or exporter.
To discover high-growth global markets and optimize your business strategy:
Click Here
Pricing
- Single User License$ 1,995
- Department License$ 2,400
- Site License$ 3,120
- Global License$ 3,795

Leadership Perspectives from Industry Events
Search
Thought Leadership and Analyst Meet


Our Clients
6WResearch In News
- India Air Conditioner Market Set for Strong Rebound in 2026 After Weather-Led Correction and GST-Driven Recovery: 6Wresearch
- ADAS in India: How Automatic Emergency Braking, Blind Spot Detection & Driver Monitoring are Transforming Road Safety
- Doha a strategic location for EV manufacturing hub: IPA Qatar
- Demand for luxury TVs surging in the GCC, says Samsung
- Empowering Growth: The Thriving Journey of Bangladesh’s Cable Industry
- Demand for luxury TVs surging in the GCC, says Samsung
Latest Reports
- Poland Fire Protection Systems Market (2026-2032)
- Cape Verde Portable Hand-Thrown Extinguisher Market (2026-2032)
- Canada Portable Hand-Thrown Extinguisher Market (2026-2032)
- Cameroon Portable Hand-Thrown Extinguisher Market (2026-2032)
- Burundi Portable Hand-Thrown Extinguisher Market (2026-2032)
- Burkina Faso Portable Hand-Thrown Extinguisher Market (2026-2032)
- Bulgaria Portable Hand-Thrown Extinguisher Market (2026-2032)
- Brunei Portable Hand-Thrown Extinguisher Market (2026-2032)
- Botswana Portable Hand-Thrown Extinguisher Market (2026-2032)
- Bosnia and Herzegovina Portable Hand-Thrown Extinguisher Market (2026-2032)
Industry Events and Analyst Meet

HIMTEX 2026

India Refining Summit 2026

India EV Show 2026

EV tech India Expo 2026

Auto Tech Asia 2026
Whitepaper
- Middle East & Africa Commercial Security Market Click here to view more.
- Middle East & Africa Fire Safety Systems & Equipment Market Click here to view more.
- GCC Drone Market Click here to view more.
- Middle East Lighting Fixture Market Click here to view more.
- GCC Physical & Perimeter Security Market Click here to view more.