Myanmar Middleware Market Size & Growth Rate (2026-2032)
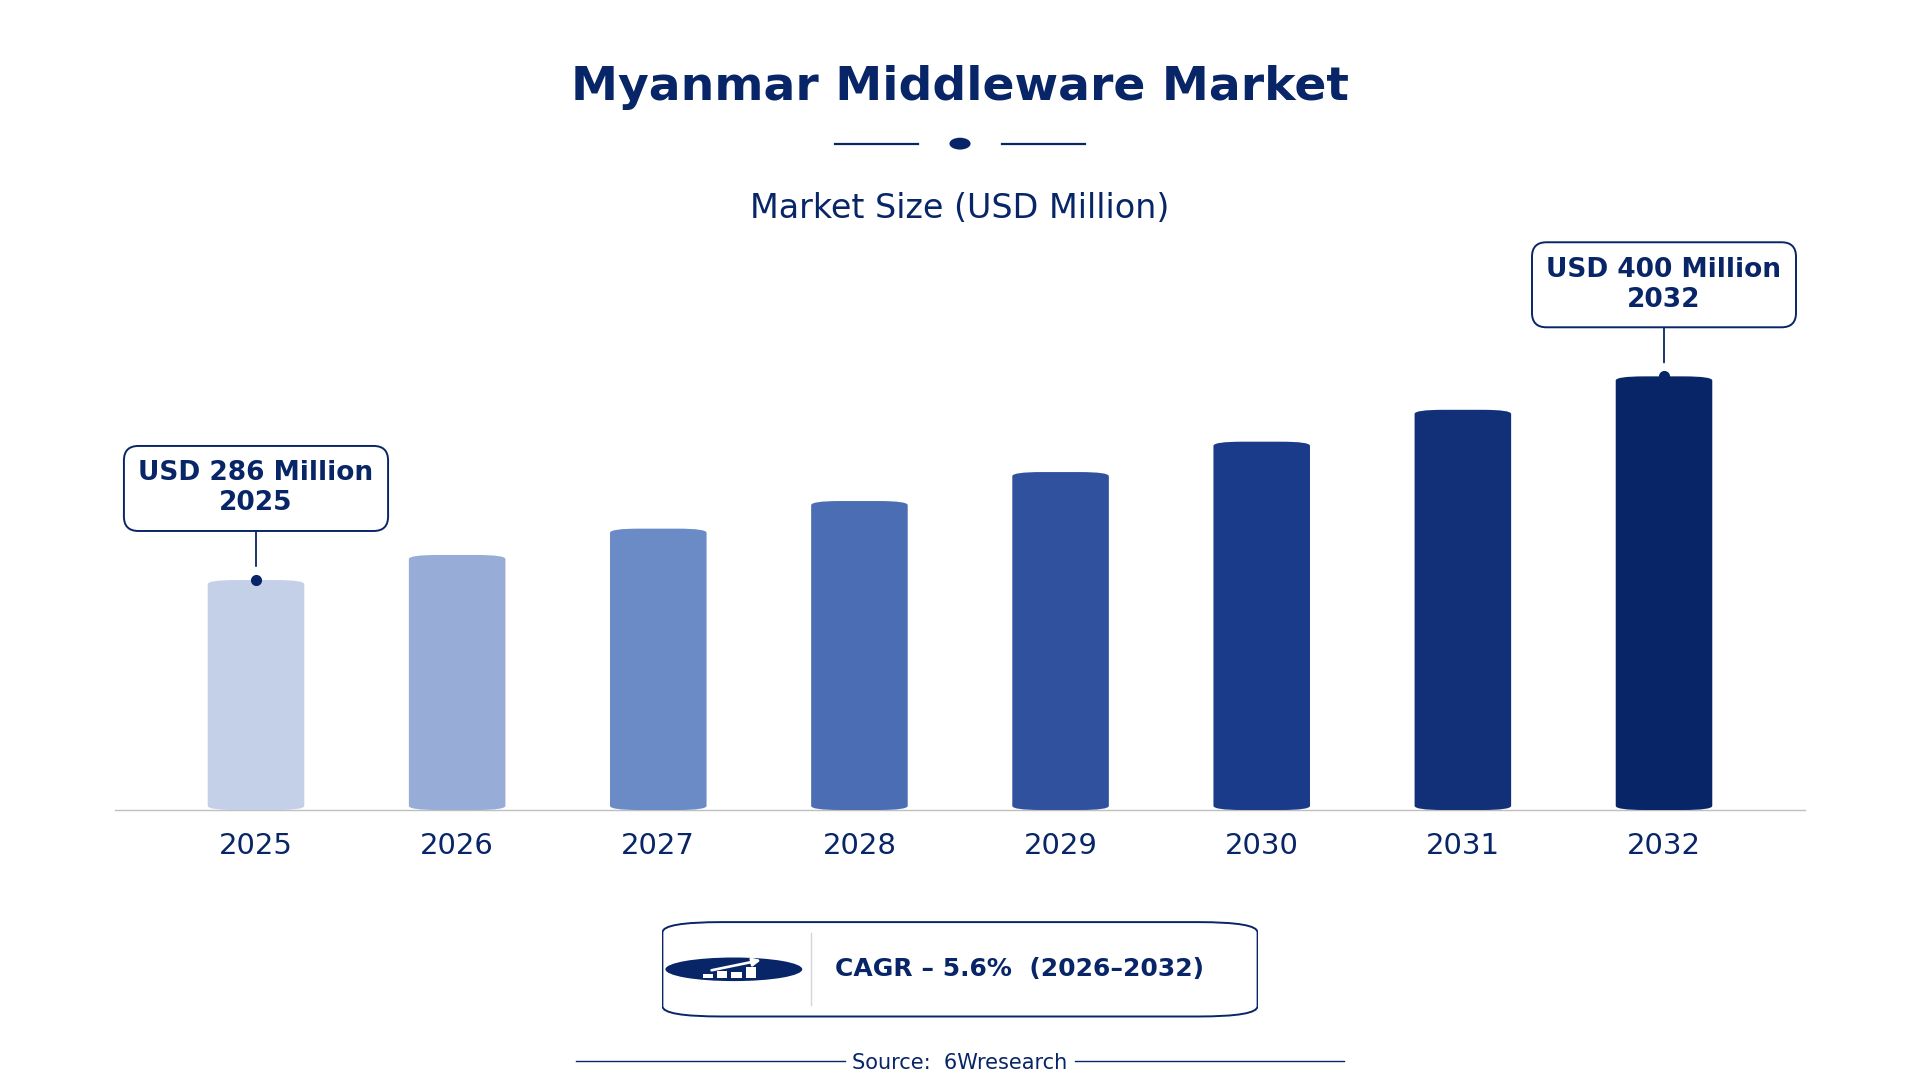
The Myanmar Middleware Market was estimated at USD 286 Million in 2025 and is projected to reach USD 400 Million by 2032, growing at a CAGR of 5.6% from 2026 to 2032.
Myanmar Middleware Market Synopsis
The Myanmar middleware market is currently experiencing a phase of growth driven by the increasing need for efficient data integration and communication solutions. As businesses in Myanmar embrace digital transformation, middleware has become a crucial component for ensuring operational efficiency.
Looking ahead, the market is set to evolve further with greater adoption of advanced technologies like cloud computing and IoT. However, challenges related to infrastructure and skilled workforce may impede this progress, necessitating strategic investments and policy support.
Myanmar Middleware Market Year-wise Growth Rate and Key Drivers
This graph illustrates the annual growth rates of the Myanmar Middleware Market from 2021 to 2032, highlighting a steady upward trajectory and projected expansion over the forecast period.
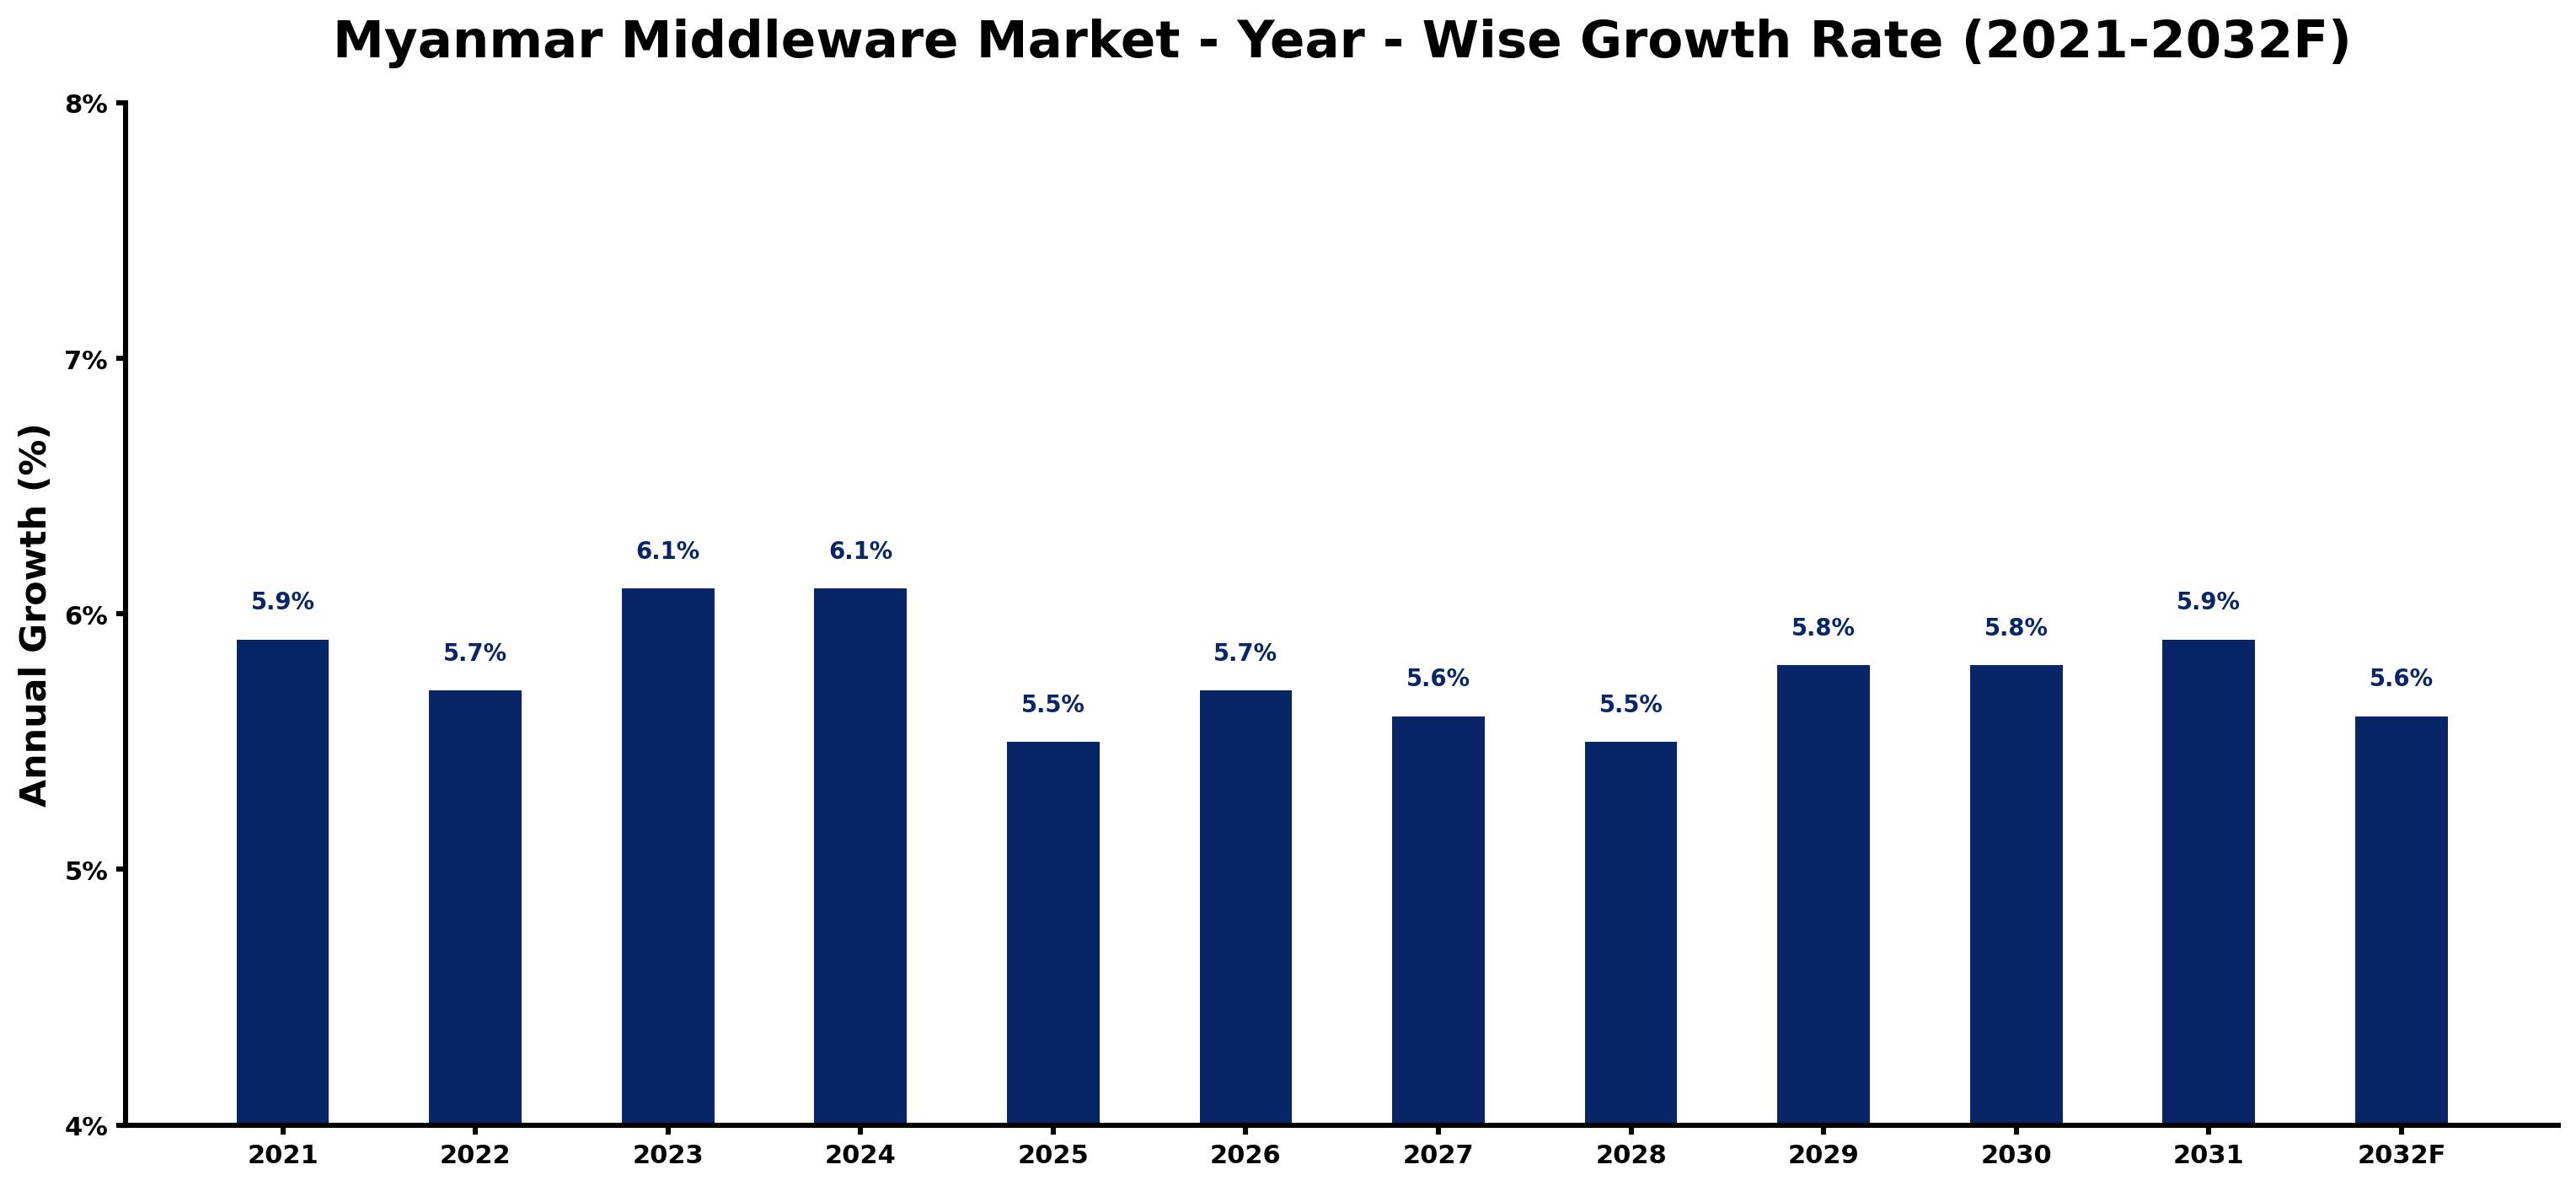
The table below presents the year‑wise growth rates along with the key drivers influencing the market
| Year | Growth Rate | Major Drivers |
| 2021 | 5.9% | Investment in digital infrastructure by Myanmar government agencies. |
| 2022 | 5.7% | Increased mobile internet penetration boosting software usage. |
| 2023 | 6.1% | Emergence of local startups enhancing middleware adoption. |
| 2024 | 6.1% | Government incentives for IT sector startups and expansions. |
| 2025 | 5.5% | Growing need for integration of local e-commerce platforms. |
| 2026 | 5.7% | Rising number of SMEs seeking operational efficiency tools. |
| 2027 | 5.6% | Shift towards digital banking solutions by local financial institutions. |
| 2028 | 5.5% | Increased collaboration with foreign tech firms for innovation. |
| 2029 | 5.8% | Growing focus on cybersecurity leading to middleware solutions. |
| 2030 | 5.8% | Enhanced regulatory frameworks supporting technology adoption. |
| 2031 | 5.9% | Increased demand from healthcare sector for integrated systems. |
| 2032 | 5.6% | Emergence of smart city initiatives requiring middleware services. |
Note: Market size estimations and growth projections presented in this report are based on 6Wresearch's proprietary forecasting methodology, utilizing the latest available industry data, government publications, and primary research inputs.
Myanmar Middleware Market Key Takeaways
Below are some of the specific key takeaways from the market, including:
- Increased demand for middleware solutions across sectors such as finance, healthcare, and government.
- Growing awareness of middleware benefits is driving adoption rates, especially among larger enterprises.
- High implementation costs remain a significant barrier for small and medium-sized businesses.
- The lack of skilled professionals poses challenges for the maintenance and development of middleware systems.
- Government initiatives are aimed at enhancing middleware technology adoption and integration.
Evaluation of Restraints in Myanmar Middleware Market
Several factors are limiting the growth of the Myanmar middleware market. A major concern is the inadequate infrastructure that hampers efficient middleware deployment. Many companies struggle with outdated technology, which complicates integration efforts. Additionally, high development costs associated with advanced middleware solutions can deter small and medium-sized enterprises from making necessary investments. A further challenge is the shortage of skilled professionals capable of developing and maintaining these systems, which directly impacts productivity and innovation in the sector.
Myanmar Middleware Market Trends
The trend towards cloud computing is significantly shaping the Myanmar middleware market. As organizations seek to optimize their IT operations, the demand for middleware that supports cloud integration is on the rise. on top of that, the emergence of IoT solutions is driving the need for middleware that enables interoperability between devices. Increased focus on automation is also influencing middleware development, pushing companies to adopt solutions that streamline processes and enhance operational agility.
Myanmar Middleware Market Opportunities
Opportunities abound in the Myanmar middleware market, particularly as businesses pivot towards digital solutions. The ongoing shift towards hybrid IT architectures presents a chance for middleware providers to offer tailored solutions that facilitate seamless integration. Additionally, growing government support for digital initiatives creates a favorable environment for middleware adoption. Companies that can effectively address the skills gap through training and development programs will likely find themselves at a competitive advantage.
Government Initiatives in the Myanmar Middleware Market
The Myanmar government is actively promoting middleware solutions to enhance the functionality of software applications across various sectors. This focus on integration reflects a broader commitment to developing the digital economy. Current policies emphasize product reliability and security, supporting local development and innovation, which are critical to advancing middleware technologies.
- A recently completed initiative aimed at upgrading the national digital infrastructure to support middleware adoption across industries.
- A current program is underway that focuses on training and development to build a skilled workforce capable of implementing middleware solutions.
- Planned efforts include a framework expected to be introduced by 2027 that will provide guidelines for middleware product standards and security protocols.
- An upcoming public-private partnership initiative intended to boost middleware technology innovation and accessibility in rural areas.
Future Insights of the Myanmar Middleware Market
The future of the Myanmar middleware market looks promising, particularly between 2026 and 2032. As businesses increasingly prioritize digital transformation, the demand for effective middleware solutions will likely rise. The ongoing investments in infrastructure and government support for technological advancements will facilitate smoother integration of middleware into various sectors. Companies that proactively adapt to these changes and address the existing barriers will be well-positioned to capitalize on emerging opportunities.
Myanmar Middleware Market Latest Developments
Over the past year, the Myanmar middleware market has seen a flurry of activity, as businesses and government entities alike prioritize digital solutions. Innovations in middleware technology and integration strategies are being explored to enhance operational efficiency across sectors. The market remains dynamic, with ongoing investments and initiatives aimed at driving adoption and improving capabilities.
- A major technology vendor launched a new middleware platform in early 2025, aimed at improving integration across healthcare applications.
- An initiative that began in mid-2025 and remains underway is focused on integrating middleware solutions in government agencies to enhance service delivery.
- A rollout expected to begin in late 2026 will introduce cloud-based middleware solutions designed for small and medium-sized enterprises.
- In Q1 2025, a partnership was formed between local tech firms to develop middleware solutions specifically targeting the finance sector.
Myanmar Middleware Market - Key Attractiveness of the Report
- 10 Years of Market Numbers
- Historical Data Starting from 2022 to 2025
- Base Year: 2025
- Forecast Data until 2032
- Key Performance Indicators Impacting the Market
- Major Upcoming Developments and Projects
Key Highlights of the Report:
- Myanmar Middleware Market Outlook
- Market Size of Myanmar Middleware Market, 2025
- Forecast of Myanmar Middleware Market, 2032
- Historical Data and Forecast of Myanmar Middleware Revenues & Volume for the Period 2022-2032F
- Myanmar Middleware Market Trend Evolution
- Myanmar Middleware Market Drivers and Challenges
- Myanmar Middleware Price Trends
- Myanmar Middleware Porter's Five Forces
- Myanmar Middleware Industry Life Cycle
- Historical Data and Forecast of Myanmar Middleware Market Revenues & Volume By Product Type for the Period 2022-2032F
- Historical Data and Forecast of Myanmar Middleware Market Revenues & Volume By Communication Middleware for the Period 2022-2032F
- Historical Data and Forecast of Myanmar Middleware Market Revenues & Volume By Platform Middleware for the Period 2022-2032F
- Historical Data and Forecast of Myanmar Middleware Market Revenues & Volume By Integration Middleware for the Period 2022-2032F
- Historical Data and Forecast of Myanmar Middleware Market Revenues & Volume By Others for the Period 2022-2032F
- Historical Data and Forecast of Myanmar Middleware Market Revenues & Volume By Deployment Types for the Period 2022-2032F
- Historical Data and Forecast of Myanmar Middleware Market Revenues & Volume By On-Premise for the Period 2022-2032F
- Historical Data and Forecast of Myanmar Middleware Market Revenues & Volume By Hosted for the Period 2022-2032F
- Historical Data and Forecast of Myanmar Middleware Market Revenues & Volume By Hybrid for the Period 2022-2032F
- Historical Data and Forecast of Myanmar Middleware Market Revenues & Volume By Organization Size for the Period 2022-2032F
- Historical Data and Forecast of Myanmar Middleware Market Revenues & Volume By Small businesses for the Period 2022-2032F
- Historical Data and Forecast of Myanmar Middleware Market Revenues & Volume By Medium businesses for the Period 2022-2032F
- Historical Data and Forecast of Myanmar Middleware Market Revenues & Volume By Enterprises for the Period 2022-2032F
- Historical Data and Forecast of Myanmar Middleware Market Revenues & Volume By Large enterprises for the Period 2022-2032F
- Historical Data and Forecast of Myanmar Middleware Market Revenues & Volume By Verticals for the Period 2022-2032F
- Historical Data and Forecast of Myanmar Middleware Market Revenues & Volume By Banking, financial services and insurance (BFSI) for the Period 2022-2032F
- Historical Data and Forecast of Myanmar Middleware Market Revenues & Volume By Consumer Goods and Retail for the Period 2022-2032F
- Historical Data and Forecast of Myanmar Middleware Market Revenues & Volume By IT and telecom for the Period 2022-2032F
- Historical Data and Forecast of Myanmar Middleware Market Revenues & Volume By Manufacturing for the Period 2022-2032F
- Historical Data and Forecast of Myanmar Middleware Market Revenues & Volume By Oil and Gas for the Period 2022-2032F
- Historical Data and Forecast of Myanmar Middleware Market Revenues & Volume By Healthcare for the Period 2022-2032F
- Historical Data and Forecast of Myanmar Middleware Market Revenues & Volume By Government for the Period 2022-2032F
- Myanmar Middleware Import Export Trade Statistics
- Market Opportunity Assessment By Product Type
- Market Opportunity Assessment By Deployment Types
- Market Opportunity Assessment By Organization Size
- Market Opportunity Assessment By Verticals
- Myanmar Middleware Top Companies Market Share
- Myanmar Middleware Competitive Benchmarking By Technical and Operational Parameters
- Myanmar Middleware Company Profiles
- Myanmar Middleware Key Strategic Recommendations






































