Myanmar Paper Products Market (2026-2032) | Growth, Trends, Size, Industry, Share, Value, Outlook, Companies, Analysis, Forecast & Revenue
Market Forecast By Type (Converted Paper Products, Unfinished Paper, Pulp Mills), By Applications (Writing Paper, Magazine Paper, Packaging Paper, Sanitary Paper, Other) And Competitive Landscape
| Product Code: ETC038595 | Publication Date: Jan 2021 | Updated Date: Jun 2026 | Product Type: Report | |
| Publisher: 6Wresearch | Author: Shubham Deep | No. of Pages: 70 | No. of Figures: 35 | No. of Tables: 5 |
Myanmar Paper Products Market Summary
The myanmar paper products market was estimated at USD 273 Million in 2025 and is projected to reach USD 380 Million by 2032, growing at a CAGR of 5.4% from 2026 to 2032.
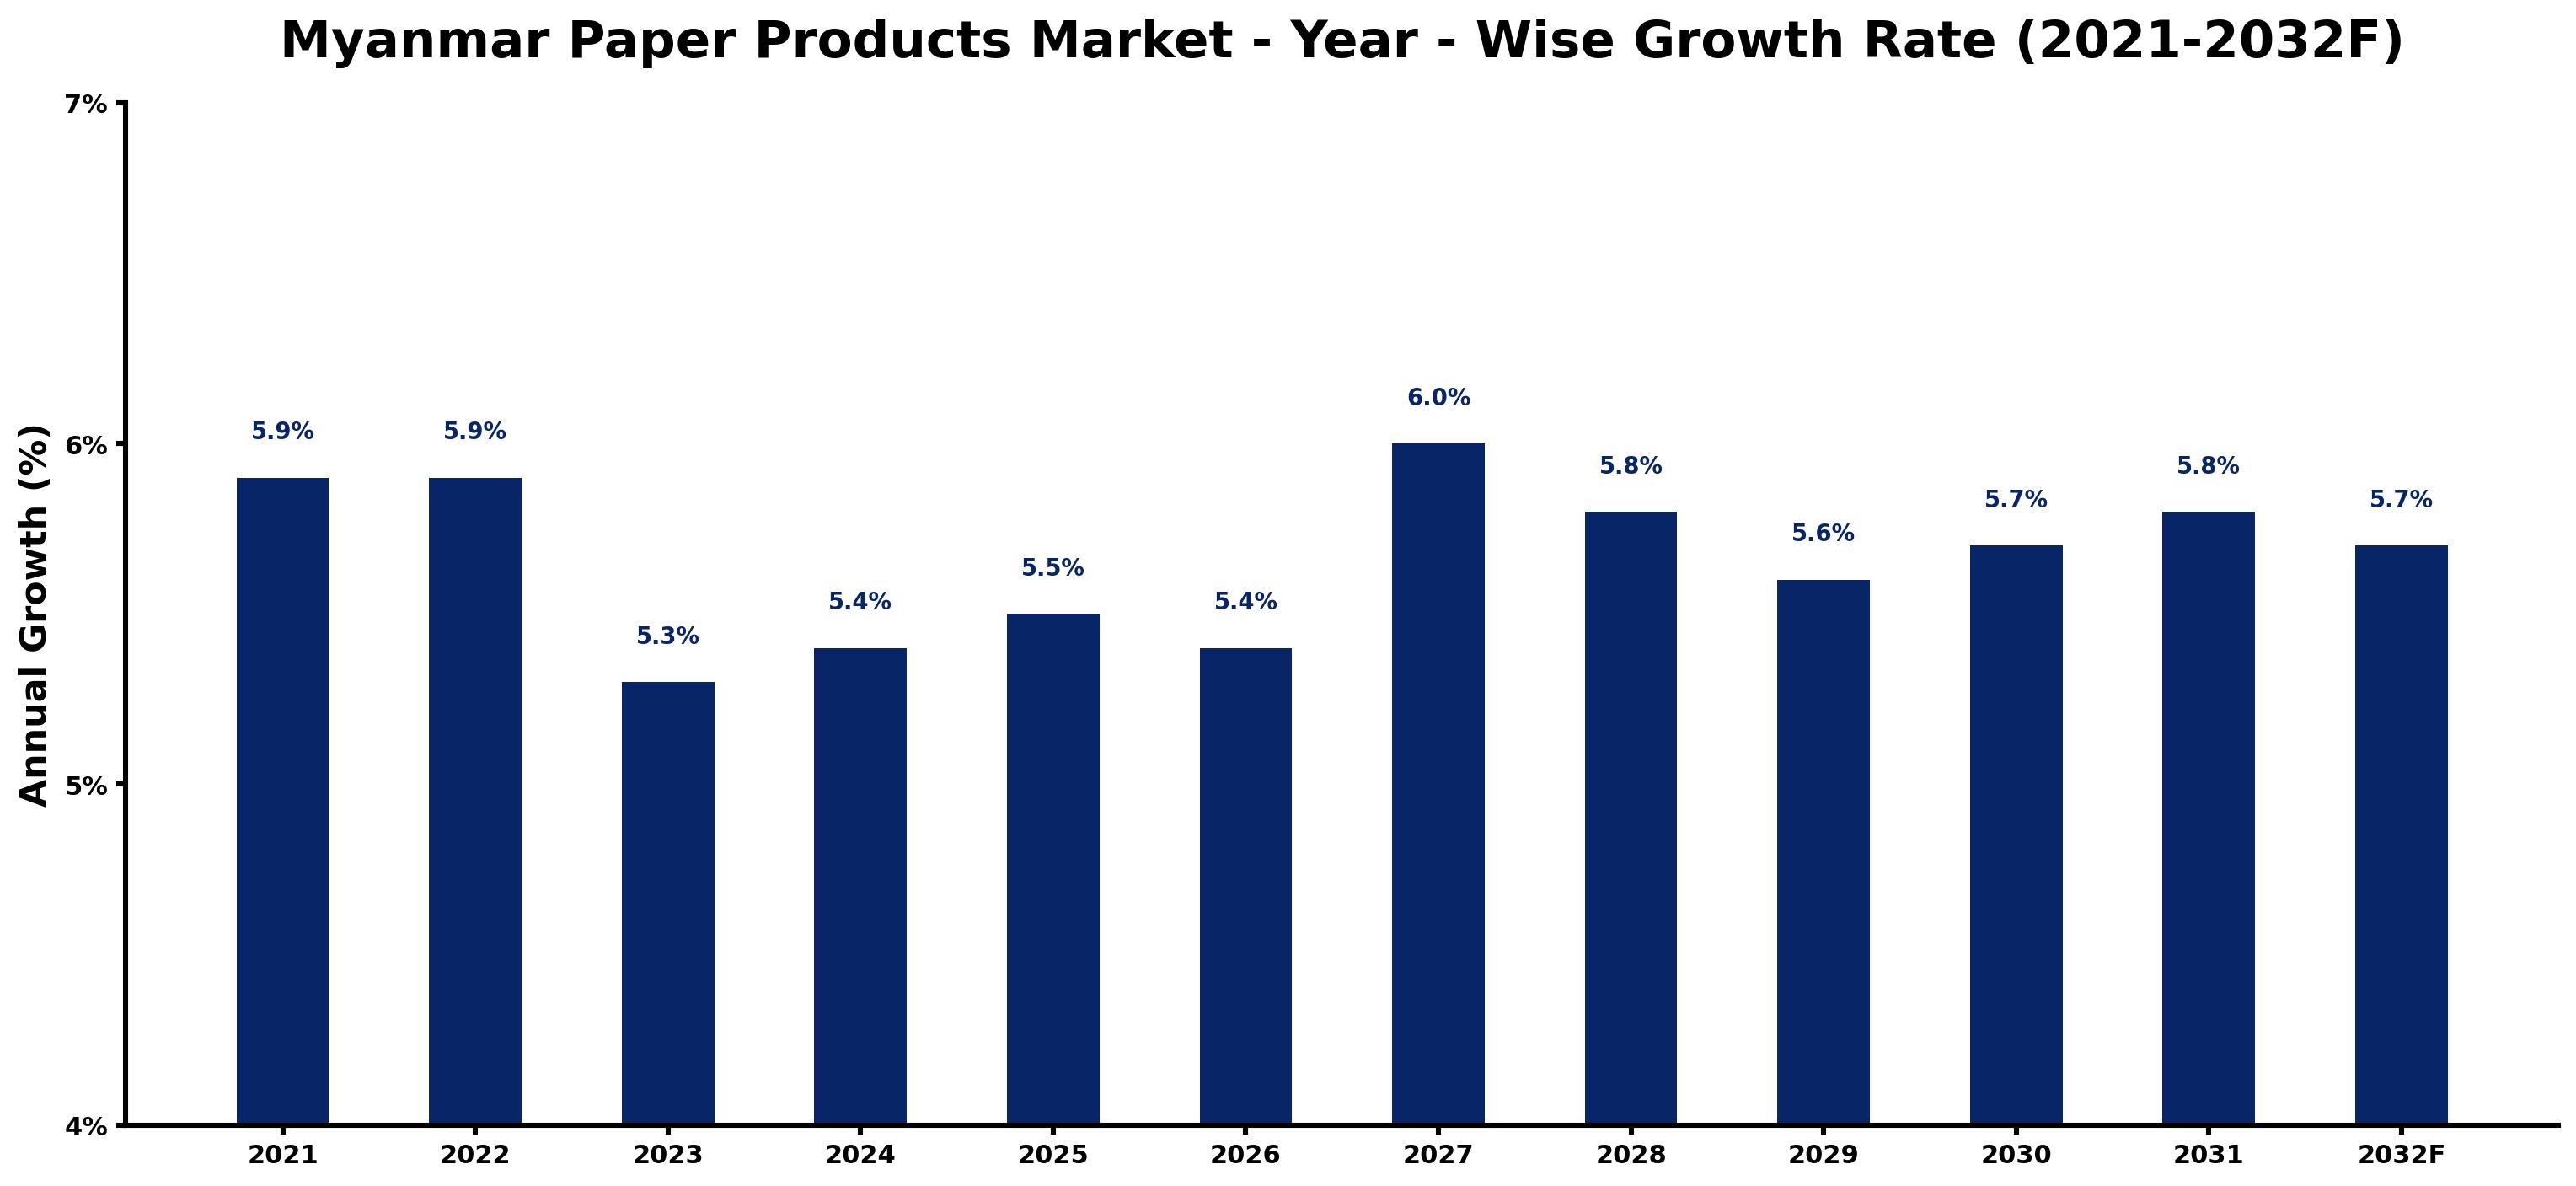
Myanmar Paper Products Market Growth Rate Analysis (2021-2032)
The Myanmar paper products market has showcased a stable growth pattern, characterized by a yearly increase of 5.9% in both 2021 and 2022, reflecting strong consumer demand bolstered by economic recovery initiatives. However, growth slightly moderated to 5.3% in 2023, attributable to fluctuations in raw material prices and a temporary slowdown in construction projects. From 2024 onward, the market resumed a healthier pace, with growth projected at 5.4% in 2024 and rising to 6.0% by 2027, driven by increased investments in local manufacturing and improved infrastructure. The continuing digitalization efforts and a growing preference for sustainable products are expected to further reinforce this upward trend, balancing out minor fluctuations along the forecasted path through 2032.
Myanmar Paper Products Market Year-wise Growth Rate and Key Drivers
This graph highlights how the Myanmar Paper Products Market has steadily grown over the past five years, supported by major growth factors.
The table below presents the year wise growth rates along with the key drivers influencing the market
| Year | Growth Rate | Major Drivers |
| 2021 | 5.9% | Post-coup political instability challenges supply chains and consumer confidence levels. |
| 2022 | 5.9% | COVID-19 recovery boosts demand for sustainable packaging and eco-friendly products. |
| 2023 | 5.3% | Increased urbanization fosters a shift towards packaged goods and disposable items. |
| 2024 | 5.4% | Local manufacturers invest in modern production technologies to improve output quality. |
| 2025 | 5.5% | E-commerce platforms expand access to paper products, enhancing market reach significantly. |
| 2026 | 5.4% | Rising literacy rates correlate with increased demand for educational and office supplies. |
| 2027 | 6.0% | International companies explore partnership opportunities, enhancing competition within the sector. |
| 2028 | 5.8% | Renewed focus on environmental sustainability impacts consumer preferences for recycled products. |
| 2029 | 5.6% | Investment in logistics infrastructure reduces distribution costs and increases market accessibility. |
| 2030 | 5.7% | Digital transformation in retail fosters innovation in product offerings and customer engagement. |
| 2031 | 5.8% | Rural market penetration accelerates as internet access expands beyond urban centers. |
| 2032 | 5.7% | Regulatory changes promote the use of biodegradable materials, reshaping industry standards. |
Note - Market size estimations and growth projections presented in this report are based on 6Wresearch's advanced forecasting approach, validated with industry datasets as of June 2026.
Myanmar Paper Products Market Synopsis
The Myanmar Paper Products Market is projected to reach 5.4% and witness significant growth during the forecast period (2026-2032). This market has been driven by an upsurge in demand for various paper products across sectors such as packaging, printing, and stationery. Contributing factors to this growth include the ongoing economic development within the country, an increase in disposable income among consumers, and a heightened awareness of sustainable packaging solutions.
Myanmar Paper Products Market Growth Drivers
Several primary drivers are influencing the expansion of the Myanmar Paper Products Market. Understanding these factors is crucial for stakeholders aiming to navigate this evolving landscape:
- Economic Expansion: The steady growth of Myanmar's economy has increased consumer spending, particularly in sectors requiring packaging and stationery products.
- Rise in Disposable Income: The growing middle class in Myanmar is driving demand for a variety of paper products, contributing to a robust market environment.
- Sustainability Trends: An increasing focus on sustainable and environmentally-friendly products is prompting consumers and businesses to seek out recycled and biodegradable options.
- Technological Advancements: Innovations in production technologies are enhancing efficiency, allowing local manufacturers to compete more effectively against imported goods.
- Urbanization: The rapid urbanization in Myanmar is creating new market segments and driving demand for packaging materials for e-commerce and retail sectors.
Myanmar Paper Products Market Trends and Opportunities
The Myanmar Paper Products Market is currently undergoing significant shifts driven by contemporary consumer preferences and technological advancements. Key trends include:
- Demand for Eco-Friendly Products: There is a noticeable consumer shift towards sourcing paper products that are sustainable, biodegradable, and made from recycled materials.
- Customization Demand: The desire for personalized designs in stationery and packaging is gaining momentum, encouraging manufacturers to offer diverse product options.
- Increased E-Commerce: The expansion of e-commerce in Myanmar is generating a surge in demand for packaging solutions tailored for online shipments.
- Investment in Recycling Initiatives: The focus on sustainability is leading to investments in recycling facilities, making the market more resilient to raw material shortages.
- Innovation in Production Processes: Companies are adopting advanced technologies to enhance production capabilities, further driving market growth.
Myanmar Paper Products Market Challenges and Restraints
While the Myanmar Paper Products Market is poised for growth, it faces several challenges that may hinder its expansion:
- Raw Material Access: Restrictive government regulations on logging and environmental concerns limit access to essential raw materials, increasing production costs.
- Inadequate Infrastructure: Insufficient infrastructure and technology hinder efficient production and distribution processes.
- Consumer Awareness: Limited awareness regarding the benefits and quality of high-grade paper products restrains market potential.
- Competition from Imports: The influx of cheaper imported paper products challenges the pricing and competitiveness of local manufacturers.
- Skilled Labor Shortage: A lack of skilled workers in the industry affects production efficiency and innovation capabilities.
Myanmar Paper Products Market Investment Opportunities
Despite existing challenges, the Myanmar Paper Products Market offers substantial investment opportunities for prospective players. The increase in consumer demand for paper products, driven by a burgeoning population of over 54 million and a rising middle class, presents favorable conditions for investment. Noteworthy opportunities include:
- Expansion of Production Facilities: Investing in local production facilities can address the growing need for varied paper products while improving supply chain efficiencies.
- Recycling Initiatives: Establishing paper recycling plants aligns with global sustainability trends and can yield high returns on investment.
- Technological Enhancements: Investment in technology and innovation can lead to improved production methods and product quality, enhancing competitiveness.
- Market Penetration: Companies can explore under-served markets and niches within Myanmar, such as personalized stationery and specialized packaging solutions.
- Sustainable Practices: Emphasizing environmentally responsible practices can attract eco-conscious consumers and partners, strengthening brand loyalty.
Myanmar Paper Products Market Government Investment and Initiatives
The Myanmar government plays a pivotal role in shaping the future of the paper products market through various initiatives and policies. Key government efforts include:
- Environmental Regulations: The government is implementing strict regulations to promote sustainable forest management and responsible sourcing of raw materials.
- Support for Recycling: Initiatives aimed at increasing the use of recycled materials in paper production are being encouraged through grants and subsidies.
- Investment Incentives: Policies are being established to attract foreign direct investment into the Myanmar paper industry, particularly in innovative technologies.
- Infrastructure Development: Ongoing investments in infrastructure are essential for improved production efficiency and distribution networks.
- Trade Regulations: The government is reviewing import tariffs and trade agreements to protect local manufacturers and promote export opportunities.
Myanmar Paper Products Market Latest Developments (May 2025 - June 2026)
In the period from May 2025 to June 2026, significant developments have occurred in the Myanmar Paper Products Market, signaling a dynamic transformation: manufacturers have been increasingly exploring sustainable practices as consumer awareness around environmental issues grows. There has also been a noticeable rise in investments aimed at enhancing local production capabilities, with a focus on modernizing facilities and adopting innovative technologies. Furthermore, digitalization trends have prompted companies to adapt packaging solutions for e-commerce, aligning with shifting consumer behaviors. The government's sustained commitment to fostering a supportive environment for industrial growth has also been evident, with policies targeting infrastructure improvements and sustainable practices. Overall, this period has set the stage for continued advancement in the market.
Myanmar Paper Products Market - Key Attractiveness of the Report
- 10 Years of Market Numbers
- Historical Data Starting from 2022 to 2025
- Base Year: 2025
- Forecast Data until 2032
- Key Performance Indicators Impacting the Market
- Major Upcoming Developments and Projects
Key Highlights of the Report:
- Myanmar Paper Products Market Outlook
- Market Size of Myanmar Paper Products Market, 2025
- Forecast of Myanmar Paper Products Market, 2032F
- Historical Data and Forecast of Myanmar Paper Products Revenues & Volume for the Period 2022-2032F
- Myanmar Paper Products Market Trend Evolution
- Myanmar Paper Products Market Drivers and Challenges
- Myanmar Paper Products Price Trends
- Myanmar Paper Products Porter's Five Forces
- Myanmar Paper Products Industry Life Cycle
- Historical Data and Forecast of Myanmar Paper Products Market Revenues & Volume By Type for the Period 2022-2032F
- Historical Data and Forecast of Myanmar Paper Products Market Revenues & Volume By Converted Paper Products for the Period 2022-2032F
- Historical Data and Forecast of Myanmar Paper Products Market Revenues & Volume By Unfinished Paper for the Period 2022-2032F
- Historical Data and Forecast of Myanmar Paper Products Market Revenues & Volume By Pulp Mills for the Period 2022-2032F
- Historical Data and Forecast of Myanmar Paper Products Market Revenues & Volume By Applications for the Period 2022-2032F
- Historical Data and Forecast of Myanmar Paper Products Market Revenues & Volume By Writing Paper for the Period 2022-2032F
- Historical Data and Forecast of Myanmar Paper Products Market Revenues & Volume By Magazine Paper for the Period 2022-2032F
- Historical Data and Forecast of Myanmar Paper Products Market Revenues & Volume By Packaging Paper for the Period 2022-2032F
- Historical Data and Forecast of Myanmar Paper Products Market Revenues & Volume By Sanitary Paper for the Period 2022-2032F
- Historical Data and Forecast of Myanmar Paper Products Market Revenues & Volume By Other for the Period 2022-2032F
- Myanmar Paper Products Import Export Trade Statistics
- Market Opportunity Assessment By Type
- Market Opportunity Assessment By Applications
- Myanmar Paper Products Top Companies Market Share
- Myanmar Paper Products Competitive Benchmarking By Technical and Operational Parameters
- Myanmar Paper Products Company Profiles
- Myanmar Paper Products Key Strategic Recommendations
Frequently Asked Questions About the Market Study (FAQs):
The growth in the Myanmar Paper Products Market is driven by economic development, rising disposable incomes, and increasing demand for sustainable packaging solutions across various sectors.
Manufacturers encounter challenges such as limited access to raw materials, inadequate infrastructure, and competition from cheaper imported products that can affect profitability and market share.
The government is supporting the industry through environmental regulations, incentives for recycling initiatives, and investments in infrastructure aimed at enhancing production and distribution capabilities.
Future prospects for the Myanmar Paper Products Market are promising, driven by economic growth, increasing urbanization, and an upsurge in demand for sustainable paper products, despite challenges related to infrastructure and market competition.
6Wresearch actively monitors the Myanmar Paper Products Market and publishes its comprehensive annual report, highlighting emerging trends, growth drivers, revenue analysis, and forecast outlook. Our insights help businesses to make data-backed strategic decisions with ongoing market dynamics. Our analysts track relevent industries related to the Myanmar Paper Products Market, allowing our clients with actionable intelligence and reliable forecasts tailored to emerging regional needs.
Yes, we provide customisation as per your requirements. To learn more, feel free to contact us on sales@6wresearch.com
1 Executive Summary |
2 Introduction |
2.1 Key Highlights of the Report |
2.2 Report Description |
2.3 Market Scope & Segmentation |
2.4 Research Methodology |
2.5 Assumptions |
3 Myanmar Paper Products Market Overview |
3.1 Myanmar Country Macro Economic Indicators |
3.2 Myanmar Paper Products Market Revenues & Volume, 2022 & 2032F |
3.3 Myanmar Paper Products Market - Industry Life Cycle |
3.4 Myanmar Paper Products Market - Porter's Five Forces |
3.5 Myanmar Paper Products Market Revenues & Volume Share, By Type, 2022 & 2032F |
3.6 Myanmar Paper Products Market Revenues & Volume Share, By Applications, 2022 & 2032F |
4 Myanmar Paper Products Market Dynamics |
4.1 Impact Analysis |
4.2 Market Drivers |
4.3 Market Restraints |
5 Myanmar Paper Products Market Trends |
6 Myanmar Paper Products Market, By Types |
6.1 Myanmar Paper Products Market, By Type |
6.1.1 Overview and Analysis |
6.1.2 Myanmar Paper Products Market Revenues & Volume, By Type, 2022-2032F |
6.1.3 Myanmar Paper Products Market Revenues & Volume, By Converted Paper Products, 2022-2032F |
6.1.4 Myanmar Paper Products Market Revenues & Volume, By Unfinished Paper, 2022-2032F |
6.1.5 Myanmar Paper Products Market Revenues & Volume, By Pulp Mills, 2022-2032F |
6.2 Myanmar Paper Products Market, By Applications |
6.2.1 Overview and Analysis |
6.2.2 Myanmar Paper Products Market Revenues & Volume, By Writing Paper, 2022-2032F |
6.2.3 Myanmar Paper Products Market Revenues & Volume, By Magazine Paper, 2022-2032F |
6.2.4 Myanmar Paper Products Market Revenues & Volume, By Packaging Paper, 2022-2032F |
6.2.5 Myanmar Paper Products Market Revenues & Volume, By Sanitary Paper, 2022-2032F |
6.2.6 Myanmar Paper Products Market Revenues & Volume, By Other, 2022-2032F |
7 Myanmar Paper Products Market Import-Export Trade Statistics |
7.1 Myanmar Paper Products Market Export to Major Countries |
7.2 Myanmar Paper Products Market Imports from Major Countries |
8 Myanmar Paper Products Market Key Performance Indicators |
9 Myanmar Paper Products Market - Opportunity Assessment |
9.1 Myanmar Paper Products Market Opportunity Assessment, By Type, 2022 & 2032F |
9.2 Myanmar Paper Products Market Opportunity Assessment, By Applications, 2022 & 2032F |
10 Myanmar Paper Products Market - Competitive Landscape |
10.1 Myanmar Paper Products Market Revenue Share, By Companies, 2025 |
10.2 Myanmar Paper Products Market Competitive Benchmarking, By Operating and Technical Parameters |
11 Company Profiles |
12 Recommendations |
13 Disclaimer |
Global Go To Market Strategy - 2030
Export potential enables firms to identify high-growth global markets with greater confidence by combining advanced trade intelligence with a structured quantitative methodology. The framework analyzes emerging demand trends and country-level import patterns while integrating macroeconomic and trade datasets such as GDP and population forecasts, bilateral import–export flows, tariff structures, elasticity differentials between developed and developing economies, geographic distance, and import demand projections. Using weighted trade values from 2020–2024 as the base period to project country-to-country export potential for 2030, these inputs are operationalized through calculated drivers such as gravity model parameters, tariff impact factors, and projected GDP per-capita growth. Through an analysis of hidden potentials, demand hotspots, and market conditions that are most favorable to success, this method enables firms to focus on target countries, maximize returns, and global expansion with data, backed by accuracy.
By factoring in the projected importer demand gap that is currently unmet and could be potential opportunity, it identifies the potential for the Exporter (Country) among 190 countries, against the general trade analysis, which identifies the biggest importer or exporter.
To discover high-growth global markets and optimize your business strategy:
Click Here
Pricing
- Single User License$ 1,995
- Department License$ 2,400
- Site License$ 3,120
- Global License$ 3,795

Leadership Perspectives from Industry Events
Search
Thought Leadership and Analyst Meet


Our Clients
6WResearch In News
- India Air Conditioner Market Set for Strong Rebound in 2026 After Weather-Led Correction and GST-Driven Recovery: 6Wresearch
- ADAS in India: How Automatic Emergency Braking, Blind Spot Detection & Driver Monitoring are Transforming Road Safety
- Doha a strategic location for EV manufacturing hub: IPA Qatar
- Demand for luxury TVs surging in the GCC, says Samsung
- Empowering Growth: The Thriving Journey of Bangladesh’s Cable Industry
- Demand for luxury TVs surging in the GCC, says Samsung
Latest Reports
- Nicaragua RPG Gaming Market (2026-2032)
- New Zealand RPG Gaming Market (2026-2032)
- Netherlands RPG Gaming Market (2026-2032)
- Nauru RPG Gaming Market (2026-2032)
- Namibia RPG Gaming Market (2026-2032)
- Mozambique RPG Gaming Market (2026-2032)
- Montenegro RPG Gaming Market (2026-2032)
- Mongolia RPG Gaming Market (2026-2032)
- Monaco RPG Gaming Market (2026-2032)
- Micronesia RPG Gaming Market (2026-2032)
Industry Events and Analyst Meet

HIMTEX 2026

India Refining Summit 2026

India EV Show 2026

EV tech India Expo 2026

Auto Tech Asia 2026
Whitepaper
- Middle East & Africa Commercial Security Market Click here to view more.
- Middle East & Africa Fire Safety Systems & Equipment Market Click here to view more.
- GCC Drone Market Click here to view more.
- Middle East Lighting Fixture Market Click here to view more.
- GCC Physical & Perimeter Security Market Click here to view more.