Myanmar Power Supply Market (2026-2032) | Analysis, Size, Trends, Revenue, Companies, Growth, Share, Outlook, Value, Industry & Forecast
Market Forecast By Output Power (Power Supply With Low Output (500 W and Below), Power Supply With Medium Output (500–1,000 W), Power Supply With High Output (More Than 1,000 W)), By Type (AC-DC Power Supply, DC-DC Power Supply), By Vertical (Medical & Healthcare, Military & Aerospace, Telecommunications, Consumer Electronics, Transportation, Lighting, Food & Beverages, Industrial) And Competitive Landscape
| Product Code: ETC014214 | Publication Date: Oct 2020 | Updated Date: Jun 2026 | Product Type: Report | |
| Publisher: 6Wresearch | Author: Ravi Bhandari | No. of Pages: 70 | No. of Figures: 35 | No. of Tables: 5 |
Myanmar Power Supply Market Summary
The myanmar power supply market was estimated at USD 456 Million in 2025 and is projected to reach USD 616 Million by 2032, growing at a CAGR of 5.3% from 2026 to 2032.
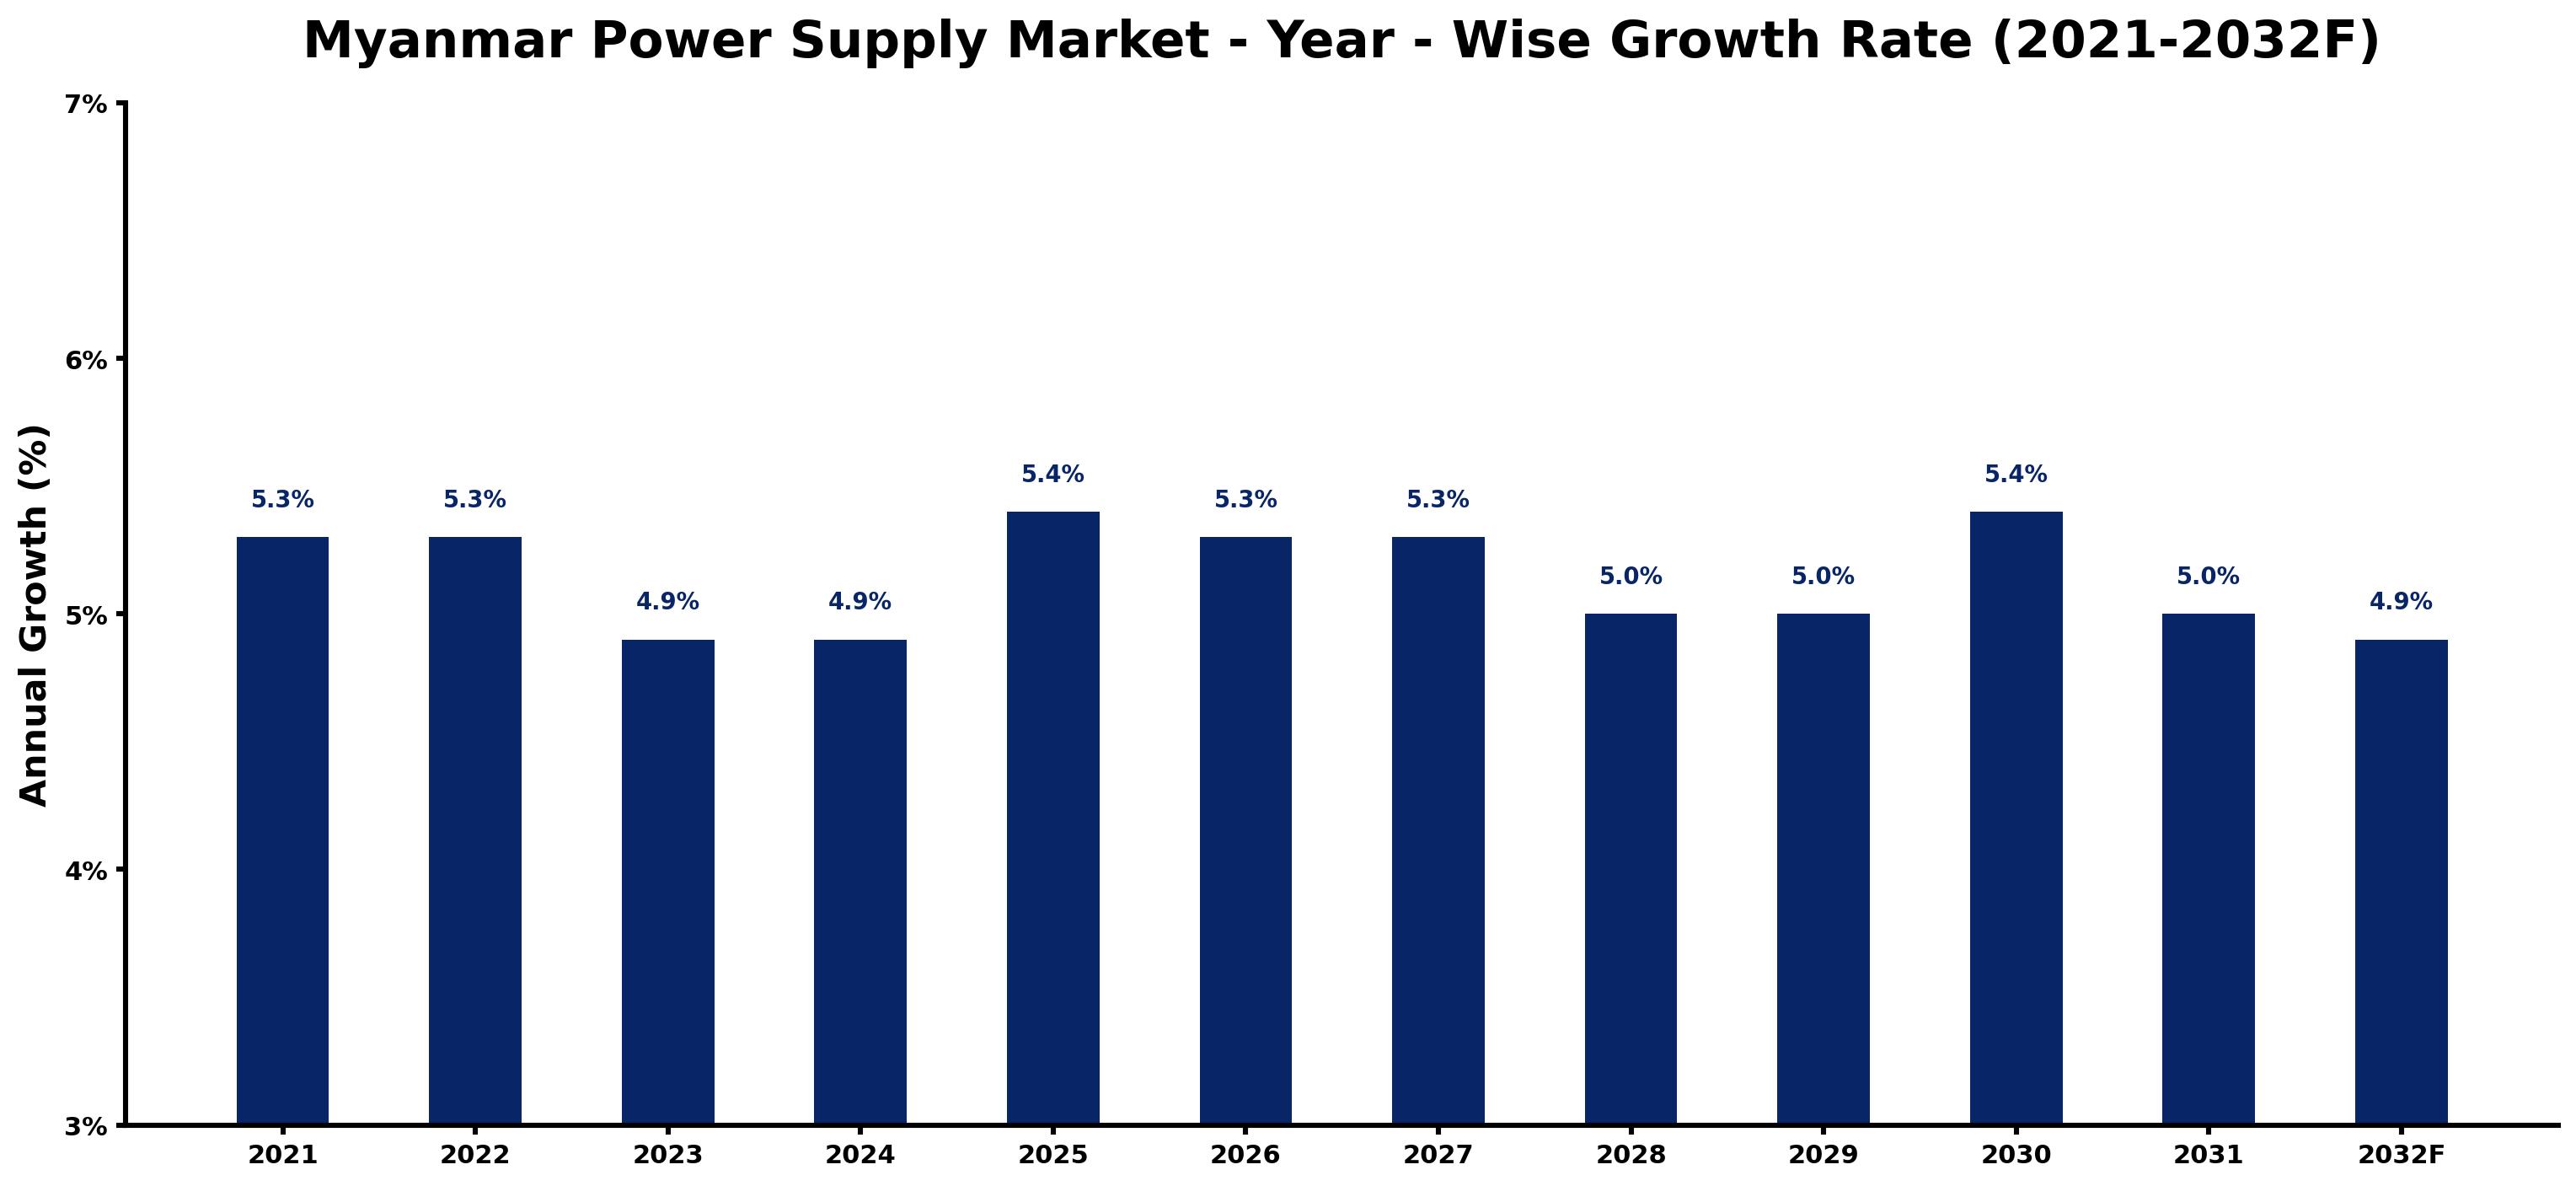
Myanmar Power Supply Market Growth Rate Analysis (2021-2032)
The Myanmar power supply market has exhibited stable growth, with yearly increases of 5.3% in both 2021 and 2022, followed by a slight decline to 4.9% in 2023 and 2024. This downturn can be attributed to infrastructure challenges and fluctuating policies that momentarily hampered investment. However, as these issues are being addressed, a rebound is anticipated, with growth projected at 5.4% in 2025 and 5.3% through 2027. The upward trend is fueled by rising consumer demand for reliable energy and significant investments in digitalization and renewable energy initiatives, indicating a robust shift towards sustainable practices. This gradual evolution is critical for supporting Myanmar's economic ambitions.
Myanmar Power Supply Market Year-wise Growth Rate and Key Drivers
This graph highlights how the Myanmar Power Supply Market has steadily grown over the past five years, supported by major growth factors.
The table below presents the year wise growth rates along with the key drivers influencing the market
| Year | Growth Rate | Major Drivers |
| 2021 | 5.3% | Investment in renewable energy sources attracts foreign direct investment in Myanmar's infrastructure. |
| 2022 | 5.3% | Increased urbanization demands reliable power supply for emerging residential complexes in cities. |
| 2023 | 4.9% | Local businesses focus on modernizing operations, seeking energy-efficient solutions for sustainability. |
| 2024 | 4.9% | Cross-border electricity trade with neighboring countries enhances regional energy resilience and stability. |
| 2025 | 5.4% | Rural electrification projects expand access, improving living standards and boosting local economies. |
| 2026 | 5.3% | Technological innovation in microgrid systems transforms energy distribution in remote communities. |
| 2027 | 5.3% | Public-private partnerships become critical for funding large-scale power generation and distribution projects. |
| 2028 | 5.0% | Climate adaptation strategies push for diversified energy portfolios to mitigate environmental impacts. |
| 2029 | 5.0% | Local startups enter the energy market, introducing competitive alternatives to traditional power providers. |
| 2030 | 5.4% | Growing awareness of sustainability among consumers shapes preferences for green energy solutions. |
| 2031 | 5.0% | Advancements in battery storage technology significantly improve supply reliability across the grid. |
| 2032 | 4.9% | Investment in smart grid technology enhances efficiency, reducing outages and operational costs. |
Note - Market size estimations and growth projections presented in this report are based on 6Wresearch's advanced forecasting approach, validated with industry datasets as of June 2026.
Myanmar Power Supply Market Synopsis
The Myanmar Power Supply Market is projected to reach 5.3% and witness significant growth during the forecast period (2026-2032). This expansion is primarily driven by the increasing demand for reliable and efficient power solutions across multiple sectors of the economy. As Myanmar continues to develop its infrastructure, the need for stable and continuous electricity supply is becoming crucial for both industrial and consumer electronics applications.
Myanmar Power Supply Market Growth Drivers
A variety of factors are contributing to the growth of the Myanmar Power Supply Market:
- The rising demand for electrification and urbanization is a significant driver. As more urban areas develop and expand, the need for stable power supply solutions becomes essential to support economic activities.
- The growth of the industrial sector is further fueling the demand for advanced power supply systems, as manufacturers require high-performance solutions to maintain operational efficiency and productivity.
- Consumer electronics are also adopting more sophisticated power supply options, leading to an increase in market demand. With the proliferation of electronic devices, reliable power supply becomes critical.
- Technological advancements in power management and distribution systems help improve the efficiency and reliability of power supply systems, making them more appealing to both consumers and businesses.
- The push for renewable energy integration is shaping the market landscape, as hybrid power systems combining traditional and renewable sources gain traction, fostering sustainability.
Myanmar Power Supply Market Challenges and Restraints
Despite the promising growth prospects, the Myanmar Power Supply Market is confronted with several challenges:
- Outdated infrastructure represents a significant hurdle. Many existing power distribution networks require substantial upgrades, which necessitate investment and strategic planning.
- The limited availability of advanced power supply technologies restricts market options, as companies struggle to source modern and efficient systems.
- High costs associated with upgrading infrastructure and implementing new technologies pose financial barriers for many stakeholders in the market.
- A lack of technical expertise further complicates the adoption of modern power supply solutions, hindering effective management and integration.
- Regulatory challenges can impede progress, as insufficient investment in modernization projects and unclear policy frameworks slow down the development of the power supply market.
Myanmar Power Supply Market Government Investment and Initiatives
The government of Myanmar is taking proactive measures to enhance the power supply landscape:
- Policies aimed at universal access to electricity are a key priority, with initiatives designed to improve infrastructure and expand electricity coverage across urban and rural areas.
- Investment incentives for power generation projects are being offered to attract both domestic and foreign capital, fostering an environment conducive to market growth.
- The establishment of regulatory frameworks for electricity pricing and grid connection facilitates a smoother integration of new power supply systems into the existing infrastructure.
- Rural electrification programs are being implemented to address the energy access gap and promote socio-economic development, particularly in underserved regions.
- Collaboration with international organizations can potentially enhance technical expertise and financial investment in modernizing Myanmar's power supply systems.
Myanmar Power Supply Market Latest Developments (May 2025 - June 2026)
Recent developments within the Myanmar Power Supply Market from May 2025 to June 2026 indicate a shifting landscape:
- Government initiatives aimed at renewable energy integration have gained momentum, leading to increased investments in solar and wind power projects across the region.
- Public-private partnerships have been emphasized as a strategy to modernize infrastructure, with various sectors collaborating to enhance electricity distribution systems.
- Technological innovations in power storage and management solutions are beginning to see adoption, as stakeholders recognize their importance in stabilizing supply and enhancing efficiency.
- Community-driven projects have emerged, focusing on localized power supply solutions to address specific regional needs, thereby increasing access to electricity.
- In response to rising demand for reliable power, ongoing training programs are being implemented to develop technical expertise within the workforce, facilitating smoother adoption of advanced technologies.
Myanmar Power Supply Market - Key Attractiveness of the Report
- 10 Years of Market Numbers
- Historical Data Starting from 2022 to 2025
- Base Year: 2025
- Forecast Data until 2032
- Key Performance Indicators Impacting the Market
- Major Upcoming Developments and Projects
Key Highlights of the Report:
- Myanmar Power Supply Market Outlook
- Market Size of Myanmar Power Supply Market, 2025
- Forecast of Myanmar Power Supply Market, 2032
- Historical Data and Forecast of Myanmar Power Supply Revenues & Volume for the Period 2022-2032F
- Myanmar Power Supply Market Trend Evolution
- Myanmar Power Supply Market Drivers and Challenges
- Myanmar Power Supply Price Trends
- Myanmar Power Supply Porter's Five Forces
- Myanmar Power Supply Industry Life Cycle
- Historical Data and Forecast of Myanmar Power Supply Market Revenues & Volume By Output Power for the Period 2022-2032F
- Historical Data and Forecast of Myanmar Power Supply Market Revenues & Volume By Power Supply With Low Output (500 W and Below) for the Period 2022-2032F
- Historical Data and Forecast of Myanmar Power Supply Market Revenues & Volume By Power Supply With Medium Output (500?1,000 W) for the Period 2022-2032F
- Historical Data and Forecast of Myanmar Power Supply Market Revenues & Volume By Power Supply With High Output (More Than 1,000 W) for the Period 2022-2032F
- Historical Data and Forecast of Myanmar Power Supply Market Revenues & Volume By Type for the Period 2022-2032F
- Historical Data and Forecast of Myanmar Power Supply Market Revenues & Volume By AC-DC Power Supply for the Period 2022-2032F
- Historical Data and Forecast of Myanmar Power Supply Market Revenues & Volume By DC-DC Power Supply for the Period 2022-2032F
- Historical Data and Forecast of Myanmar Power Supply Market Revenues & Volume By Vertical for the Period 2022-2032F
- Historical Data and Forecast of Myanmar Power Supply Market Revenues & Volume By Medical & Healthcare for the Period 2022-2032F
- Historical Data and Forecast of Myanmar Power Supply Market Revenues & Volume By Military & Aerospace for the Period 2022-2032F
- Historical Data and Forecast of Myanmar Power Supply Market Revenues & Volume By Telecommunications for the Period 2022-2032F
- Historical Data and Forecast of Myanmar Power Supply Market Revenues & Volume By Consumer Electronics for the Period 2022-2032F
- Historical Data and Forecast of Myanmar Power Supply Market Revenues & Volume By Transportation for the Period 2022-2032F
- Historical Data and Forecast of Myanmar Power Supply Market Revenues & Volume By Lighting for the Period 2022-2032F
- Historical Data and Forecast of Myanmar Power Supply Market Revenues & Volume By Food & Beverages for the Period 2022-2032F
- Historical Data and Forecast of Myanmar Power Supply Market Revenues & Volume By Industrial for the Period 2022-2032F
- Myanmar Power Supply Import Export Trade Statistics
- Market Opportunity Assessment By Output Power
- Market Opportunity Assessment By Type
- Market Opportunity Assessment By Vertical
- Myanmar Power Supply Top Companies Market Share
- Myanmar Power Supply Competitive Benchmarking By Technical and Operational Parameters
- Myanmar Power Supply Company Profiles
- Myanmar Power Supply Key Strategic Recommendations
Frequently Asked Questions About the Market Study (FAQs):
Growth is largely driven by rising urbanization, increasing demand for reliable power in industrial and consumer sectors, and the integration of renewable energy solutions.
Challenges include outdated infrastructure, high costs of upgrading technologies, regulatory hurdles, and a lack of technical expertise.
The government is promoting universal electricity access, providing investment incentives, and implementing rural electrification programs to enhance power supply infrastructure.
Recent developments highlight a focus on renewable energy projects, public-private partnerships for infrastructure modernization, and community-driven localized power solutions.
6Wresearch actively monitors the Myanmar Power Supply Market and publishes its comprehensive annual report, highlighting emerging trends, growth drivers, revenue analysis, and forecast outlook. Our insights help businesses to make data-backed strategic decisions with ongoing market dynamics. Our analysts track relevent industries related to the Myanmar Power Supply Market, allowing our clients with actionable intelligence and reliable forecasts tailored to emerging regional needs.
Yes, we provide customisation as per your requirements. To learn more, feel free to contact us on sales@6wresearch.com
1 Executive Summary |
2 Introduction |
2.1 Key Highlights of the Report |
2.2 Report Description |
2.3 Market Scope & Segmentation |
2.4 Research Methodology |
2.5 Assumptions |
3 Myanmar Power Supply Market Overview |
3.1 Myanmar Country Macro Economic Indicators |
3.2 Myanmar Power Supply Market Revenues & Volume, 2022 & 2032F |
3.3 Myanmar Power Supply Market - Industry Life Cycle |
3.4 Myanmar Power Supply Market - Porter's Five Forces |
3.5 Myanmar Power Supply Market Revenues & Volume Share, By Output Power, 2022 & 2032F |
3.6 Myanmar Power Supply Market Revenues & Volume Share, By Type, 2022 & 2032F |
3.7 Myanmar Power Supply Market Revenues & Volume Share, By Vertical, 2022 & 2032F |
4 Myanmar Power Supply Market Dynamics |
4.1 Impact Analysis |
4.2 Market Drivers |
4.3 Market Restraints |
5 Myanmar Power Supply Market Trends |
6 Myanmar Power Supply Market, By Types |
6.1 Myanmar Power Supply Market, By Output Power |
6.1.1 Overview and Analysis |
6.1.2 Myanmar Power Supply Market Revenues & Volume, By Output Power, 2022-2032F |
6.1.3 Myanmar Power Supply Market Revenues & Volume, By Power Supply With Low Output (500 W and Below), 2022-2032F |
6.1.4 Myanmar Power Supply Market Revenues & Volume, By Power Supply With Medium Output (500?1,000 W), 2022-2032F |
6.1.5 Myanmar Power Supply Market Revenues & Volume, By Power Supply With High Output (More Than 1,000 W), 2022-2032F |
6.2 Myanmar Power Supply Market, By Type |
6.2.1 Overview and Analysis |
6.2.2 Myanmar Power Supply Market Revenues & Volume, By AC-DC Power Supply, 2022-2032F |
6.2.3 Myanmar Power Supply Market Revenues & Volume, By DC-DC Power Supply, 2022-2032F |
6.3 Myanmar Power Supply Market, By Vertical |
6.3.1 Overview and Analysis |
6.3.2 Myanmar Power Supply Market Revenues & Volume, By Medical & Healthcare, 2022-2032F |
6.3.3 Myanmar Power Supply Market Revenues & Volume, By Military & Aerospace, 2022-2032F |
6.3.4 Myanmar Power Supply Market Revenues & Volume, By Telecommunications, 2022-2032F |
6.3.5 Myanmar Power Supply Market Revenues & Volume, By Consumer Electronics, 2022-2032F |
6.3.6 Myanmar Power Supply Market Revenues & Volume, By Transportation, 2022-2032F |
6.3.7 Myanmar Power Supply Market Revenues & Volume, By Lighting, 2022-2032F |
6.3.8 Myanmar Power Supply Market Revenues & Volume, By Industrial, 2022-2032F |
6.3.9 Myanmar Power Supply Market Revenues & Volume, By Industrial, 2022-2032F |
7 Myanmar Power Supply Market Import-Export Trade Statistics |
7.1 Myanmar Power Supply Market Export to Major Countries |
7.2 Myanmar Power Supply Market Imports from Major Countries |
8 Myanmar Power Supply Market Key Performance Indicators |
9 Myanmar Power Supply Market - Opportunity Assessment |
9.1 Myanmar Power Supply Market Opportunity Assessment, By Output Power, 2022 & 2032F |
9.2 Myanmar Power Supply Market Opportunity Assessment, By Type, 2022 & 2032F |
9.3 Myanmar Power Supply Market Opportunity Assessment, By Vertical, 2022 & 2032F |
10 Myanmar Power Supply Market - Competitive Landscape |
10.1 Myanmar Power Supply Market Revenue Share, By Companies, 2025 |
10.2 Myanmar Power Supply Market Competitive Benchmarking, By Operating and Technical Parameters |
11 Company Profiles |
12 Recommendations |
13 Disclaimer |
Global Go To Market Strategy - 2030
Export potential enables firms to identify high-growth global markets with greater confidence by combining advanced trade intelligence with a structured quantitative methodology. The framework analyzes emerging demand trends and country-level import patterns while integrating macroeconomic and trade datasets such as GDP and population forecasts, bilateral import–export flows, tariff structures, elasticity differentials between developed and developing economies, geographic distance, and import demand projections. Using weighted trade values from 2020–2024 as the base period to project country-to-country export potential for 2030, these inputs are operationalized through calculated drivers such as gravity model parameters, tariff impact factors, and projected GDP per-capita growth. Through an analysis of hidden potentials, demand hotspots, and market conditions that are most favorable to success, this method enables firms to focus on target countries, maximize returns, and global expansion with data, backed by accuracy.
By factoring in the projected importer demand gap that is currently unmet and could be potential opportunity, it identifies the potential for the Exporter (Country) among 190 countries, against the general trade analysis, which identifies the biggest importer or exporter.
To discover high-growth global markets and optimize your business strategy:
Click Here
Pricing
- Single User License$ 1,995
- Department License$ 2,400
- Site License$ 3,120
- Global License$ 3,795

Leadership Perspectives from Industry Events
Search
Thought Leadership and Analyst Meet


Our Clients
6WResearch In News
- India Air Conditioner Market Set for Strong Rebound in 2026 After Weather-Led Correction and GST-Driven Recovery: 6Wresearch
- ADAS in India: How Automatic Emergency Braking, Blind Spot Detection & Driver Monitoring are Transforming Road Safety
- Doha a strategic location for EV manufacturing hub: IPA Qatar
- Demand for luxury TVs surging in the GCC, says Samsung
- Empowering Growth: The Thriving Journey of Bangladesh’s Cable Industry
- Demand for luxury TVs surging in the GCC, says Samsung
Latest Reports
- Nicaragua RPG Gaming Market (2026-2032)
- New Zealand RPG Gaming Market (2026-2032)
- Netherlands RPG Gaming Market (2026-2032)
- Nauru RPG Gaming Market (2026-2032)
- Namibia RPG Gaming Market (2026-2032)
- Mozambique RPG Gaming Market (2026-2032)
- Montenegro RPG Gaming Market (2026-2032)
- Mongolia RPG Gaming Market (2026-2032)
- Monaco RPG Gaming Market (2026-2032)
- Micronesia RPG Gaming Market (2026-2032)
Industry Events and Analyst Meet

HIMTEX 2026

India Refining Summit 2026

India EV Show 2026

EV tech India Expo 2026

Auto Tech Asia 2026
Whitepaper
- Middle East & Africa Commercial Security Market Click here to view more.
- Middle East & Africa Fire Safety Systems & Equipment Market Click here to view more.
- GCC Drone Market Click here to view more.
- Middle East Lighting Fixture Market Click here to view more.
- GCC Physical & Perimeter Security Market Click here to view more.