Myanmar Rubber Transmission Belts Market (2026-2032) | Share, Forecast, Outlook, Value, Analysis, Revenue, Size, Trends, Companies, Growth & Industry
Market Forecast By Product (Raw Edged Belts, V-belts, Timing Belts, Wrapped Belts, Specialty Belts, Others), By Application (Industrial, Automotive Components, Agricultural Equipment, Mining, Others) And Competitive Landscape
| Product Code: ETC030114 | Publication Date: Oct 2020 | Updated Date: Jun 2026 | Product Type: Report | |
| Publisher: 6Wresearch | Author: Shubham Deep | No. of Pages: 70 | No. of Figures: 35 | No. of Tables: 5 |
Myanmar Rubber Transmission Belts Market Summary
The myanmar rubber transmission belts market was estimated at USD 436 Million in 2025 and is projected to reach USD 619 Million by 2032, growing at a CAGR of 5.8% from 2026 to 2032.
Myanmar Rubber Transmission Belts Market Growth Rate Analysis (2021-2032)
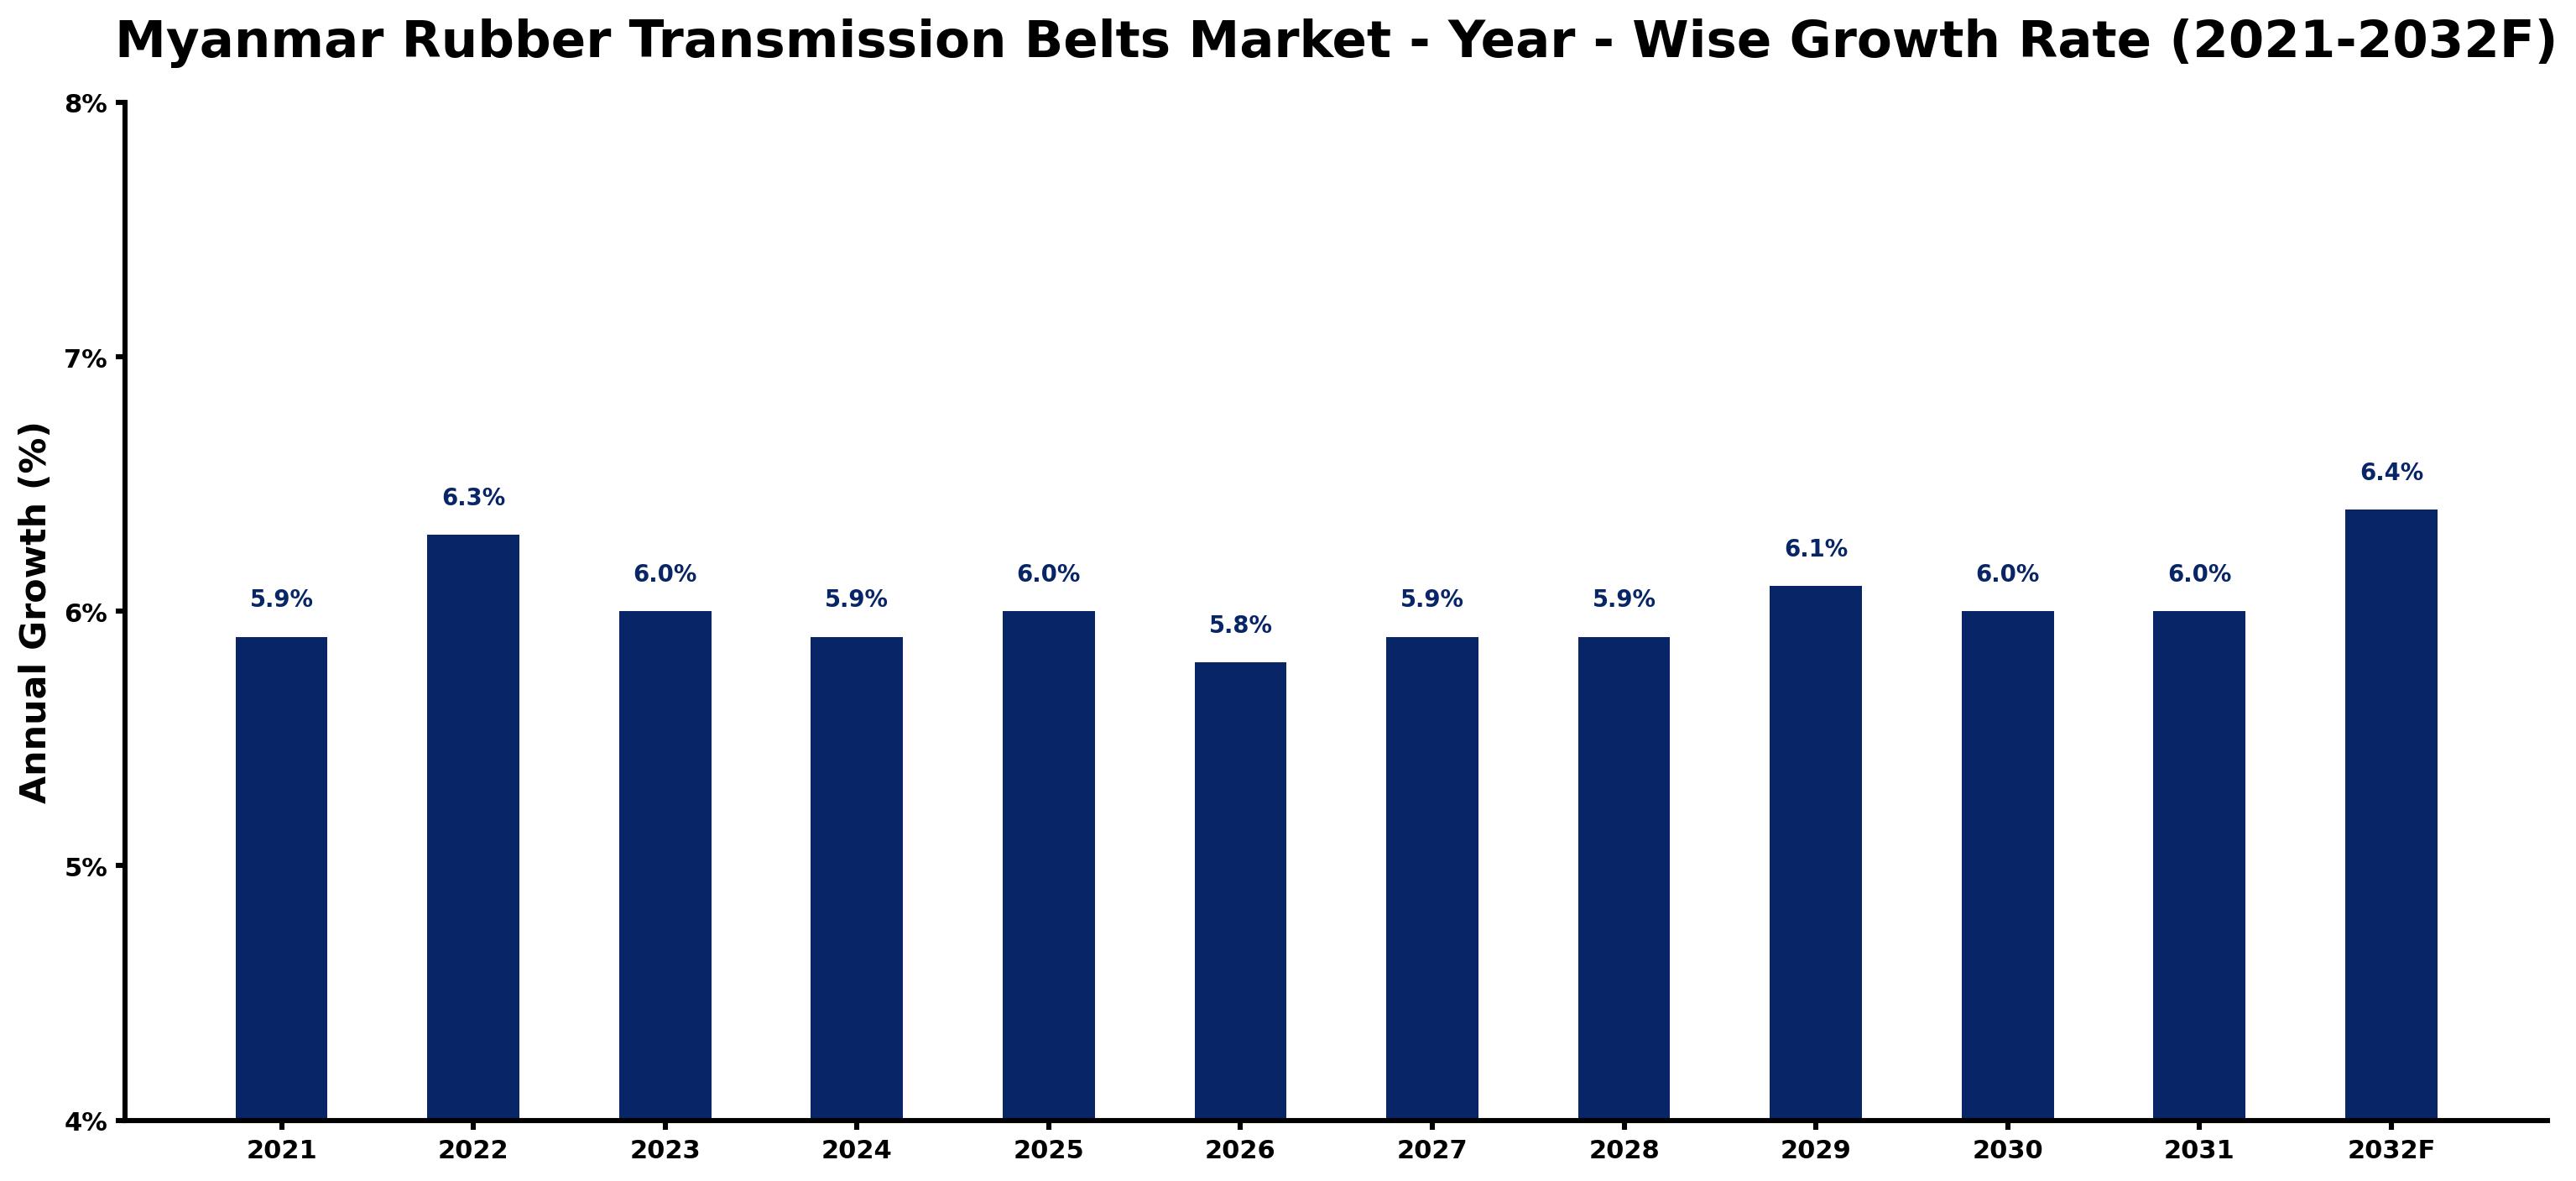
The Myanmar rubber transmission belts market has exhibited stable growth, marked by a 5.9% increase in 2021, rising to 6.3% in 2022. This upward trend, supported by a surge in manufacturing and construction sectors, reflects an expanding demand for reliable machinery components. Although growth slightly fluctuated to 6.0% in 2023 and 5.9% in 2024, it stabilized with a steady 6.1% by 2029, driven by investments in local infrastructure and digitalization efforts that enhance operational efficiencies. The market anticipates a peak growth of 6.4% in 2032, as businesses increasingly prioritize rubber belts for their durability and performance in various industrial applications, solidifying their role in the region's economic recovery and energy transition strategies.
Myanmar Rubber Transmission Belts Market Year-wise Growth Rate and Key Drivers
This graph highlights how the Myanmar Rubber Transmission Belts Market has steadily grown over the past five years, supported by major growth factors.
The table below presents the year wise growth rates along with the key drivers influencing the market
| Year | Growth Rate | Major Drivers |
| 2021 | 5.9% | Manufacturing sectors began recovering from COVID-19, increasing demand for rubber belts. |
| 2022 | 6.3% | Infrastructure projects accelerated, leading to higher consumption of rubber transmission belts. |
| 2023 | 6.0% | Local manufacturers invested in capacity expansion, enhancing product availability across markets. |
| 2024 | 5.9% | Export opportunities grew as Myanmar established trade partnerships with regional industries. |
| 2025 | 6.0% | Technological upgrades in production boosted the quality and performance of rubber belts. |
| 2026 | 5.8% | Retail channels diversified, creating a need for specialized rubber drive solutions. |
| 2027 | 5.9% | Developments in the automotive industry increased requirements for durable transmission belts. |
| 2028 | 5.9% | Construction sector growth prompted demand for heavy machinery utilizing rubber belts. |
| 2029 | 6.1% | Increased agricultural mechanization stimulated demand for rubber transmission across farming equipment. |
| 2030 | 6.0% | Global focus on sustainability encouraged eco-friendly rubber belt innovations in Myanmar. |
| 2031 | 6.0% | Energy sector expansion led to heightened need for reliable rubber transmission systems. |
| 2032 | 6.4% | Regional competition intensified, driving local brands to enhance quality and reduce costs. |
Note - Market size estimations and growth projections presented in this report are based on 6Wresearch's advanced forecasting approach, validated with industry datasets as of June 2026.
Myanmar Rubber Transmission Belts Market Synopsis
The Myanmar Rubber Transmission Belts Market is projected to reach 5.8% and witness significant growth during the forecast period (2026-2032). This expansion is primarily driven by rising industrial activities, increased infrastructural development, and a growing demand across various sectors such as automotive, agriculture, and manufacturing. The increasing reliance on these belts for effective power transmission is shaping the market dynamics, supported by ongoing government initiatives aimed at enhancing the industrial landscape of Myanmar.
Myanmar Rubber Transmission Belts Market Growth Drivers
The demand for rubber transmission belts is surging due to several key growth drivers within the Myanmar Rubber Transmission Belts Market. The following factors are instrumental in this upward trend:
- The automotive sector's expansion is leading to higher requirements for reliable power transmission solutions, thereby boosting the demand for rubber transmission belts.
- Agricultural mechanization is increasingly adopted in Myanmar, necessitating durable belts that can withstand the rigors of farming machinery.
- Manufacturing activities are on the rise, with businesses seeking efficient and long-lasting transmission solutions to enhance productivity and minimize downtime.
- Innovation in product development, including the introduction of lightweight and energy-efficient belts, caters to evolving customer needs while improving operational efficiencies.
- Government-led initiatives aim to fortify the industrial sector, creating a favorable business environment for the growth of rubber transmission belts.
Myanmar Rubber Transmission Belts Market Trends and Opportunities
The Myanmar Rubber Transmission Belts Market is characterized by distinct trends that present substantial opportunities for growth. Key trends include:
- A growing emphasis on efficiency is influencing the demand for high-performance rubber transmission belts that reduce maintenance costs and improve overall productivity.
- Market players are increasingly investing in product innovation, focusing on eco-friendly materials that align with global sustainability trends.
- The rising awareness of the benefits associated with high-quality rubber transmission belts is driving adoption among various sectors.
- There is a notable trend toward the integration of advanced technologies in manufacturing processes to enhance product quality and performance.
- Collaborations and partnerships between local suppliers and manufacturers are anticipated to strengthen market positioning and expand product offerings.
Myanmar Rubber Transmission Belts Market Challenges and Restraints
Despite the positive outlook, the Myanmar Rubber Transmission Belts Market faces several challenges that may hinder growth. These include:
- Limited technological advancements result in product quality that is often not competitive with international standards, affecting market attractiveness.
- Inadequate infrastructure and logistical challenges hinder the efficient distribution of rubber transmission belts, impacting supply chain effectiveness.
- A shortage of skilled labor in the rubber belt manufacturing sector could lead to quality control issues and delays in production.
- Fluctuating raw material prices create uncertainty for manufacturers, affecting profitability and investment decisions.
- Intense competition from alternative materials may limit market share for rubber transmission belts, necessitating ongoing innovation and differentiation.
Myanmar Rubber Transmission Belts Market Investment Opportunities
The Myanmar Rubber Transmission Belts Market offers several attractive opportunities for investors looking to penetrate the burgeoning industrial landscape. Significant areas of opportunity include:
- Investing in manufacturing facilities to meet the growing demand for rubber transmission belts across multiple sectors, including automotive and agriculture.
- Establishing partnerships with local distributors can facilitate market entry and help to expand reach within the region.
- Focusing on technology investments that enhance product quality and operational efficiency is crucial for capturing market share.
- Exploring export opportunities to foreign markets can diversify revenue streams and bolster profitability amid local market challenges.
- Engaging in skill development initiatives can bridge the labor gap, enhancing production capabilities and fostering quality assurance.
Myanmar Rubber Transmission Belts Market Government Investment and Initiatives
The Myanmar government has instituted several policies aimed at fostering growth in the rubber transmission belts industry. Key initiatives include:
- Providing financial incentives to local manufacturers to improve production capabilities and encourage domestic output.
- Implementing quality control standards that align with international benchmarks, enhancing the competitiveness of Myanmar's rubber products.
- Facilitating trade agreements that expand market access for domestic manufacturers to reach international markets.
- Investing in infrastructure development to improve logistical capabilities, aiding in the efficient distribution of rubber transmission belts.
- Encouraging research and development to promote innovation in the rubber industry, thereby supporting technological advancements.
Myanmar Rubber Transmission Belts Market Latest Developments (May 2025 - June 2026)
Recent developments within the Myanmar Rubber Transmission Belts Market reflect a proactive approach toward addressing industry challenges and leveraging growth opportunities. Key industry directions during this period include:
- Increased collaboration between government and private sectors to enhance manufacturing capabilities and improve product standards.
- Emerging trends in sustainability are prompting manufacturers to adopt eco-friendly practices in rubber production.
- A continued focus on research and innovation is seen as critical to maintaining competitiveness in both domestic and international markets.
- Investment in infrastructure projects aimed at easing transportation challenges for rubber belts is gaining momentum.
- The government's emphasis on attracting foreign investment is evident in policy reforms designed to create a more conducive business environment.
Myanmar Rubber Transmission Belts Market - Key Attractiveness of the Report
- 10 Years of Market Numbers
- Historical Data Starting from 2022 to 2025
- Base Year: 2025
- Forecast Data until 2032
- Key Performance Indicators Impacting the Market
- Major Upcoming Developments and Projects
Key Highlights of the Report:
- Myanmar Rubber Transmission Belts Market Outlook
- Market Size of Myanmar Rubber Transmission Belts Market, 2025
- Forecast of Myanmar Rubber Transmission Belts Market, 2032F
- Historical Data and Forecast of Myanmar Rubber Transmission Belts Revenues & Volume for the Period 2022-2032F
- Myanmar Rubber Transmission Belts Market Trend Evolution
- Myanmar Rubber Transmission Belts Market Drivers and Challenges
- Myanmar Rubber Transmission Belts Price Trends
- Myanmar Rubber Transmission Belts Porter's Five Forces
- Myanmar Rubber Transmission Belts Industry Life Cycle
- Historical Data and Forecast of Myanmar Rubber Transmission Belts Market Revenues & Volume By Product for the Period 2022-2032F
- Historical Data and Forecast of Myanmar Rubber Transmission Belts Market Revenues & Volume By Raw Edged Belts for the Period 2022-2032F
- Historical Data and Forecast of Myanmar Rubber Transmission Belts Market Revenues & Volume By V-belts for the Period 2022-2032F
- Historical Data and Forecast of Myanmar Rubber Transmission Belts Market Revenues & Volume By Timing Belts for the Period 2022-2032F
- Historical Data and Forecast of Myanmar Rubber Transmission Belts Market Revenues & Volume By Wrapped Belts for the Period 2022-2032F
- Historical Data and Forecast of Myanmar Rubber Transmission Belts Market Revenues & Volume By Specialty Belts for the Period 2022-2032F
- Historical Data and Forecast of Myanmar Rubber Transmission Belts Market Revenues & Volume By Others for the Period 2022-2032F
- Historical Data and Forecast of Myanmar Rubber Transmission Belts Market Revenues & Volume By Application for the Period 2022-2032F
- Historical Data and Forecast of Myanmar Rubber Transmission Belts Market Revenues & Volume By Industrial for the Period 2022-2032F
- Historical Data and Forecast of Myanmar Rubber Transmission Belts Market Revenues & Volume By Automotive Components for the Period 2022-2032F
- Historical Data and Forecast of Myanmar Rubber Transmission Belts Market Revenues & Volume By Agricultural Equipment for the Period 2022-2032F
- Historical Data and Forecast of Myanmar Rubber Transmission Belts Market Revenues & Volume By Mining for the Period 2022-2032F
- Historical Data and Forecast of Myanmar Rubber Transmission Belts Market Revenues & Volume By Others for the Period 2022-2032F
- Myanmar Rubber Transmission Belts Import Export Trade Statistics
- Market Opportunity Assessment By Product
- Market Opportunity Assessment By Application
- Myanmar Rubber Transmission Belts Top Companies Market Share
- Myanmar Rubber Transmission Belts Competitive Benchmarking By Technical and Operational Parameters
- Myanmar Rubber Transmission Belts Company Profiles
- Myanmar Rubber Transmission Belts Key Strategic Recommendations
Frequently Asked Questions About the Market Study (FAQs):
The growth in the Myanmar Rubber Transmission Belts Market is primarily driven by increasing industrial activities, particularly in the automotive and agricultural sectors, coupled with governmental support for infrastructure development.
Challenges include limited technological advancements, inadequate infrastructure, and fluctuating raw material prices, all of which could impact market competitiveness and growth potential.
Investment opportunities exist in manufacturing, technology upgrades, and forming strategic partnerships with local distributors to enhance market reach and efficiency.
The government supports the market through financial incentives for local manufacturers, implementation of quality control standards, and infrastructural improvements aimed at boosting the overall industrial sector.
6Wresearch actively monitors the Myanmar Rubber Transmission Belts Market and publishes its comprehensive annual report, highlighting emerging trends, growth drivers, revenue analysis, and forecast outlook. Our insights help businesses to make data-backed strategic decisions with ongoing market dynamics. Our analysts track relevent industries related to the Myanmar Rubber Transmission Belts Market, allowing our clients with actionable intelligence and reliable forecasts tailored to emerging regional needs.
Yes, we provide customisation as per your requirements. To learn more, feel free to contact us on sales@6wresearch.com
1 Executive Summary |
2 Introduction |
2.1 Key Highlights of the Report |
2.2 Report Description |
2.3 Market Scope & Segmentation |
2.4 Research Methodology |
2.5 Assumptions |
3 Myanmar Rubber Transmission Belts Market Overview |
3.1 Myanmar Country Macro Economic Indicators |
3.2 Myanmar Rubber Transmission Belts Market Revenues & Volume, 2022 & 2032F |
3.3 Myanmar Rubber Transmission Belts Market - Industry Life Cycle |
3.4 Myanmar Rubber Transmission Belts Market - Porter's Five Forces |
3.5 Myanmar Rubber Transmission Belts Market Revenues & Volume Share, By Product, 2022 & 2032F |
3.6 Myanmar Rubber Transmission Belts Market Revenues & Volume Share, By Application, 2022 & 2032F |
4 Myanmar Rubber Transmission Belts Market Dynamics |
4.1 Impact Analysis |
4.2 Market Drivers |
4.3 Market Restraints |
5 Myanmar Rubber Transmission Belts Market Trends |
6 Myanmar Rubber Transmission Belts Market, By Types |
6.1 Myanmar Rubber Transmission Belts Market, By Product |
6.1.1 Overview and Analysis |
6.1.2 Myanmar Rubber Transmission Belts Market Revenues & Volume, By Product, 2022-2032F |
6.1.3 Myanmar Rubber Transmission Belts Market Revenues & Volume, By Raw Edged Belts, 2022-2032F |
6.1.4 Myanmar Rubber Transmission Belts Market Revenues & Volume, By V-belts, 2022-2032F |
6.1.5 Myanmar Rubber Transmission Belts Market Revenues & Volume, By Timing Belts, 2022-2032F |
6.1.6 Myanmar Rubber Transmission Belts Market Revenues & Volume, By Wrapped Belts, 2022-2032F |
6.1.7 Myanmar Rubber Transmission Belts Market Revenues & Volume, By Specialty Belts, 2022-2032F |
6.1.8 Myanmar Rubber Transmission Belts Market Revenues & Volume, By Others, 2022-2032F |
6.2 Myanmar Rubber Transmission Belts Market, By Application |
6.2.1 Overview and Analysis |
6.2.2 Myanmar Rubber Transmission Belts Market Revenues & Volume, By Industrial, 2022-2032F |
6.2.3 Myanmar Rubber Transmission Belts Market Revenues & Volume, By Automotive Components, 2022-2032F |
6.2.4 Myanmar Rubber Transmission Belts Market Revenues & Volume, By Agricultural Equipment, 2022-2032F |
6.2.5 Myanmar Rubber Transmission Belts Market Revenues & Volume, By Mining, 2022-2032F |
6.2.6 Myanmar Rubber Transmission Belts Market Revenues & Volume, By Others, 2022-2032F |
7 Myanmar Rubber Transmission Belts Market Import-Export Trade Statistics |
7.1 Myanmar Rubber Transmission Belts Market Export to Major Countries |
7.2 Myanmar Rubber Transmission Belts Market Imports from Major Countries |
8 Myanmar Rubber Transmission Belts Market Key Performance Indicators |
9 Myanmar Rubber Transmission Belts Market - Opportunity Assessment |
9.1 Myanmar Rubber Transmission Belts Market Opportunity Assessment, By Product, 2022 & 2032F |
9.2 Myanmar Rubber Transmission Belts Market Opportunity Assessment, By Application, 2022 & 2032F |
10 Myanmar Rubber Transmission Belts Market - Competitive Landscape |
10.1 Myanmar Rubber Transmission Belts Market Revenue Share, By Companies, 2025 |
10.2 Myanmar Rubber Transmission Belts Market Competitive Benchmarking, By Operating and Technical Parameters |
11 Company Profiles |
12 Recommendations |
13 Disclaimer |
Global Go To Market Strategy - 2030
Export potential enables firms to identify high-growth global markets with greater confidence by combining advanced trade intelligence with a structured quantitative methodology. The framework analyzes emerging demand trends and country-level import patterns while integrating macroeconomic and trade datasets such as GDP and population forecasts, bilateral import–export flows, tariff structures, elasticity differentials between developed and developing economies, geographic distance, and import demand projections. Using weighted trade values from 2020–2024 as the base period to project country-to-country export potential for 2030, these inputs are operationalized through calculated drivers such as gravity model parameters, tariff impact factors, and projected GDP per-capita growth. Through an analysis of hidden potentials, demand hotspots, and market conditions that are most favorable to success, this method enables firms to focus on target countries, maximize returns, and global expansion with data, backed by accuracy.
By factoring in the projected importer demand gap that is currently unmet and could be potential opportunity, it identifies the potential for the Exporter (Country) among 190 countries, against the general trade analysis, which identifies the biggest importer or exporter.
To discover high-growth global markets and optimize your business strategy:
Click Here
Pricing
- Single User License$ 1,995
- Department License$ 2,400
- Site License$ 3,120
- Global License$ 3,795

Leadership Perspectives from Industry Events
Search
Thought Leadership and Analyst Meet


Our Clients
6WResearch In News
- India Air Conditioner Market Set for Strong Rebound in 2026 After Weather-Led Correction and GST-Driven Recovery: 6Wresearch
- ADAS in India: How Automatic Emergency Braking, Blind Spot Detection & Driver Monitoring are Transforming Road Safety
- Doha a strategic location for EV manufacturing hub: IPA Qatar
- Demand for luxury TVs surging in the GCC, says Samsung
- Empowering Growth: The Thriving Journey of Bangladesh’s Cable Industry
- Demand for luxury TVs surging in the GCC, says Samsung
Latest Reports
- Nicaragua RPG Gaming Market (2026-2032)
- New Zealand RPG Gaming Market (2026-2032)
- Netherlands RPG Gaming Market (2026-2032)
- Nauru RPG Gaming Market (2026-2032)
- Namibia RPG Gaming Market (2026-2032)
- Mozambique RPG Gaming Market (2026-2032)
- Montenegro RPG Gaming Market (2026-2032)
- Mongolia RPG Gaming Market (2026-2032)
- Monaco RPG Gaming Market (2026-2032)
- Micronesia RPG Gaming Market (2026-2032)
Industry Events and Analyst Meet

HIMTEX 2026

India Refining Summit 2026

India EV Show 2026

EV tech India Expo 2026

Auto Tech Asia 2026
Whitepaper
- Middle East & Africa Commercial Security Market Click here to view more.
- Middle East & Africa Fire Safety Systems & Equipment Market Click here to view more.
- GCC Drone Market Click here to view more.
- Middle East Lighting Fixture Market Click here to view more.
- GCC Physical & Perimeter Security Market Click here to view more.