Myanmar Salt Market (2025-2031) Outlook | Value, Revenue, Analysis, Trends, Companies, Forecast, Industry, Size, Growth & Share
Market Forecast By Type (Rock Salt, Brine, Solar Salt, Others), By Applications (Chemical Processing, Road De-icing, Food Processing, Others) And Competitive Landscape
| Product Code: ETC074513 | Publication Date: Jun 2021 | Updated Date: Jun 2025 | Product Type: Report | |
| Publisher: 6Wresearch | Author: Sumit Sagar | No. of Pages: 70 | No. of Figures: 35 | No. of Tables: 5 |
Myanmar Salt Market Size Growth Rate
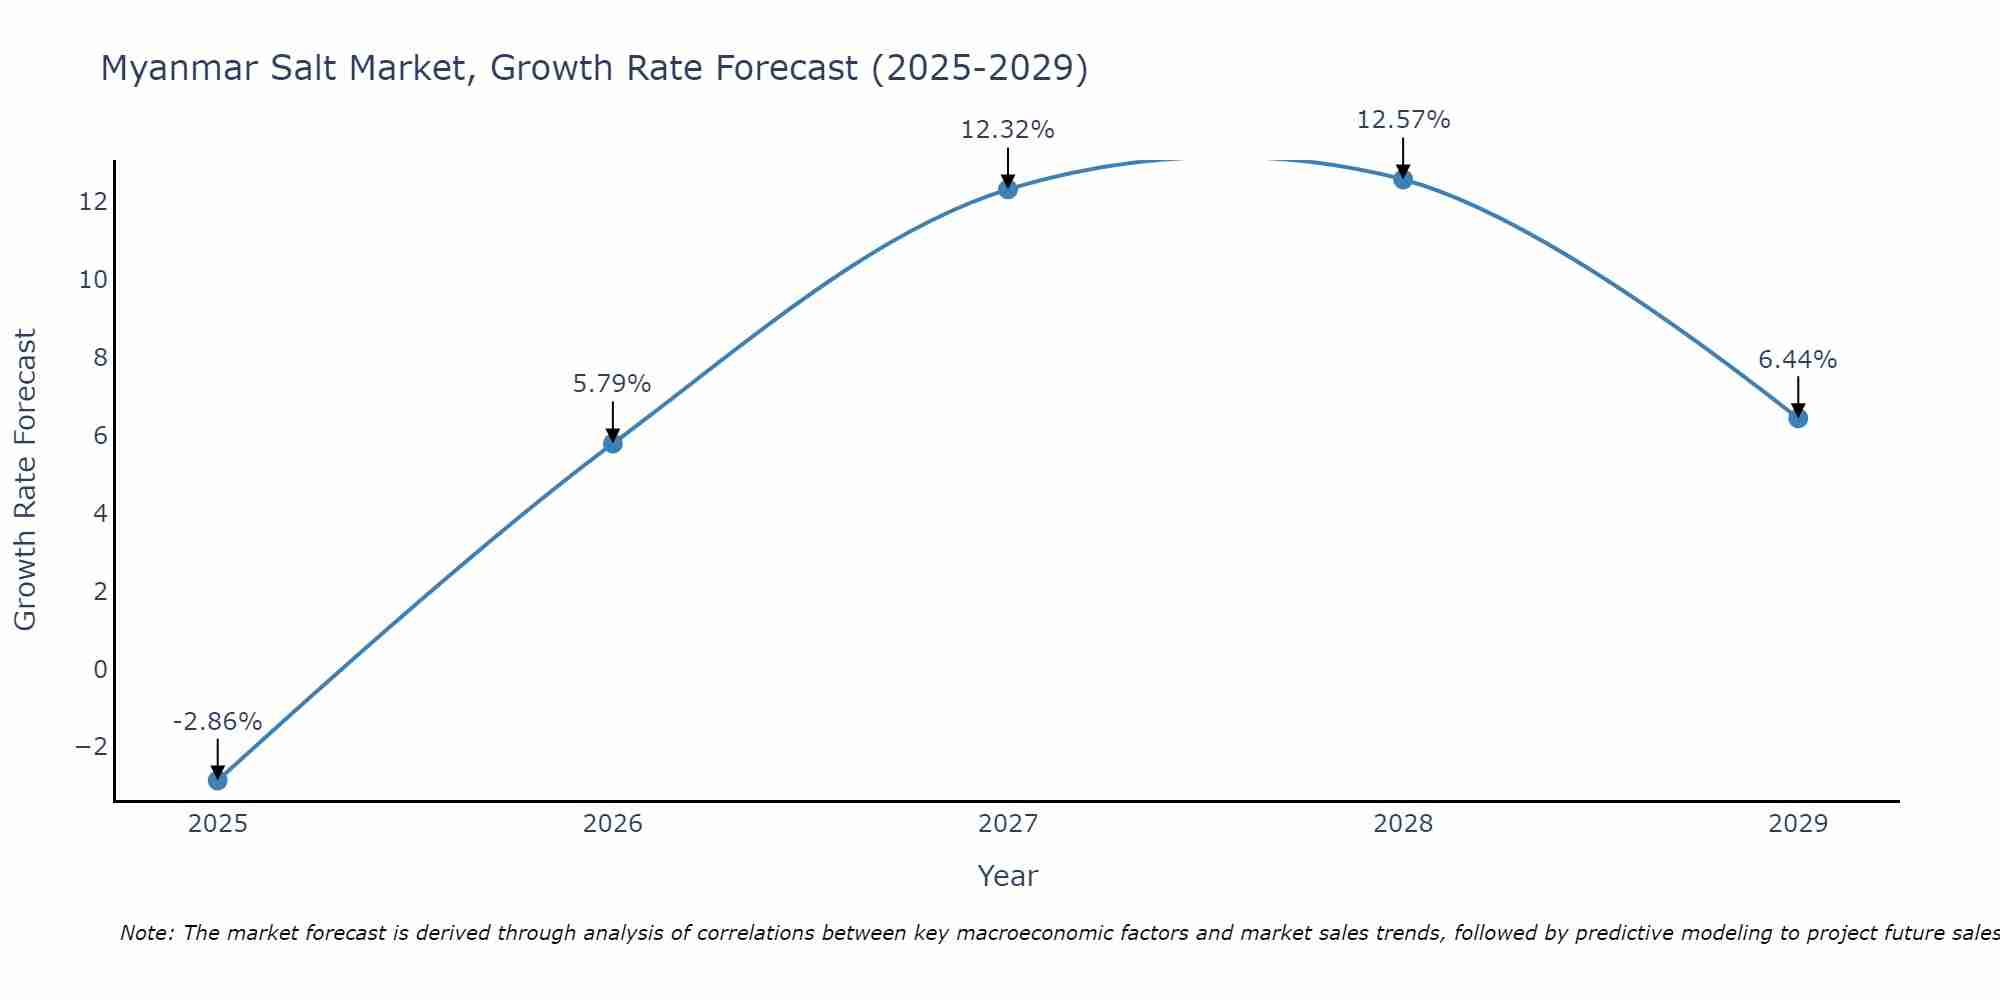
The Myanmar Salt Market is projected to witness mixed growth rate patterns during 2025 to 2029. The growth rate begins at -2.86% in 2025, climbs to a high of 12.57% in 2028, and moderates to 6.44% by 2029.
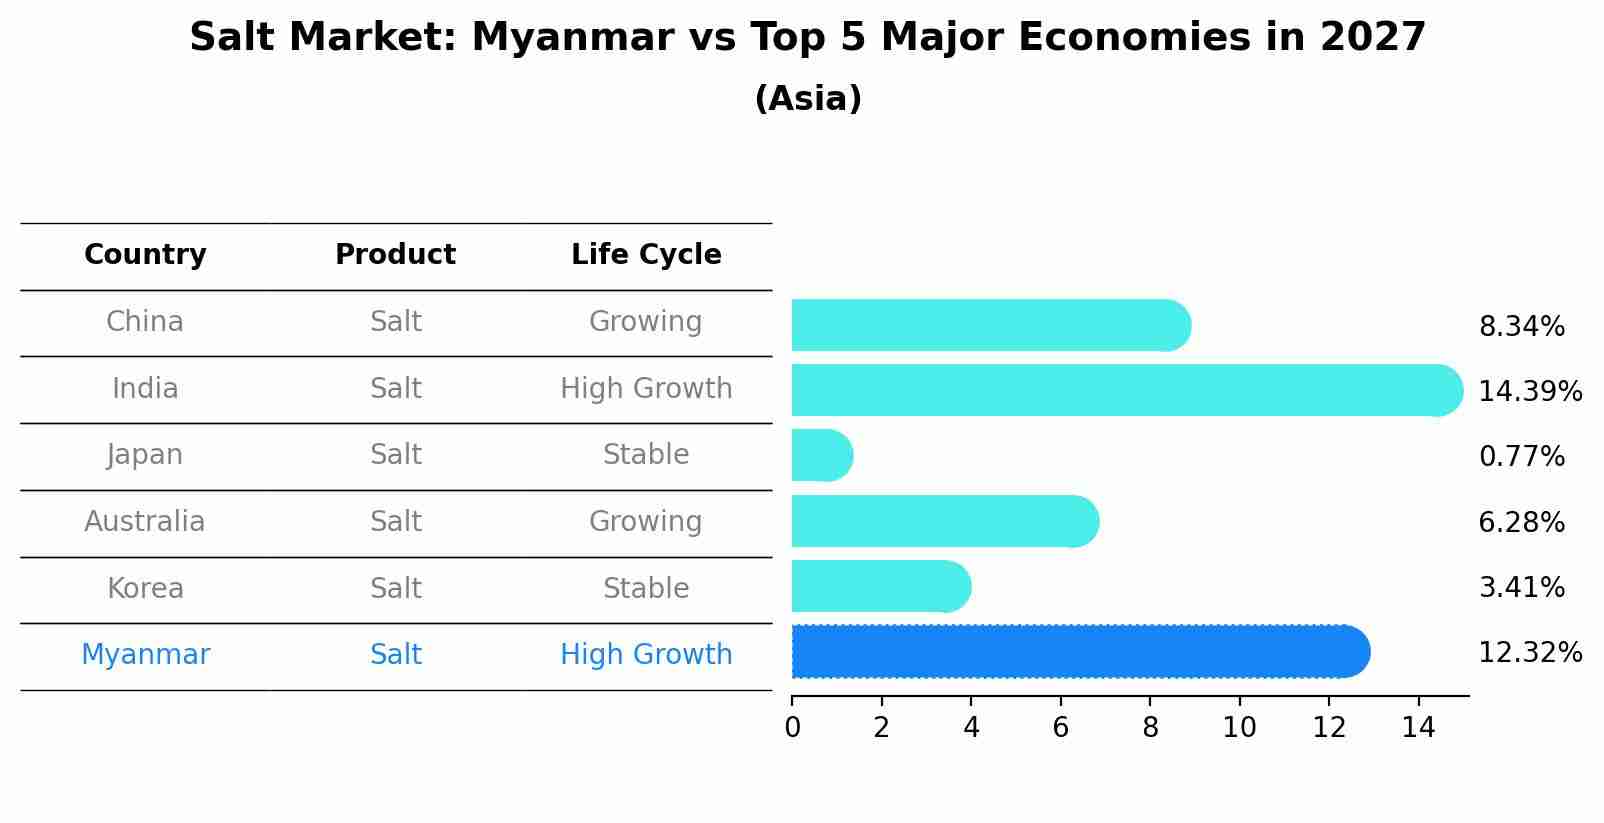
Salt Market: Myanmar vs Top 5 Major Economies in 2027 (Asia)
In the Asia region, the Salt market in Myanmar is projected to expand at a high growth rate of 12.32% by 2027. The largest economy is China, followed by India, Japan, Australia and South Korea.
Myanmar Salt Market Overview
The Myanmar salt market is primarily driven by local production and consumption, with minimal reliance on imports. Salt production in Myanmar is mainly concentrated in coastal regions such as Rakhine State and Tanintharyi Region, utilizing traditional methods of salt farming. The market is characterized by a mix of small-scale farmers and larger commercial producers. Household consumption remains a significant portion of the market demand, with salt being a staple ingredient in Myanmar cuisine. However, increasing health awareness and changing consumer preferences are leading to a shift towards iodized salt. The market is also influenced by government regulations aimed at promoting iodized salt consumption to address iodine deficiency disorders. Overall, the Myanmar salt market is expected to experience steady growth driven by both domestic demand and potential for export opportunities.
Myanmar Salt Market Trends
The Myanmar salt market is experiencing several key trends. One significant trend is the increasing demand for iodized salt due to government initiatives to combat iodine deficiency disorders. Another trend is the growing popularity of organic and natural salts, driven by consumer preferences for healthier and environmentally friendly products. Additionally, there is a rising interest in gourmet salts, such as Himalayan pink salt or sea salt, among consumers looking to enhance the flavor of their dishes. The market is also witnessing a shift towards online retail channels for salt purchase, as e-commerce platforms become more prevalent in Myanmar. Overall, these trends indicate a dynamic and evolving salt market in Myanmar catering to diverse consumer needs and preferences.
Myanmar Salt Market Challenges
In the Myanmar Salt Market, challenges include lack of modernization and technology adoption in salt production, leading to low efficiency and inconsistent quality. Additionally, the industry is highly fragmented with many small-scale producers, resulting in limited economies of scale and distribution challenges. Competition from imported salt, particularly from neighboring countries, poses a threat to local producers. Inadequate infrastructure and logistical constraints further hinder market growth and competitiveness. Regulatory issues, such as government controls on salt production and distribution, also impact the market dynamics. Overall, the Myanmar Salt Market faces obstacles related to production methods, market structure, competition, infrastructure, and regulatory environment, which need to be addressed for sustainable growth and development.
Myanmar Salt Market Investment Opportunities
The Myanmar Salt Market presents various investment opportunities due to its growing demand driven by the food processing, chemical, and textile industries. With a significant portion of salt consumption in Myanmar coming from imports, there is potential for investors to establish salt production facilities within the country to cater to the domestic market. Additionally, advancements in technology and automation can enhance production efficiency and quality, offering opportunities for investment in modernizing existing salt production processes. Furthermore, there is a growing trend towards organic and specialty salts in the market, creating avenues for investors to introduce innovative products to meet evolving consumer preferences. Overall, investing in the Myanmar Salt Market can be lucrative by tapping into the increasing demand and diversifying product offerings to capture a larger market share.
Myanmar Salt Market Government Policy
Government policies in Myanmar related to the salt market include the Salt Law, which regulates the production, distribution, and pricing of salt. Under this law, salt production is controlled by the government to ensure quality and prevent illegal production. The government also imposes tariffs on imported salt to protect the local market. Additionally, there are restrictions on the sale and distribution of salt to prevent hoarding and price manipulation. The government aims to maintain a stable salt market, ensure fair pricing for consumers, and support local salt producers through these policies. Overall, the government plays a significant role in regulating and overseeing the salt market in Myanmar to promote industry growth and protect consumer interests.
Myanmar Salt Market Future Outlook
The future outlook for the Myanmar Salt Market appears promising, driven by factors such as increasing urbanization, population growth, and rising disposable incomes. The growing demand for salt in various industries including food processing, chemical, and pharmaceutical sectors is expected to fuel market growth. Additionally, the expanding tourism industry in Myanmar is likely to boost the consumption of salt in the hospitality sector. However, challenges such as limited production capacity, fluctuating raw material prices, and competition from imported salt products may impact market growth. Overall, with strategic investments in infrastructure, technology, and distribution channels, the Myanmar Salt Market is anticipated to witness steady growth in the coming years.
Key Highlights of the Report:
- Myanmar Salt Market Outlook
- Market Size of Myanmar Salt Market, 2021
- Forecast of Myanmar Salt Market, 2031
- Historical Data and Forecast of Myanmar Salt Revenues & Volume for the Period 2021 - 2031
- Myanmar Salt Market Trend Evolution
- Myanmar Salt Market Drivers and Challenges
- Myanmar Salt Price Trends
- Myanmar Salt Porter's Five Forces
- Myanmar Salt Industry Life Cycle
- Historical Data and Forecast of Myanmar Salt Market Revenues & Volume By Type for the Period 2021 - 2031
- Historical Data and Forecast of Myanmar Salt Market Revenues & Volume By Rock Salt for the Period 2021 - 2031
- Historical Data and Forecast of Myanmar Salt Market Revenues & Volume By Brine for the Period 2021 - 2031
- Historical Data and Forecast of Myanmar Salt Market Revenues & Volume By Solar Salt for the Period 2021 - 2031
- Historical Data and Forecast of Myanmar Salt Market Revenues & Volume By Others for the Period 2021 - 2031
- Historical Data and Forecast of Myanmar Salt Market Revenues & Volume By Applications for the Period 2021 - 2031
- Historical Data and Forecast of Myanmar Salt Market Revenues & Volume By Chemical Processing for the Period 2021 - 2031
- Historical Data and Forecast of Myanmar Salt Market Revenues & Volume By Road De-icing for the Period 2021 - 2031
- Historical Data and Forecast of Myanmar Salt Market Revenues & Volume By Food Processing for the Period 2021 - 2031
- Historical Data and Forecast of Myanmar Salt Market Revenues & Volume By Others for the Period 2021 - 2031
- Myanmar Salt Import Export Trade Statistics
- Market Opportunity Assessment By Type
- Market Opportunity Assessment By Applications
- Myanmar Salt Top Companies Market Share
- Myanmar Salt Competitive Benchmarking By Technical and Operational Parameters
- Myanmar Salt Company Profiles
- Myanmar Salt Key Strategic Recommendations
Frequently Asked Questions About the Market Study (FAQs):
6Wresearch actively monitors the Myanmar Salt Market and publishes its comprehensive annual report, highlighting emerging trends, growth drivers, revenue analysis, and forecast outlook. Our insights help businesses to make data-backed strategic decisions with ongoing market dynamics. Our analysts track relevent industries related to the Myanmar Salt Market, allowing our clients with actionable intelligence and reliable forecasts tailored to emerging regional needs.
Yes, we provide customisation as per your requirements. To learn more, feel free to contact us on sales@6wresearch.com
1 Executive Summary |
2 Introduction |
2.1 Key Highlights of the Report |
2.2 Report Description |
2.3 Market Scope & Segmentation |
2.4 Research Methodology |
2.5 Assumptions |
3 Myanmar Salt Market Overview |
3.1 Myanmar Country Macro Economic Indicators |
3.2 Myanmar Salt Market Revenues & Volume, 2021 & 2031F |
3.3 Myanmar Salt Market - Industry Life Cycle |
3.4 Myanmar Salt Market - Porter's Five Forces |
3.5 Myanmar Salt Market Revenues & Volume Share, By Type, 2021 & 2031F |
3.6 Myanmar Salt Market Revenues & Volume Share, By Applications, 2021 & 2031F |
4 Myanmar Salt Market Dynamics |
4.1 Impact Analysis |
4.2 Market Drivers |
4.3 Market Restraints |
5 Myanmar Salt Market Trends |
6 Myanmar Salt Market, By Types |
6.1 Myanmar Salt Market, By Type |
6.1.1 Overview and Analysis |
6.1.2 Myanmar Salt Market Revenues & Volume, By Type, 2018 - 2027F |
6.1.3 Myanmar Salt Market Revenues & Volume, By Rock Salt, 2018 - 2027F |
6.1.4 Myanmar Salt Market Revenues & Volume, By Brine , 2018 - 2027F |
6.1.5 Myanmar Salt Market Revenues & Volume, By Solar Salt, 2018 - 2027F |
6.1.6 Myanmar Salt Market Revenues & Volume, By Others, 2018 - 2027F |
6.2 Myanmar Salt Market, By Applications |
6.2.1 Overview and Analysis |
6.2.2 Myanmar Salt Market Revenues & Volume, By Chemical Processing, 2018 - 2027F |
6.2.3 Myanmar Salt Market Revenues & Volume, By Road De-icing, 2018 - 2027F |
6.2.4 Myanmar Salt Market Revenues & Volume, By Food Processing, 2018 - 2027F |
6.2.5 Myanmar Salt Market Revenues & Volume, By Others, 2018 - 2027F |
7 Myanmar Salt Market Import-Export Trade Statistics |
7.1 Myanmar Salt Market Export to Major Countries |
7.2 Myanmar Salt Market Imports from Major Countries |
8 Myanmar Salt Market Key Performance Indicators |
9 Myanmar Salt Market - Opportunity Assessment |
9.1 Myanmar Salt Market Opportunity Assessment, By Type, 2021 & 2031F |
9.2 Myanmar Salt Market Opportunity Assessment, By Applications, 2021 & 2031F |
10 Myanmar Salt Market - Competitive Landscape |
10.1 Myanmar Salt Market Revenue Share, By Companies, 2021 |
10.2 Myanmar Salt Market Competitive Benchmarking, By Operating and Technical Parameters |
11 Company Profiles |
12 Recommendations |
13 Disclaimer |
Export potential assessment - trade Analytics for 2030
Export potential enables firms to identify high-growth global markets with greater confidence by combining advanced trade intelligence with a structured quantitative methodology. The framework analyzes emerging demand trends and country-level import patterns while integrating macroeconomic and trade datasets such as GDP and population forecasts, bilateral import–export flows, tariff structures, elasticity differentials between developed and developing economies, geographic distance, and import demand projections. Using weighted trade values from 2020–2024 as the base period to project country-to-country export potential for 2030, these inputs are operationalized through calculated drivers such as gravity model parameters, tariff impact factors, and projected GDP per-capita growth. Through an analysis of hidden potentials, demand hotspots, and market conditions that are most favorable to success, this method enables firms to focus on target countries, maximize returns, and global expansion with data, backed by accuracy.
By factoring in the projected importer demand gap that is currently unmet and could be potential opportunity, it identifies the potential for the Exporter (Country) among 190 countries, against the general trade analysis, which identifies the biggest importer or exporter.
To discover high-growth global markets and optimize your business strategy:
Click Here
Pricing
- Single User License$ 1,995
- Department License$ 2,400
- Site License$ 3,120
- Global License$ 3,795

Search
Thought Leadership and Analyst Meet


Our Clients
Latest Reports
- United Kingdom (UK) Long-term Care Insurance Market (2026-2032) | Growth, Share, Consumer Insights, Drivers, Opportunities, Competition, Pricing Analysis, Segments, Restraints, Companies, Competitive, Value, Outlook, Size, Demand, Analysis, Challenges, Strategic Insights, Investment Trends, Revenue, Trends, Supply, Forecast
- United Kingdom (UK) Long Term Care Market (2026-2032) | Companies, Outlook, Analysis, Trends, Value, Revenue, Segmentation, Share, Forecast, Competitive Landscape, Growth, Size & Forecast
- Iraq Insulation and Waterproofing Market (2026-2032) | Outlook, Drivers, Growth, Size, Share, Industry, Revenue, Trends, Demand, Competitive, Strategic Insights, Opportunities, Segments, Companies, Challenges, Strategy, Consumer Insights, Analysis, Investment Trends, Value, Segmentation, Forecast, Restraints
- India Switchgear Market Outlook (2026 - 2032) | Size, Share, Trends, Growth, Revenue, Forecast, Analysis, Value, Outlook
- Pakistan Contraceptive Implants Market (2025-2031) | Demand, Growth, Size, Share, Industry, Pricing Analysis, Competitive, Strategic Insights, Strategy, Consumer Insights, Analysis, Investment Trends, Opportunities, Revenue, Segments, Value, Segmentation, Supply, Forecast, Restraints, Outlook, Competition, Drivers, Trends, Companies, Challenges
- Sri Lanka Packaging Market (2026-2032) | Outlook, Competition, Drivers, Trends, Demand, Pricing Analysis, Competitive, Strategic Insights, Companies, Challenges, Strategy, Consumer Insights, Analysis, Investment Trends, Opportunities, Growth, Size, Share, Industry, Revenue, Segments, Value, Segmentation, Supply, Forecast, Restraints
- India Kids Watches Market (2026-2032) | Strategy, Consumer Insights, Analysis, Investment Trends, Opportunities, Growth, Size, Share, Industry, Revenue, Segments, Value, Segmentation, Supply, Forecast, Restraints, Outlook, Competition, Drivers, Trends, Demand, Pricing Analysis, Competitive, Strategic Insights, Companies, Challenges
- Saudi Arabia Core Assurance Service Market (2025-2031) | Strategy, Consumer Insights, Analysis, Investment Trends, Opportunities, Growth, Size, Share, Industry, Revenue, Segments, Value, Segmentation, Supply, Forecast, Restraints, Outlook, Competition, Drivers, Trends, Demand, Pricing Analysis, Competitive, Strategic Insights, Companies, Challenges
- Romania Uninterruptible Power Supply (UPS) Market (2026-2032) | Industry, Analysis, Revenue, Size, Forecast, Outlook, Value, Trends, Share, Growth & Companies
- Saudi Arabia Car Window Tinting Film, Paint Protection Film (PPF), and Ceramic Coating Market (2025-2031) | Strategy, Consumer Insights, Analysis, Investment Trends, Opportunities, Growth, Size, Share, Industry, Revenue, Segments, Value, Segmentation, Supply, Forecast, Restraints, Outlook, Competition, Drivers, Trends, Demand, Pricing Analysis, Competitive, Strategic Insights, Companies, Challenges
Industry Events and Analyst Meet

India EV Show 2026

EV tech India Expo 2026

Auto Tech Asia 2026

Battery Tech India 2026

Smart Production Solutions Guangzhou 2026
Whitepaper
- Middle East & Africa Commercial Security Market Click here to view more.
- Middle East & Africa Fire Safety Systems & Equipment Market Click here to view more.
- GCC Drone Market Click here to view more.
- Middle East Lighting Fixture Market Click here to view more.
- GCC Physical & Perimeter Security Market Click here to view more.
6WResearch In News
- Doha a strategic location for EV manufacturing hub: IPA Qatar
- Demand for luxury TVs surging in the GCC, says Samsung
- Empowering Growth: The Thriving Journey of Bangladesh’s Cable Industry
- Demand for luxury TVs surging in the GCC, says Samsung
- Video call with a traditional healer? Once unthinkable, it’s now common in South Africa
- Intelligent Buildings To Smooth GCC’s Path To Net Zero