Myanmar Tables Market Summary
The myanmar tables market was estimated at USD 377 Million in 2025 and is projected to reach USD 504 Million by 2032, growing at a CAGR of 4.9% from 2026 to 2032.
Myanmar Tables Market Year-wise Growth Rate and Key Drivers
This graph highlights how the Myanmar Tables Market has steadily grown over the past five years, supported by major growth factors.
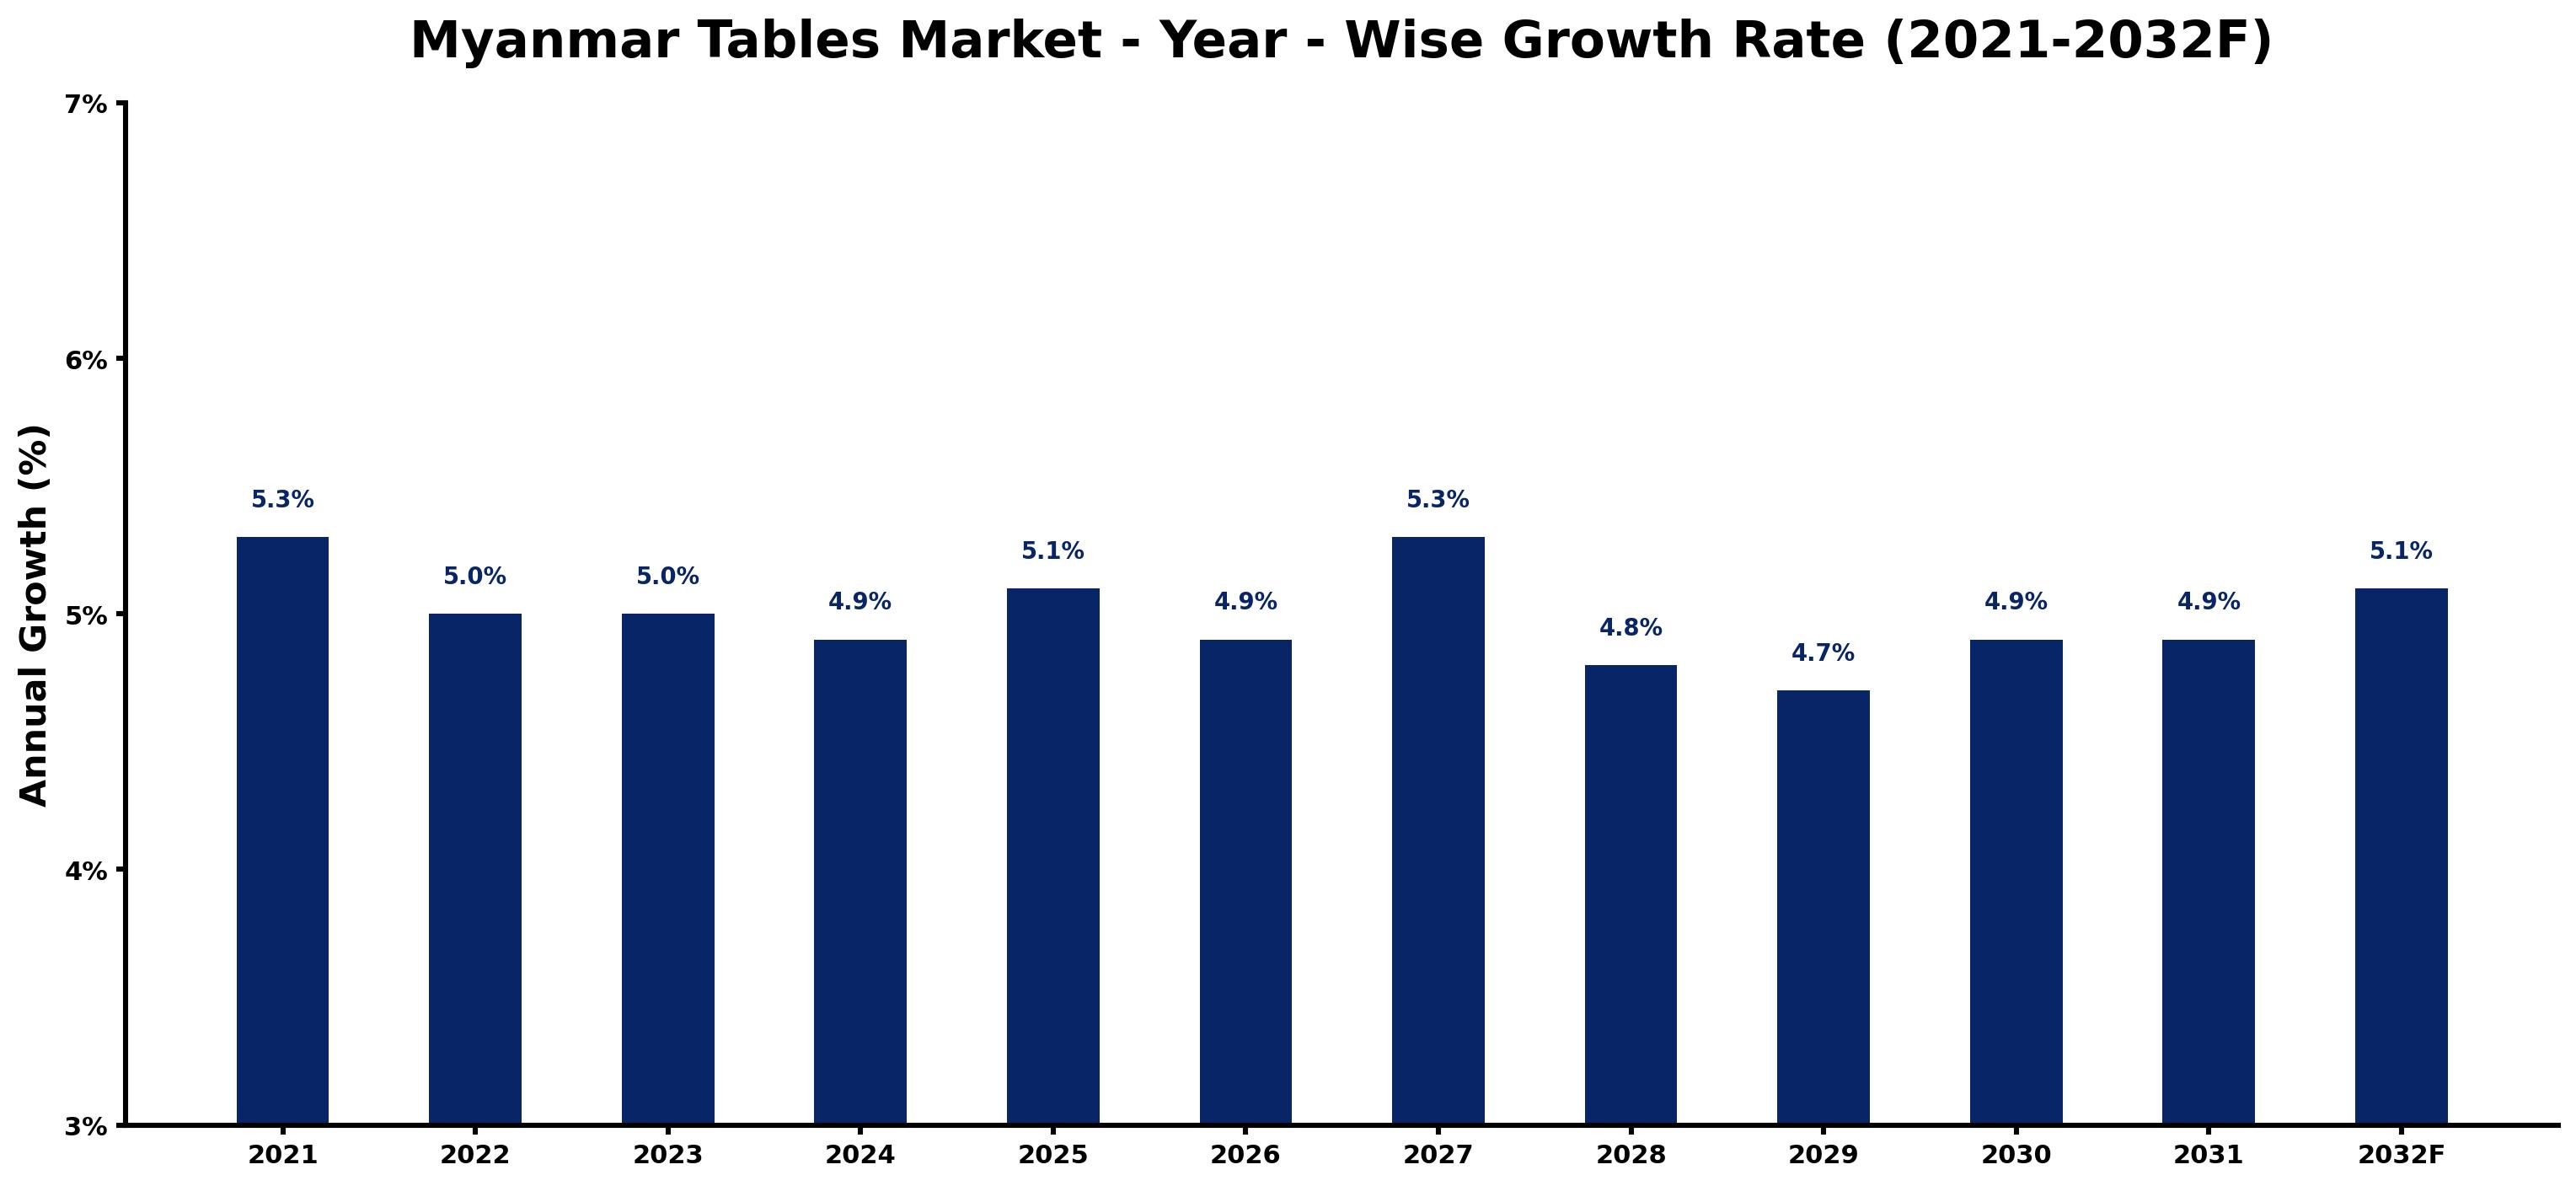
The table below presents the year wise growth rates along with the key drivers influencing the market
| Year | Growth Rate | Major Drivers |
| 2021 | 5.3% | Post-coup economic instability limited consumer purchasing power for furniture products. |
| 2022 | 5.0% | Local enterprises began shifting focus towards sustainable materials in table production. |
| 2023 | 5.0% | Urban migration trends saw increased demand for versatile and space-saving furniture items. |
| 2024 | 4.9% | Rising tourism prompted hotels to upgrade dining experiences with locally crafted tables. |
| 2025 | 5.1% | E-commerce platforms emerged, expanding reach for local artisans and increasing visibility. |
| 2026 | 4.9% | Cultural festivals highlighted traditional craftsmanship, boosting local table manufacturers' visibility. |
| 2027 | 5.3% | A burgeoning middle class started investing in higher-quality furniture and home decor. |
| 2028 | 4.8% | International brands entered the market, raising competition and diversifying consumer choices. |
| 2029 | 4.7% | Sustainable tourism encouraged eco-friendly table options, appealing to conscious consumers. |
| 2030 | 4.9% | Technological integration in manufacturing enhanced efficiency, reducing production costs significantly. |
| 2031 | 4.9% | Consumer preferences shifted towards multifunctional furniture solutions for smaller living spaces. |
| 2032 | 5.1% | Collaborations between local artisans and designers introduced innovative table designs and styles. |
Note - Market size estimations and growth projections presented in this report are based on 6Wresearch's advanced forecasting approach, validated with industry datasets as of June 2026.
Myanmar Tables Market Synopsis
The Myanmar Tables Market is projected to reach 4.9% and witness significant growth during the forecast period (2026-2032). This growth is primarily driven by increasing demand from both the residential and commercial sectors. Rapid urbanization, coupled with improving living standards, is leading consumers to seek modern and stylish furniture options. Within this dynamic environment, various types of tables are available, including dining tables, coffee tables, study tables, and outdoor tables, catering to a broad spectrum of consumer preferences.
Myanmar Tables Market Growth Drivers
The growth of the Myanmar Tables Market is influenced by several key factors:
- Urbanization is significantly reshaping living environments in Myanmar, with an increasing number of households requiring innovative furniture solutions that maximize space.
- Improving economic conditions have resulted in rising disposable incomes, which enhances consumer purchasing power for high quality and aesthetically pleasing furniture.
- The trend toward contemporary design has led to a heightened demand for stylish tables that complement modern homes and businesses.
- Increased availability of e-commerce platforms has transformed the shopping experience, allowing consumers to conveniently explore and purchase a diverse range of table options online.
- Growing focus on sustainability is prompting consumers to seek tables made from eco-friendly materials, further pushing market innovation and offering new avenues for manufacturers.
Myanmar Tables Market Trends and Opportunities
The Myanmar Tables Market is currently characterized by notable trends that present both challenges and opportunities:
- The demand for multifunctional tables is on the rise, reflecting the need for versatile solutions in small living spaces, which is consistent with urban living trends.
- There is a marked shift towards sustainable materials such as bamboo and recycled wood, driven by consumer awareness of environmental issues.
- Minimalist and modern design aesthetics are gaining traction, indicating a shift in consumer preference towards simple yet chic furniture that requires less maintenance.
- The increasing role of e-commerce in retail has enabled consumers to access a wide variety of tables from the comfort of their homes, thereby expanding market reach.
- Customization options for tables are emerging as a key opportunity, allowing consumers to express their unique style through tailored designs.
Myanmar Tables Market Challenges and Restraints
Despite the positive outlook for the Myanmar Tables Market, several challenges persist:
- The country's fluctuating political and economic environment can lead to volatility in consumer spending, adversely affecting demand for tables.
- Inconsistent infrastructure and logistics pose significant barriers to efficient distribution, making it difficult for manufacturers to deliver products timely across various regions.
- Local manufacturers face stiff competition from lower-priced imported tables, which can undermine their market share and profitability.
- Maintaining quality and design standards while remaining price-competitive requires strategic planning and resource allocation from manufacturers.
- Market players must navigate regulatory compliance issues related to manufacturing and materials, adding another layer of complexity to operations.
Myanmar Tables Market Investment Opportunities
The Myanmar Tables Market presents various investment opportunities due to the country's burgeoning economy and evolving consumer preferences:
- The construction boom and urban development projects create substantial demand for quality tables in residential, commercial, and hospitality sectors.
- Opportunities exist in both manufacturing and importing a range of table types to satisfy consumer demand for diversity and quality.
- Investors can leverage growing trends in customization and unique design offerings to gain competitive advantages in the marketplace.
- Strategic collaborations with local artisans and manufacturers can provide beneficial insights into consumer preferences and enhance product reach.
- With increasing consumer spending on home furnishings, there exists a potential for significant returns on investment by entering the Myanmar furniture market now.
Myanmar Tables Market Government Investment and Initiatives
Government policies play a crucial role in shaping the landscape of the Myanmar Tables Market. These include regulations governing the import and export of furniture, taxation policies relevant to manufacturing businesses, and adherence to environmental and labor laws. The government has shown commitment to promote local craftsmanship and support the growth of the furniture sector through potential incentives or subsidies. Additionally, there is increasing focus on sustainable manufacturing practices, compelling players in the market to comply with guidelines that ensure environmental sustainability while fostering ethical labor practices. This regulatory framework aims to create an enabling environment for growth while balancing legal and ethical considerations.
Myanmar Tables Market Latest Developments (May 2025 - June 2026)
Recent developments in the Myanmar Tables Market reveal a trajectory of evolving trends and consumer preferences. The period has seen an increase in the establishment of e-commerce platforms dedicated exclusively to furniture, providing consumers with more convenient purchasing options. Additionally, local manufacturers have begun exploring sustainable materials and design innovations to meet rising consumer demand for environmentally friendly products. Moreover, there's a growing emphasis on multifunctionality, as furniture designs aim to cater to the needs of smaller living spaces. In summary, recent developments indicate responsiveness to consumer trends and an adaptive market landscape gearing up for future challenges and opportunities.
Myanmar Tables Market - Key Attractiveness of the Report
- 10 Years of Market Numbers
- Historical Data Starting from 2022 to 2025
- Base Year: 2025
- Forecast Data until 2032
- Key Performance Indicators Impacting the Market
- Major Upcoming Developments and Projects
Key Highlights of the Report:
- Myanmar Tables Market Outlook
- Market Size of Myanmar Tables Market, 2025
- Forecast of Myanmar Tables Market, 2032F
- Historical Data and Forecast of Myanmar Tables Revenues & Volume for the Period 2022-2032F
- Myanmar Tables Market Trend Evolution
- Myanmar Tables Market Drivers and Challenges
- Myanmar Tables Price Trends
- Myanmar Tables Porter's Five Forces
- Myanmar Tables Industry Life Cycle
- Historical Data and Forecast of Myanmar Tables Market Revenues & Volume By Types for the Period 2022-2032F
- Historical Data and Forecast of Myanmar Tables Market Revenues & Volume By Fabric for the Period 2022-2032F
- Historical Data and Forecast of Myanmar Tables Market Revenues & Volume By Leather for the Period 2022-2032F
- Historical Data and Forecast of Myanmar Tables Market Revenues & Volume By Metal for the Period 2022-2032F
- Historical Data and Forecast of Myanmar Tables Market Revenues & Volume By Wooden for the Period 2022-2032F
- Historical Data and Forecast of Myanmar Tables Market Revenues & Volume By Others for the Period 2022-2032F
- Historical Data and Forecast of Myanmar Tables Market Revenues & Volume By Applications for the Period 2022-2032F
- Historical Data and Forecast of Myanmar Tables Market Revenues & Volume By Family for the Period 2022-2032F
- Historical Data and Forecast of Myanmar Tables Market Revenues & Volume By Office for the Period 2022-2032F
- Historical Data and Forecast of Myanmar Tables Market Revenues & Volume By Others for the Period 2022-2032F
- Myanmar Tables Import Export Trade Statistics
- Market Opportunity Assessment By Types
- Market Opportunity Assessment By Applications
- Myanmar Tables Top Companies Market Share
- Myanmar Tables Competitive Benchmarking By Technical and Operational Parameters
- Myanmar Tables Company Profiles
- Myanmar Tables Key Strategic Recommendations






































