Namibia Coir Market (2025-2031) | Forecast, Companies, Growth, Value, Segmentation, Analysis, Industry, Revenue, Trends, Size, Outlook & Share
Market Forecast By Product Type (White Fiber, Brown Fiber), By Nature (Organic, Conventional), By Source (Green Coconuts, Brown Coconuts), By Form (Bales, Blocks, Disks & Coins, Husk Chips, Grow Bags & Open Top, Rope) And Competitive Landscape
| Product Code: ETC5384181 | Publication Date: Nov 2023 | Updated Date: Oct 2025 | Product Type: Market Research Report | |
| Publisher: 6Wresearch | Author: Ravi Bhandari | No. of Pages: 60 | No. of Figures: 30 | No. of Tables: 5 |
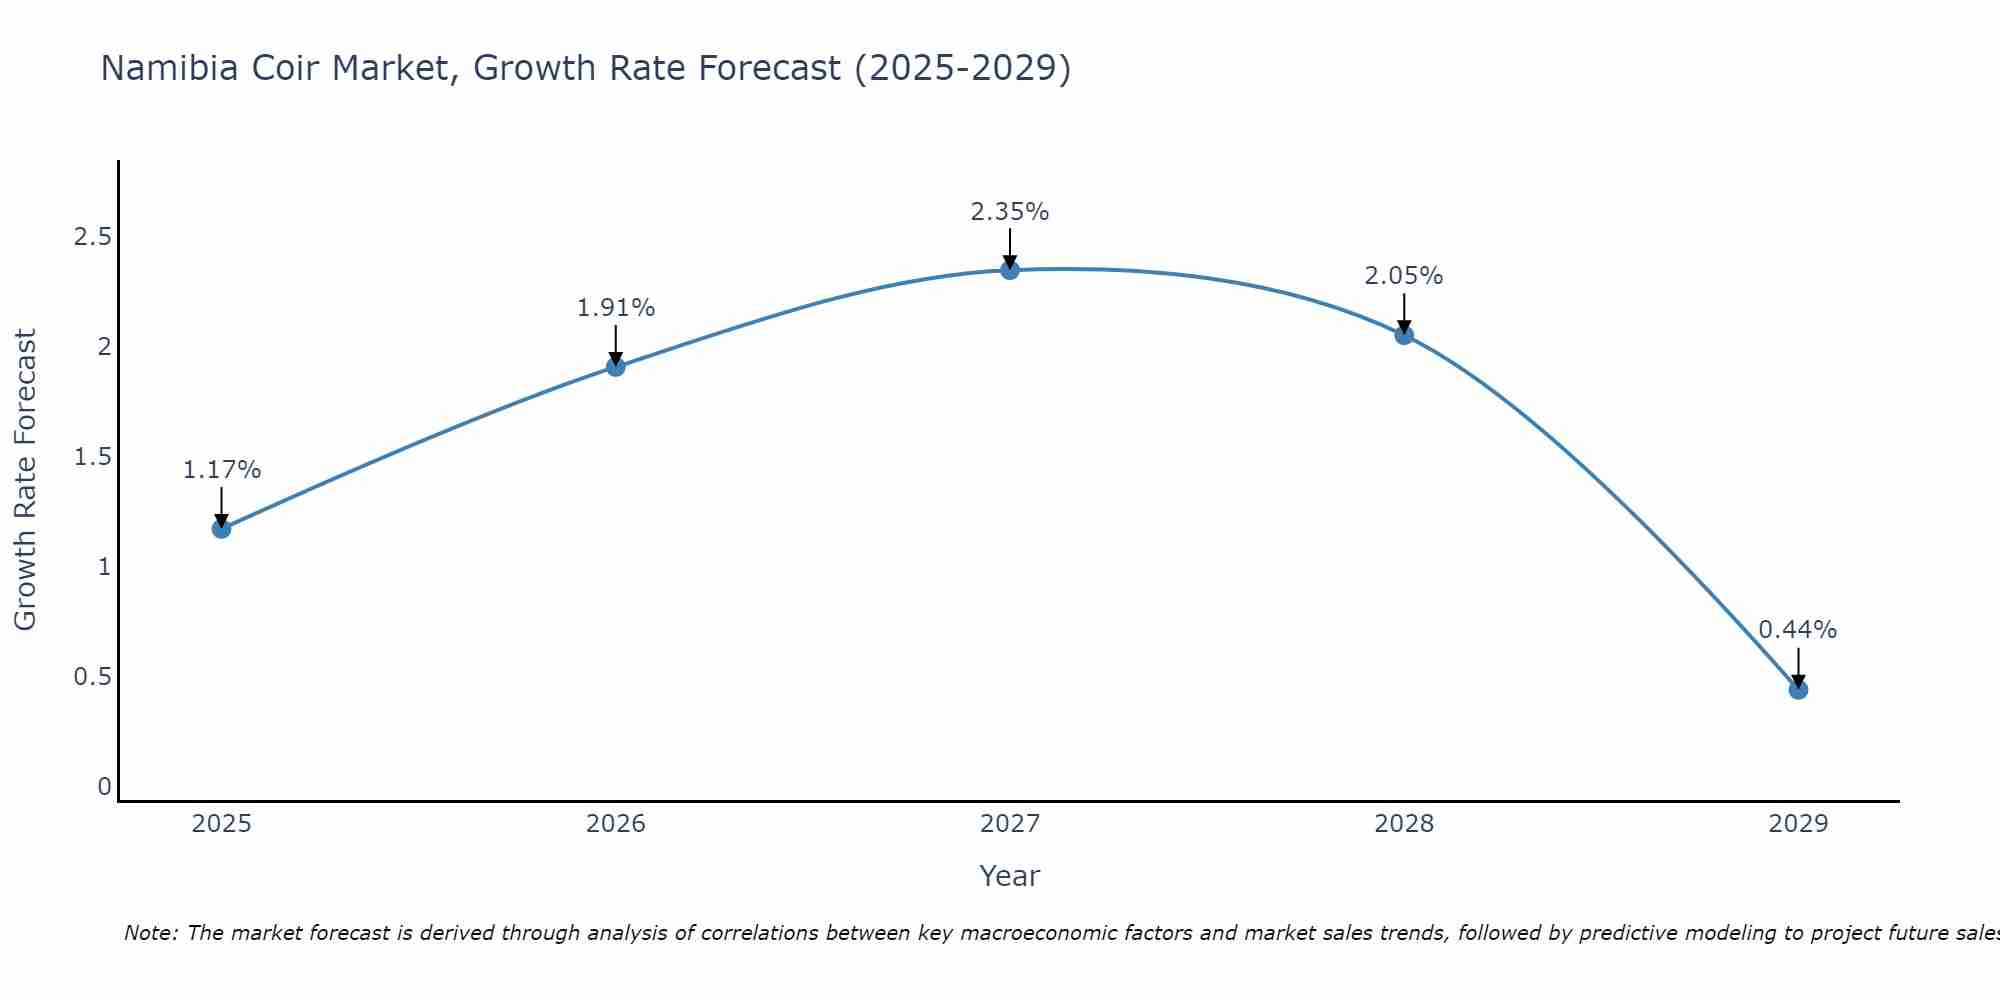
Namibia Coir Market Size Growth Rate
The Namibia Coir Market is projected to witness mixed growth rate patterns during 2025 to 2029. Starting at 1.17% in 2025, the market peaks at 2.35% in 2027, and settles at 0.44% by 2029.
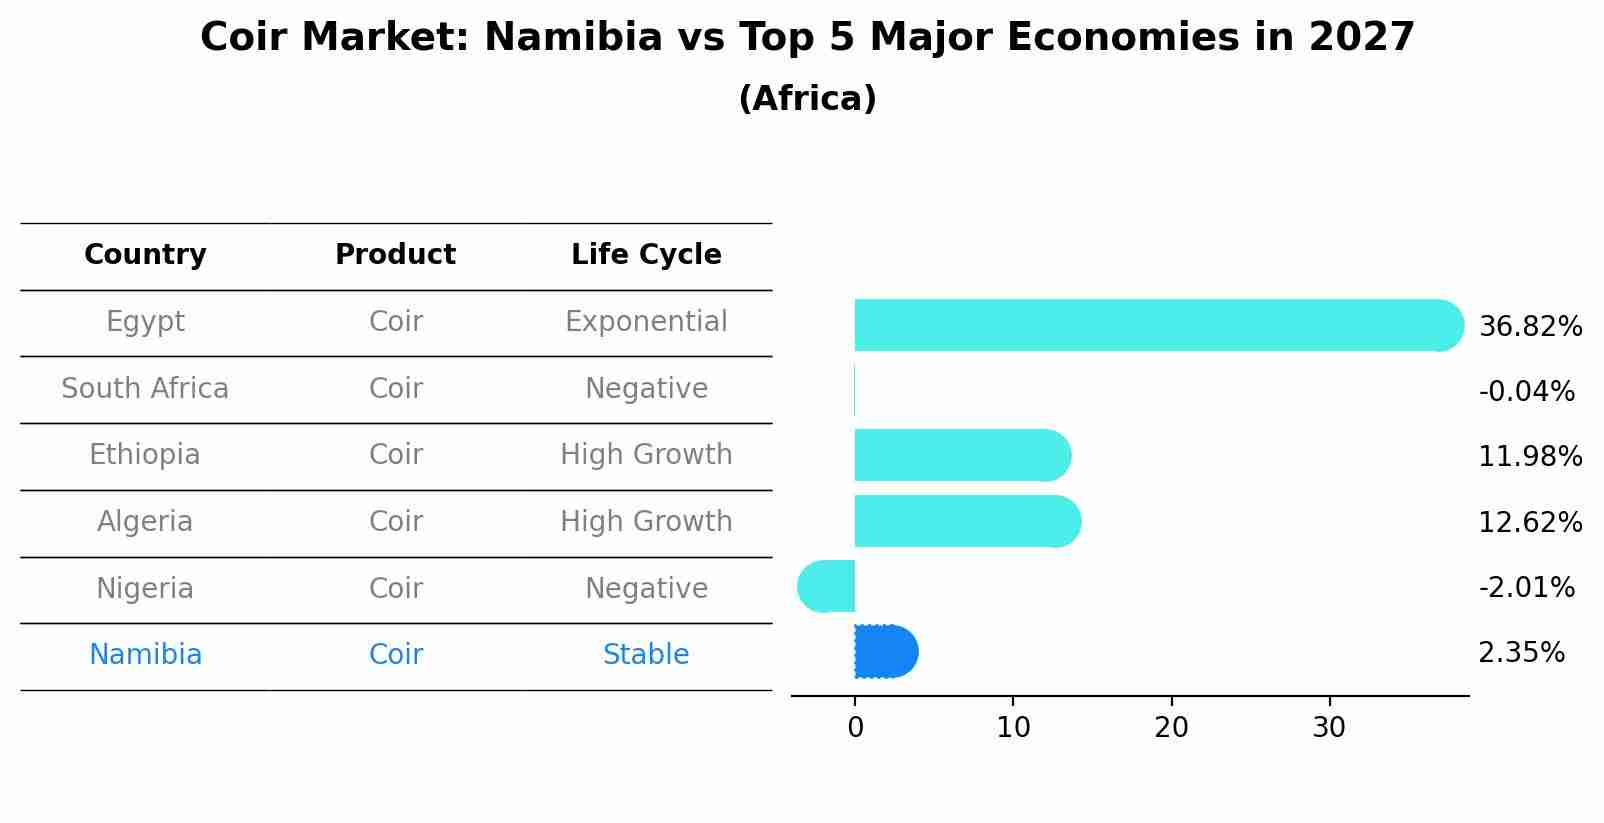
Coir Market: Namibia vs Top 5 Major Economies in 2027 (Africa)
By 2027, Namibia's Coir market is forecasted to achieve a stable growth rate of 2.35%, with Egypt leading the Africa region, followed by South Africa, Ethiopia, Algeria and Nigeria.
Key Highlights of the Report:
- Namibia Coir Market Outlook
- Market Size of Namibia Coir Market, 2024
- Forecast of Namibia Coir Market, 2031
- Historical Data and Forecast of Namibia Coir Revenues & Volume for the Period 2021-2031
- Namibia Coir Market Trend Evolution
- Namibia Coir Market Drivers and Challenges
- Namibia Coir Price Trends
- Namibia Coir Porter`s Five Forces
- Namibia Coir Industry Life Cycle
- Historical Data and Forecast of Namibia Coir Market Revenues & Volume By Product Type for the Period 2021-2031
- Historical Data and Forecast of Namibia Coir Market Revenues & Volume By White Fiber for the Period 2021-2031
- Historical Data and Forecast of Namibia Coir Market Revenues & Volume By Brown Fiber for the Period 2021-2031
- Historical Data and Forecast of Namibia Coir Market Revenues & Volume By Nature for the Period 2021-2031
- Historical Data and Forecast of Namibia Coir Market Revenues & Volume By Organic for the Period 2021-2031
- Historical Data and Forecast of Namibia Coir Market Revenues & Volume By Conventional for the Period 2021-2031
- Historical Data and Forecast of Namibia Coir Market Revenues & Volume By Source for the Period 2021-2031
- Historical Data and Forecast of Namibia Coir Market Revenues & Volume By Green Coconuts for the Period 2021-2031
- Historical Data and Forecast of Namibia Coir Market Revenues & Volume By Brown Coconuts for the Period 2021-2031
- Historical Data and Forecast of Namibia Coir Market Revenues & Volume By Form for the Period 2021-2031
- Historical Data and Forecast of Namibia Coir Market Revenues & Volume By Bales for the Period 2021-2031
- Historical Data and Forecast of Namibia Coir Market Revenues & Volume By Blocks for the Period 2021-2031
- Historical Data and Forecast of Namibia Coir Market Revenues & Volume By Disks & Coins for the Period 2021-2031
- Historical Data and Forecast of Namibia Coir Market Revenues & Volume By Husk Chips for the Period 2021-2031
- Historical Data and Forecast of Namibia Coir Market Revenues & Volume By Grow Bags & Open Top for the Period 2021-2031
- Historical Data and Forecast of Namibia Coir Market Revenues & Volume By Rope for the Period 2021-2031
- Namibia Coir Import Export Trade Statistics
- Market Opportunity Assessment By Product Type
- Market Opportunity Assessment By Nature
- Market Opportunity Assessment By Source
- Market Opportunity Assessment By Form
- Namibia Coir Top Companies Market Share
- Namibia Coir Competitive Benchmarking By Technical and Operational Parameters
- Namibia Coir Company Profiles
- Namibia Coir Key Strategic Recommendations
Frequently Asked Questions About the Market Study (FAQs):
6Wresearch actively monitors the Namibia Coir Market and publishes its comprehensive annual report, highlighting emerging trends, growth drivers, revenue analysis, and forecast outlook. Our insights help businesses to make data-backed strategic decisions with ongoing market dynamics. Our analysts track relevent industries related to the Namibia Coir Market, allowing our clients with actionable intelligence and reliable forecasts tailored to emerging regional needs.
Yes, we provide customisation as per your requirements. To learn more, feel free to contact us on sales@6wresearch.com
1 Executive Summary |
2 Introduction |
2.1 Key Highlights of the Report |
2.2 Report Description |
2.3 Market Scope & Segmentation |
2.4 Research Methodology |
2.5 Assumptions |
3 Namibia Coir Market Overview |
3.1 Namibia Country Macro Economic Indicators |
3.2 Namibia Coir Market Revenues & Volume, 2021 & 2031F |
3.3 Namibia Coir Market - Industry Life Cycle |
3.4 Namibia Coir Market - Porter's Five Forces |
3.5 Namibia Coir Market Revenues & Volume Share, By Product Type, 2021 & 2031F |
3.6 Namibia Coir Market Revenues & Volume Share, By Nature, 2021 & 2031F |
3.7 Namibia Coir Market Revenues & Volume Share, By Source, 2021 & 2031F |
3.8 Namibia Coir Market Revenues & Volume Share, By Form, 2021 & 2031F |
4 Namibia Coir Market Dynamics |
4.1 Impact Analysis |
4.2 Market Drivers |
4.2.1 Increasing awareness about sustainable and eco-friendly products |
4.2.2 Growing demand for organic and biodegradable materials in various industries |
4.2.3 Government initiatives promoting the use of natural fibers like coir |
4.3 Market Restraints |
4.3.1 Fluctuations in raw material prices impacting production costs |
4.3.2 Limited availability of skilled labor for coir production |
4.3.3 Competition from synthetic materials in the market |
5 Namibia Coir Market Trends |
6 Namibia Coir Market Segmentations |
6.1 Namibia Coir Market, By Product Type |
6.1.1 Overview and Analysis |
6.1.2 Namibia Coir Market Revenues & Volume, By White Fiber, 2021-2031F |
6.1.3 Namibia Coir Market Revenues & Volume, By Brown Fiber, 2021-2031F |
6.2 Namibia Coir Market, By Nature |
6.2.1 Overview and Analysis |
6.2.2 Namibia Coir Market Revenues & Volume, By Organic, 2021-2031F |
6.2.3 Namibia Coir Market Revenues & Volume, By Conventional, 2021-2031F |
6.3 Namibia Coir Market, By Source |
6.3.1 Overview and Analysis |
6.3.2 Namibia Coir Market Revenues & Volume, By Green Coconuts, 2021-2031F |
6.3.3 Namibia Coir Market Revenues & Volume, By Brown Coconuts, 2021-2031F |
6.4 Namibia Coir Market, By Form |
6.4.1 Overview and Analysis |
6.4.2 Namibia Coir Market Revenues & Volume, By Bales, 2021-2031F |
6.4.3 Namibia Coir Market Revenues & Volume, By Blocks, 2021-2031F |
6.4.4 Namibia Coir Market Revenues & Volume, By Disks & Coins, 2021-2031F |
6.4.5 Namibia Coir Market Revenues & Volume, By Husk Chips, 2021-2031F |
6.4.6 Namibia Coir Market Revenues & Volume, By Grow Bags & Open Top, 2021-2031F |
6.4.7 Namibia Coir Market Revenues & Volume, By Rope, 2021-2031F |
7 Namibia Coir Market Import-Export Trade Statistics |
7.1 Namibia Coir Market Export to Major Countries |
7.2 Namibia Coir Market Imports from Major Countries |
8 Namibia Coir Market Key Performance Indicators |
8.1 Percentage increase in adoption of eco-friendly products in Namibia |
8.2 Growth in the number of industries using coir as a raw material |
8.3 Improvement in the efficiency of coir production processes |
9 Namibia Coir Market - Opportunity Assessment |
9.1 Namibia Coir Market Opportunity Assessment, By Product Type, 2021 & 2031F |
9.2 Namibia Coir Market Opportunity Assessment, By Nature, 2021 & 2031F |
9.3 Namibia Coir Market Opportunity Assessment, By Source, 2021 & 2031F |
9.4 Namibia Coir Market Opportunity Assessment, By Form, 2021 & 2031F |
10 Namibia Coir Market - Competitive Landscape |
10.1 Namibia Coir Market Revenue Share, By Companies, 2024 |
10.2 Namibia Coir Market Competitive Benchmarking, By Operating and Technical Parameters |
11 Company Profiles |
12 Recommendations | 13 Disclaimer |
Export potential assessment - trade Analytics for 2030
Export potential enables firms to identify high-growth global markets with greater confidence by combining advanced trade intelligence with a structured quantitative methodology. The framework analyzes emerging demand trends and country-level import patterns while integrating macroeconomic and trade datasets such as GDP and population forecasts, bilateral import–export flows, tariff structures, elasticity differentials between developed and developing economies, geographic distance, and import demand projections. Using weighted trade values from 2020–2024 as the base period to project country-to-country export potential for 2030, these inputs are operationalized through calculated drivers such as gravity model parameters, tariff impact factors, and projected GDP per-capita growth. Through an analysis of hidden potentials, demand hotspots, and market conditions that are most favorable to success, this method enables firms to focus on target countries, maximize returns, and global expansion with data, backed by accuracy.
By factoring in the projected importer demand gap that is currently unmet and could be potential opportunity, it identifies the potential for the Exporter (Country) among 190 countries, against the general trade analysis, which identifies the biggest importer or exporter.
To discover high-growth global markets and optimize your business strategy:
Click Here
Pricing
- Single User License$ 1,995
- Department License$ 2,400
- Site License$ 3,120
- Global License$ 3,795

Search
Thought Leadership and Analyst Meet


Our Clients
Latest Reports
- Ivory Coast Pet Perfume market Market (2026-2032) | Challenges, Growth, Revenue, Strategy, Investment Opportunities, Share, Analysis, Restraints, Insights, Trends, Drivers, Forecast, Demand, Pricing, Value, Size, segmentation, Companies, Outlook, Competition
- Ivory Coast Biopolymer Packaging Market (2026-2032) | Size, Competition, Demand, Analysis, Trends, Drivers, Challenges, Companies, Value, Forecast, Investment Opportunities, Insights, Growth, Share, Restraints, Revenue, Strategy, Outlook, Pricing, segmentation
- Ivory Coast Electric Heavy Commercial Vehicle Traction Motor market Market (2026-2032) | Demand, Pricing, Value, Restraints, Size, Trends, Drivers, Analysis, Outlook, Strategy, Insights, Forecast, Companies, Challenges, Share, segmentation, Growth, Competition, Investment Opportunities, Revenue
- Ivory Coast Metallic Braces market Market (2026-2032) | Companies, Revenue, Trends, Value, Insights, Strategy, Restraints, Size, Demand, Pricing, Share, Challenges, Analysis, Forecast, Drivers, Investment Opportunities, Competition, segmentation, Growth, Outlook
- Ivory Coast barcode scanners printers market Market (2026-2032) | Pricing, Restraints, Analysis, Competition, Size, Value, Trends, Forecast, Companies, Drivers, Demand, Insights, Strategy, Share, Investment Opportunities, Challenges, segmentation, Growth, Outlook, Revenue
- Ivory Coast AI Energy Distribution Market (2026-2032) | Companies, Drivers, Demand, Challenges, Size, Insights, Value, Restraints, Strategy, Investment Opportunities, Revenue, Outlook, Growth, Forecast, Share, Competition, Pricing, segmentation, Analysis, Trends
- Ivory Coast Recycled Polyester Market (2026-2032) | Trends, Insights, Growth, Challenges, Forecast, Value, Outlook, Strategy, Pricing, Revenue, segmentation, Demand, Companies, Investment Opportunities, Restraints, Share, Size, Analysis, Competition, Drivers
- Ivory Coast Mission Critical Wireless Communications Market (2026-2032) | segmentation, Companies, Revenue, Drivers, Strategy, Demand, Growth, Insights, Trends, Competition, Forecast, Share, Size, Outlook, Restraints, Challenges, Analysis, Pricing, Value, Investment Opportunities
- Ivory Coast AI Pathology Market (2026-2032) | Investment Opportunities, Competition, Revenue, Growth, Value, Insights, Share, segmentation, Trends, Companies, Outlook, Drivers, Demand, Challenges, Analysis, Pricing, Size, Forecast, Restraints, Strategy
- Ivory Coast Electric Appliance Rental Market (2026-2032) | Outlook, Value, Drivers, Restraints, Trends, Share, Competition, Pricing, Forecast, Growth, Revenue, Strategy, Insights, Companies, Size, Investment Opportunities, Challenges, Demand, segmentation, Analysis
Industry Events and Analyst Meet

HIMTEX 2026

India Refining Summit 2026

India EV Show 2026

EV tech India Expo 2026

Auto Tech Asia 2026
Whitepaper
- Middle East & Africa Commercial Security Market Click here to view more.
- Middle East & Africa Fire Safety Systems & Equipment Market Click here to view more.
- GCC Drone Market Click here to view more.
- Middle East Lighting Fixture Market Click here to view more.
- GCC Physical & Perimeter Security Market Click here to view more.
6WResearch In News
- Doha a strategic location for EV manufacturing hub: IPA Qatar
- Demand for luxury TVs surging in the GCC, says Samsung
- Empowering Growth: The Thriving Journey of Bangladesh’s Cable Industry
- Demand for luxury TVs surging in the GCC, says Samsung
- Video call with a traditional healer? Once unthinkable, it’s now common in South Africa
- Intelligent Buildings To Smooth GCC’s Path To Net Zero