Nepal Electronics Manufacturing Services Market (2026-2032) | Revenue, Trends, Size, Growth, Industry, Analysis, Value, Share, Forecast, Outlook & Companies
Market Forecast By Service (Electronics manufacturing services, Engineering services, Test & development implementation, Logistics services, Others), By Application (Computer, Consumer Electronics, Aerospace & Defense, Medical & Healthcare, Automotive, Others) And Competitive Landscape
| Product Code: ETC031436 | Publication Date: Oct 2020 | Updated Date: Jun 2026 | Product Type: Report | |
| Publisher: 6Wresearch | Author: Dhaval Chaurasia | No. of Pages: 70 | No. of Figures: 35 | No. of Tables: 5 |
Nepal Electronics Manufacturing Services Market Summary
The nepal electronics manufacturing services market was estimated at USD 391 Million in 2025 and is projected to reach USD 551 Million by 2032, growing at a CAGR of 6.0% from 2026 to 2032.
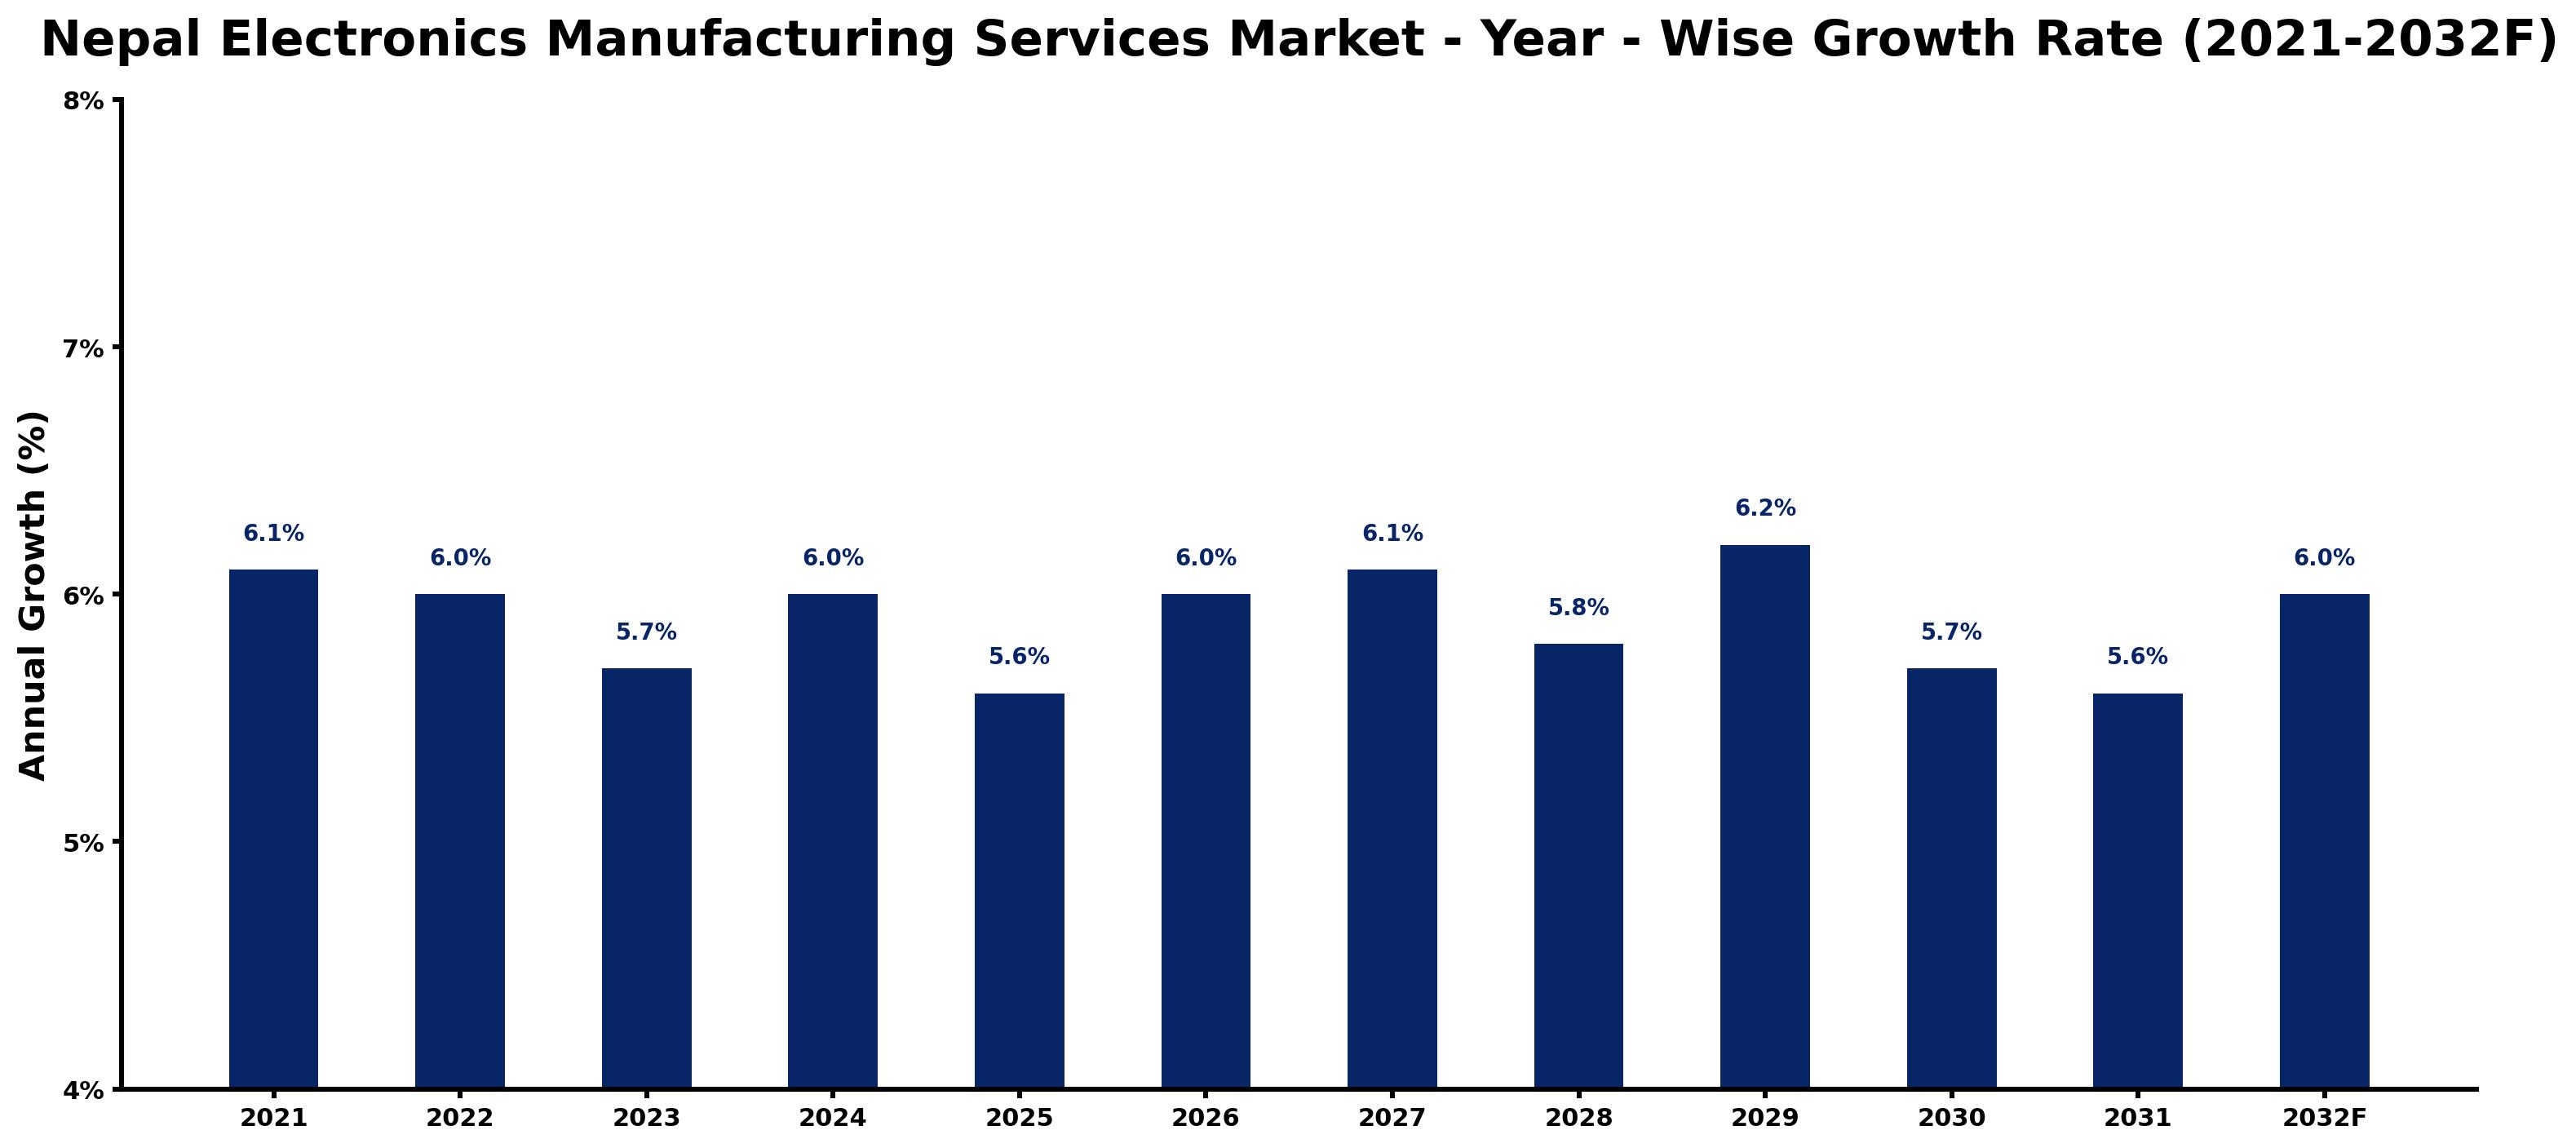
Nepal Electronics Manufacturing Services Market Growth Rate Analysis (2021-2032)
The Nepal Electronics Manufacturing Services market has shown stable growth, with a compound annual growth rate (CAGR) averaging around 6% over recent years. In 2021, the market grew by 6.1%, spurred by increasing consumer demand and investment in local manufacturing infrastructure. This growth softened slightly to 5.7% in 2023 as global supply chain challenges impacted production schedules. However, the market is set for a resurgence, projected to grow 6.2% in 2029, fueled by advancements in digitalization and the government's supportive policies promoting energy transition initiatives. As the local talent pool expands and technology adoption increases, the market is likely to stabilize further around 6.0% through 2032, despite minor fluctuations.
Nepal Electronics Manufacturing Services Market Year-wise Growth Rate and Key Drivers
This graph highlights how the Nepal Electronics Manufacturing Services Market has steadily grown over the past five years, supported by major growth factors.
The table below presents the year wise growth rates along with the key drivers influencing the market
| Year | Growth Rate | Major Drivers |
| 2021 | 6.1% | Manufacturers are exploring low-cost production locations to boost profitability and efficiency. |
| 2022 | 6.0% | Tightening supply chains in Asia compel companies to reassess their manufacturing strategies. |
| 2023 | 5.7% | Investment in local talent is crucial for sustaining long-term growth in electronics. |
| 2024 | 6.0% | Partnerships with regional tech firms can enhance innovation and product development capabilities. |
| 2025 | 5.6% | Emerging trends in green technology encourage eco-friendly practices in manufacturing operations. |
| 2026 | 6.0% | Shifts toward smart electronics create new opportunities for specialized service providers. |
| 2027 | 6.1% | Cost advantages in labor and materials attract foreign investment into local manufacturing hubs. |
| 2028 | 5.8% | Quality improvement initiatives are essential for competing in the global electronics market. |
| 2029 | 6.2% | Focus on enhancing digital infrastructure supports the growth of electronics manufacturing. |
| 2030 | 5.7% | Emerging consumer trends signal a growing appetite for locally produced electronic goods. |
| 2031 | 5.6% | Cross-border collaborations are vital for accessing new markets and expanding product offerings. |
| 2032 | 6.0% | Technological integration within manufacturing processes significantly boosts operational efficiencies. |
Note - Market size estimations and growth projections presented in this report are based on 6Wresearch's advanced forecasting approach, validated with industry datasets as of June 2026.
Nepal Electronics Manufacturing Services Market Synopsis
The Nepal Electronics Manufacturing Services Market is projected to reach 6.0% and witness significant growth during the forecast period (2026-2032). The market is characterized by a blend of local and international manufacturing capabilities, focusing on various electronic products such as consumer electronics, industrial electronics, and telecommunications equipment. Driven by an increasing demand for these products, coupled with favorable government policies that encourage local manufacturing and foreign investment, the market is on a robust growth trajectory. Nevertheless, challenges such as infrastructure inadequacies, a shortage of skilled labor, and heavy dependence on imported raw materials pose significant constraints on this growth.
Nepal Electronics Manufacturing Services Market Growth Drivers
The growth of the Nepal Electronics Manufacturing Services market can be attributed to several key drivers:
- Rising Demand: There is a growing consumer demand for electronics such as smartphones, laptops, and other electronic devices, which fuels the need for manufacturing services.
- Government Support: Initiatives introduced by the government aim to bolster local manufacturing through incentives, tax breaks, and subsidies, enhancing market attractiveness.
- Technological Integration: The incorporation of advanced technologies like the Internet of Things (IoT) and automation is enhancing productivity and efficiency in manufacturing processes.
- Outsourcing Trends: An increasing trend towards outsourcing manufacturing services allows companies to reduce operational costs while maintaining high standards of quality.
- Sustainability Focus: The shift towards eco-friendly practices and sustainable materials resonates with global trends, making Nepal an appealing destination for electronics manufacturing.
Nepal Electronics Manufacturing Services Market Challenges and Restraints
Despite the promising growth potential, the Nepal Electronics Manufacturing Services Market faces several challenges that need addressing:
- Infrastructure Limitations: Inadequate infrastructure, including transportation and logistics, hampers the efficient movement of goods and materials.
- Skilled Labor Shortage: There is a persistent shortage of skilled labor in the electronics sector, which restricts the ability to scale operations effectively.
- Import Dependency: The market's heavy reliance on imported raw materials increases vulnerability to global supply chain disruptions.
- Compliance Issues: Local EMS companies often struggle with maintaining quality standards and complying with international regulations, which can diminish their competitive edge.
- Intense Competition: The presence of larger international manufacturers creates an intensely competitive environment for local EMS providers, pressuring margins and innovation efforts.
Nepal Electronics Manufacturing Services Market Investment Opportunities
The investment landscape in the Nepal Electronics Manufacturing Services market holds considerable promise due to various favorable factors:
- Young Population: A burgeoning, tech-savvy young population is driving the demand for consumer electronics, presenting significant opportunities for EMS providers.
- Government Incentives: The government's favorable stance on manufacturing, including tax holidays and subsidies, is fostering an attractive environment for investment.
- Rising Local Production: Increasing consumer preference for locally manufactured electronics is encouraging investments in EMS facilities.
- Market Diversification: Investors can explore opportunities across different electronic segments, from basic components to advanced technology products.
- Collaboration Potential: Strategic partnerships between local firms and international companies can enhance technological capabilities and market reach.
Nepal Electronics Manufacturing Services Market Government Investment and Initiatives
The Nepalese government has undertaken numerous initiatives to strengthen the electronics manufacturing sector:
- Tax Holidays: Specific tax reductions or exemptions are provided to electronics manufacturers to alleviate financial burdens and stimulate investment.
- Duty Exemptions: The government has offered duty waivers on the import of crucial raw materials and machinery, facilitating easier market entry for manufacturers.
- R&D Subsidies: Financial support for research and development activities encourages innovation within the local EMS sector, aiming for higher quality standards.
- Regulatory Improvements: Initiatives to streamline regulatory processes are in place, improving the overall ease of doing business in Nepal.
- Infrastructure Development: Ongoing efforts to enhance physical and digital infrastructure are crucial to supporting the electronics manufacturing industry and driving efficiency.
Nepal Electronics Manufacturing Services Market Latest Developments (May 2025 - June 2026)
Recent developments in the Nepal Electronics Manufacturing Services market from May 2025 to June 2026 reveal significant shifts in industry direction:
- Increased Local Manufacturing: There is a marked increase in investment in local manufacturing facilities aimed at catering to the domestic demand for electronics.
- Policy Refinements: Recent adjustments to government policies have focused on further incentivizing local manufacturers to enhance competitiveness.
- Technological Advancements: Adoption of IoT and smart technologies has accelerated, with manufacturers working towards integrating these technologies in their production lines.
- Sustainability Initiatives: Companies have begun adopting more sustainable practices and materials, aligning with global sustainability trends.
- Collaborative Ventures: There has been a rise in collaborative partnerships between local companies and global tech firms, aiming to enhance technological capabilities and market outreach.
Nepal Electronics Manufacturing Services Market - Key Attractiveness of the Report
- 10 Years of Market Numbers
- Historical Data Starting from 2022 to 2025
- Base Year: 2025
- Forecast Data until 2032
- Key Performance Indicators Impacting the Market
- Major Upcoming Developments and Projects
Key Highlights of the Report:
- Nepal Electronics Manufacturing Services Market Outlook
- Market Size of Nepal Electronics Manufacturing Services Market, 2025
- Forecast of Nepal Electronics Manufacturing Services Market, 2032F
- Historical Data and Forecast of Nepal Electronics Manufacturing Services Revenues & Volume for the Period 2022-2032F
- Nepal Electronics Manufacturing Services Market Trend Evolution
- Nepal Electronics Manufacturing Services Market Drivers and Challenges
- Nepal Electronics Manufacturing Services Price Trends
- Nepal Electronics Manufacturing Services Porter's Five Forces
- Nepal Electronics Manufacturing Services Industry Life Cycle
- Historical Data and Forecast of Nepal Electronics Manufacturing Services Market Revenues & Volume By Service for the Period 2022-2032F
- Historical Data and Forecast of Nepal Electronics Manufacturing Services Market Revenues & Volume By Electronics manufacturing services for the Period 2022-2032F
- Historical Data and Forecast of Nepal Electronics Manufacturing Services Market Revenues & Volume By Engineering services for the Period 2022-2032F
- Historical Data and Forecast of Nepal Electronics Manufacturing Services Market Revenues & Volume By Test & development implementation for the Period 2022-2032F
- Historical Data and Forecast of Nepal Electronics Manufacturing Services Market Revenues & Volume By Logistics services for the Period 2022-2032F
- Historical Data and Forecast of Nepal Electronics Manufacturing Services Market Revenues & Volume By Others for the Period 2022-2032F
- Historical Data and Forecast of Nepal Electronics Manufacturing Services Market Revenues & Volume By Application for the Period 2022-2032F
- Historical Data and Forecast of Nepal Electronics Manufacturing Services Market Revenues & Volume By Computer for the Period 2022-2032F
- Historical Data and Forecast of Nepal Electronics Manufacturing Services Market Revenues & Volume By Consumer Electronics for the Period 2022-2032F
- Historical Data and Forecast of Nepal Electronics Manufacturing Services Market Revenues & Volume By Aerospace & Defense for the Period 2022-2032F
- Historical Data and Forecast of Nepal Electronics Manufacturing Services Market Revenues & Volume By Medical & Healthcare for the Period 2022-2032F
- Historical Data and Forecast of Nepal Electronics Manufacturing Services Market Revenues & Volume By Automotive for the Period 2022-2032F
- Historical Data and Forecast of Nepal Electronics Manufacturing Services Market Revenues & Volume By Others for the Period 2022-2032F
- Nepal Electronics Manufacturing Services Import Export Trade Statistics
- Market Opportunity Assessment By Service
- Market Opportunity Assessment By Application
- Nepal Electronics Manufacturing Services Top Companies Market Share
- Nepal Electronics Manufacturing Services Competitive Benchmarking By Technical and Operational Parameters
- Nepal Electronics Manufacturing Services Company Profiles
- Nepal Electronics Manufacturing Services Key Strategic Recommendations
Frequently Asked Questions About the Market Study (FAQs):
Growth is driven primarily by increasing local demand for electronic products, favorable government policies, and the integration of advanced technologies in manufacturing processes.
Challenges include limited infrastructure, a shortage of skilled labor, high reliance on imports for raw materials, and compliance issues with international standards.
The government provides various incentives such as tax breaks, duty exemptions on imports, and subsidies for R&D to support the growth of local manufacturing.
Investors can explore opportunities in PCB assembly, product design, and other areas within the EMS sector, supported by favorable government policies and growing local demand.
6Wresearch actively monitors the Nepal Electronics Manufacturing Services Market and publishes its comprehensive annual report, highlighting emerging trends, growth drivers, revenue analysis, and forecast outlook. Our insights help businesses to make data-backed strategic decisions with ongoing market dynamics. Our analysts track relevent industries related to the Nepal Electronics Manufacturing Services Market, allowing our clients with actionable intelligence and reliable forecasts tailored to emerging regional needs.
Yes, we provide customisation as per your requirements. To learn more, feel free to contact us on sales@6wresearch.com
1 Executive Summary |
2 Introduction |
2.1 Key Highlights of the Report |
2.2 Report Description |
2.3 Market Scope & Segmentation |
2.4 Research Methodology |
2.5 Assumptions |
3 Nepal Electronics Manufacturing Services Market Overview |
3.1 Nepal Country Macro Economic Indicators |
3.2 Nepal Electronics Manufacturing Services Market Revenues & Volume, 2022 & 2032F |
3.3 Nepal Electronics Manufacturing Services Market - Industry Life Cycle |
3.4 Nepal Electronics Manufacturing Services Market - Porter's Five Forces |
3.5 Nepal Electronics Manufacturing Services Market Revenues & Volume Share, By Service, 2022 & 2032F |
3.6 Nepal Electronics Manufacturing Services Market Revenues & Volume Share, By Application, 2022 & 2032F |
4 Nepal Electronics Manufacturing Services Market Dynamics |
4.1 Impact Analysis |
4.2 Market Drivers |
4.3 Market Restraints |
5 Nepal Electronics Manufacturing Services Market Trends |
6 Nepal Electronics Manufacturing Services Market, By Types |
6.1 Nepal Electronics Manufacturing Services Market, By Service |
6.1.1 Overview and Analysis |
6.1.2 Nepal Electronics Manufacturing Services Market Revenues & Volume, By Service, 2022-2032F |
6.1.3 Nepal Electronics Manufacturing Services Market Revenues & Volume, By Electronics manufacturing services, 2022-2032F |
6.1.4 Nepal Electronics Manufacturing Services Market Revenues & Volume, By Engineering services, 2022-2032F |
6.1.5 Nepal Electronics Manufacturing Services Market Revenues & Volume, By Test & development implementation, 2022-2032F |
6.1.6 Nepal Electronics Manufacturing Services Market Revenues & Volume, By Logistics services, 2022-2032F |
6.1.7 Nepal Electronics Manufacturing Services Market Revenues & Volume, By Others, 2022-2032F |
6.2 Nepal Electronics Manufacturing Services Market, By Application |
6.2.1 Overview and Analysis |
6.2.2 Nepal Electronics Manufacturing Services Market Revenues & Volume, By Computer, 2022-2032F |
6.2.3 Nepal Electronics Manufacturing Services Market Revenues & Volume, By Consumer Electronics, 2022-2032F |
6.2.4 Nepal Electronics Manufacturing Services Market Revenues & Volume, By Aerospace & Defense, 2022-2032F |
6.2.5 Nepal Electronics Manufacturing Services Market Revenues & Volume, By Medical & Healthcare, 2022-2032F |
6.2.6 Nepal Electronics Manufacturing Services Market Revenues & Volume, By Automotive, 2022-2032F |
6.2.7 Nepal Electronics Manufacturing Services Market Revenues & Volume, By Others, 2022-2032F |
7 Nepal Electronics Manufacturing Services Market Import-Export Trade Statistics |
7.1 Nepal Electronics Manufacturing Services Market Export to Major Countries |
7.2 Nepal Electronics Manufacturing Services Market Imports from Major Countries |
8 Nepal Electronics Manufacturing Services Market Key Performance Indicators |
9 Nepal Electronics Manufacturing Services Market - Opportunity Assessment |
9.1 Nepal Electronics Manufacturing Services Market Opportunity Assessment, By Service, 2022 & 2032F |
9.2 Nepal Electronics Manufacturing Services Market Opportunity Assessment, By Application, 2022 & 2032F |
10 Nepal Electronics Manufacturing Services Market - Competitive Landscape |
10.1 Nepal Electronics Manufacturing Services Market Revenue Share, By Companies, 2025 |
10.2 Nepal Electronics Manufacturing Services Market Competitive Benchmarking, By Operating and Technical Parameters |
11 Company Profiles |
12 Recommendations |
13 Disclaimer |
Global Go To Market Strategy - 2030
Export potential enables firms to identify high-growth global markets with greater confidence by combining advanced trade intelligence with a structured quantitative methodology. The framework analyzes emerging demand trends and country-level import patterns while integrating macroeconomic and trade datasets such as GDP and population forecasts, bilateral import–export flows, tariff structures, elasticity differentials between developed and developing economies, geographic distance, and import demand projections. Using weighted trade values from 2020–2024 as the base period to project country-to-country export potential for 2030, these inputs are operationalized through calculated drivers such as gravity model parameters, tariff impact factors, and projected GDP per-capita growth. Through an analysis of hidden potentials, demand hotspots, and market conditions that are most favorable to success, this method enables firms to focus on target countries, maximize returns, and global expansion with data, backed by accuracy.
By factoring in the projected importer demand gap that is currently unmet and could be potential opportunity, it identifies the potential for the Exporter (Country) among 190 countries, against the general trade analysis, which identifies the biggest importer or exporter.
To discover high-growth global markets and optimize your business strategy:
Click Here
Pricing
- Single User License$ 1,995
- Department License$ 2,400
- Site License$ 3,120
- Global License$ 3,795

Leadership Perspectives from Industry Events
Search
Thought Leadership and Analyst Meet


Our Clients
6WResearch In News
- India Air Conditioner Market Set for Strong Rebound in 2026 After Weather-Led Correction and GST-Driven Recovery: 6Wresearch
- ADAS in India: How Automatic Emergency Braking, Blind Spot Detection & Driver Monitoring are Transforming Road Safety
- Doha a strategic location for EV manufacturing hub: IPA Qatar
- Demand for luxury TVs surging in the GCC, says Samsung
- Empowering Growth: The Thriving Journey of Bangladesh’s Cable Industry
- Demand for luxury TVs surging in the GCC, says Samsung
Latest Reports
- Nicaragua RPG Gaming Market (2026-2032)
- New Zealand RPG Gaming Market (2026-2032)
- Netherlands RPG Gaming Market (2026-2032)
- Nauru RPG Gaming Market (2026-2032)
- Namibia RPG Gaming Market (2026-2032)
- Mozambique RPG Gaming Market (2026-2032)
- Montenegro RPG Gaming Market (2026-2032)
- Mongolia RPG Gaming Market (2026-2032)
- Monaco RPG Gaming Market (2026-2032)
- Micronesia RPG Gaming Market (2026-2032)
Industry Events and Analyst Meet

HIMTEX 2026

India Refining Summit 2026

India EV Show 2026

EV tech India Expo 2026

Auto Tech Asia 2026
Whitepaper
- Middle East & Africa Commercial Security Market Click here to view more.
- Middle East & Africa Fire Safety Systems & Equipment Market Click here to view more.
- GCC Drone Market Click here to view more.
- Middle East Lighting Fixture Market Click here to view more.
- GCC Physical & Perimeter Security Market Click here to view more.